| Param | Original file | Final file |
|---|---|---|
| Filename | modeM0/AS1C07_005T01_9000004992_34869cztM0_level2.evt | modeM0/AS1C07_005T01_9000004992_34869cztM0_level2_quad_clean.evt |
| Size (bytes) | 447,857,280 | 87,212,160 |
| Size | 427.1 MB | 83.2 MB |
| Events in quadrant A | 2,642,890 | 585,839 |
| Events in quadrant B | 3,960,444 | 577,508 |
| Events in quadrant C | 2,813,669 | 575,155 |
| Events in quadrant D | 3,801,060 | 545,945 |
| Mode M9 | |||
|---|---|---|---|
| Quadrant | BADHDUFLAG | Total packets | Discarded packets |
| A | 0 | 29 | 0 |
| B | 0 | 29 | 0 |
| C | 0 | 29 | 0 |
| D | 0 | 30 | 0 |
| Mode M0 | |||
|---|---|---|---|
| Quadrant | BADHDUFLAG | Total packets | Discarded packets |
| A | 0 | 11011 | 3 |
| B | 0 | 15062 | 2 |
| C | 0 | 11360 | 2 |
| D | 0 | 14749 | 2 |
| Mode SS | |||
|---|---|---|---|
| Quadrant | BADHDUFLAG | Total packets | Discarded packets |
| A | 0 | 104 | 0 |
| B | 0 | 104 | 0 |
| C | 0 | 104 | 0 |
| D | 0 | 104 | 0 |
| Quadrant | Total seconds | Saturated seconds | Saturation percentage |
|---|---|---|---|
| A | 5085 | 102 | 2.005900% |
| B | 5085 | 471 | 9.262537% |
| C | 5085 | 73 | 1.435595% |
| D | 5085 | 138 | 2.713864% |
Noise dominated data is calculated using 1-second bins in cleaned event files. If a bin has >2000 counts, and if more than 50% of those come from <1% of pixels, then it is considered to be noise-dominated and hence unusable.
| Quadrant | # 1 sec bins | Bins with >0 counts | Bins with >2000 counts | High rate bins dominated by noise | Noise dominated (total time) | Noise dominated (detector-on time) | Marked lightcurve |
|---|---|---|---|---|---|---|---|
| A | 6997 | 5086 | 81 | 81 | 1.16% | 1.59% | 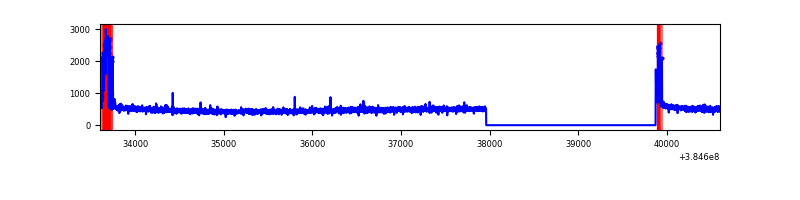 |
| B | 6997 | 5086 | 346 | 346 | 4.94% | 6.80% | 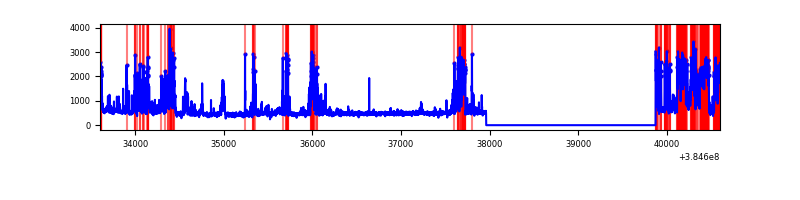 |
| C | 6997 | 5086 | 62 | 62 | 0.89% | 1.22% | 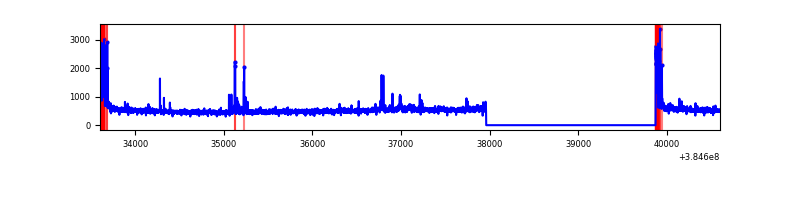 |
| D | 6997 | 5086 | 135 | 135 | 1.93% | 2.65% | 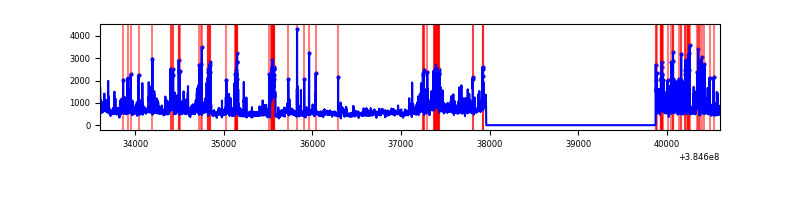 |
Top three noisy pixels from each quadrant. If the there are fewer than three noisy pixels in the level2.evt file, extra rows are filled as -1
| Pixel properties | Quadrant properties | ||||||
|---|---|---|---|---|---|---|---|
| Quadrant | DetID | PixID | Counts | Sigma | Mean | Median | Sigma |
| A | 15 | 237 | 218767 | 1819.88 | 603 | 593 | 119.9 |
| A | 10 | 83 | 49358 | 406.77 | 603 | 593 | 119.9 |
| A | 13 | 6 | 21151 | 171.48 | 603 | 593 | 119.9 |
| B | 5 | 172 | 546374 | 4883.93 | 592 | 578 | 111.8 |
| B | 5 | 31 | 368422 | 3291.56 | 592 | 578 | 111.8 |
| B | 0 | 190 | 306986 | 2741.82 | 592 | 578 | 111.8 |
| C | 15 | 214 | 216051 | 1603.48 | 583 | 586 | 134.4 |
| C | 0 | 10 | 196939 | 1461.25 | 583 | 586 | 134.4 |
| C | 0 | 207 | 46384 | 340.83 | 583 | 586 | 134.4 |
| D | 8 | 195 | 569380 | 4041.7 | 579 | 564 | 140.7 |
| D | 1 | 52 | 253349 | 1796.16 | 579 | 564 | 140.7 |
| D | 12 | 6 | 171177 | 1212.29 | 579 | 564 | 140.7 |
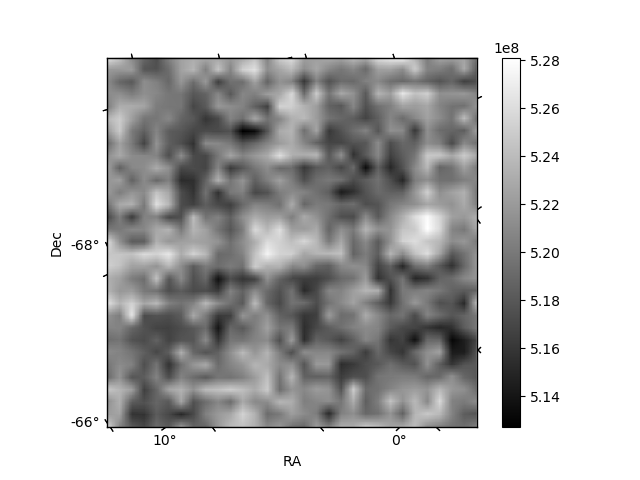
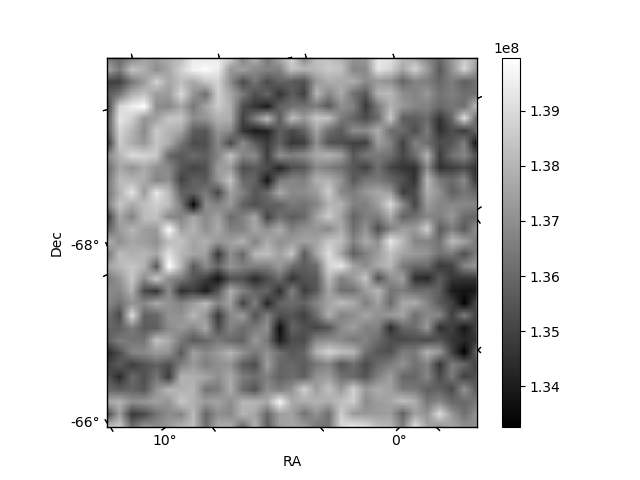
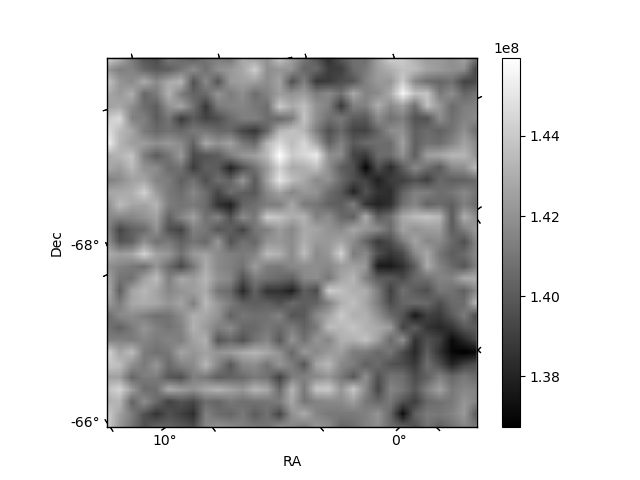
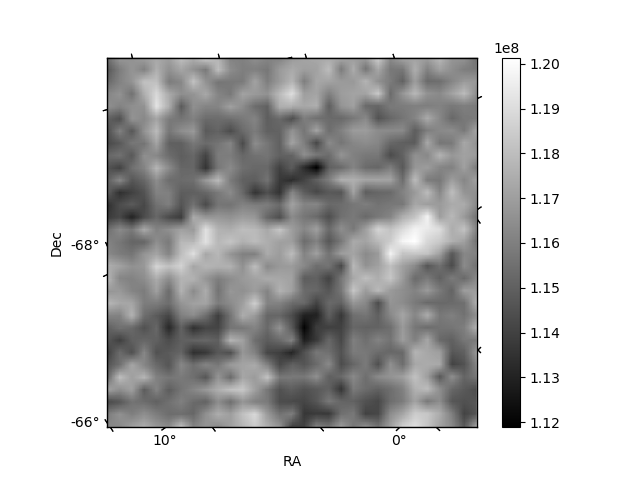
Histogram calculated using DETX and DETY for each event in the final _common_clean file
| Quadrant A | 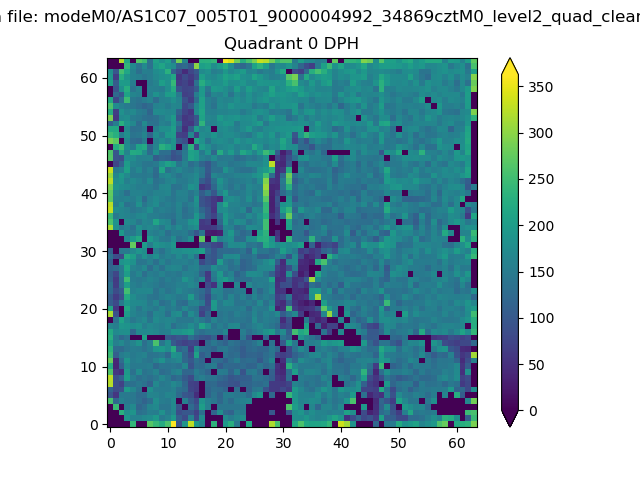 |
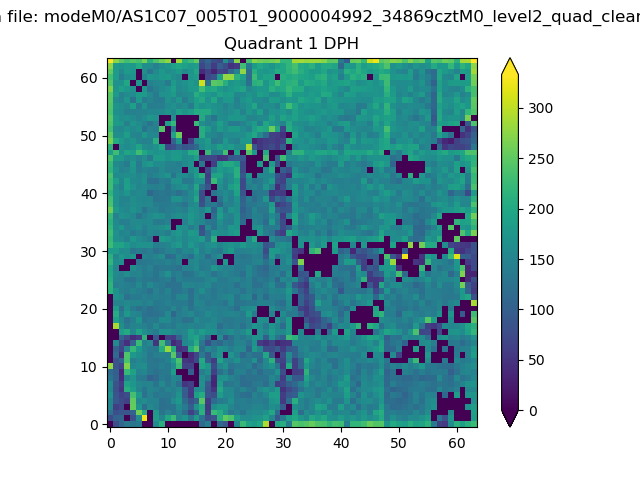 |
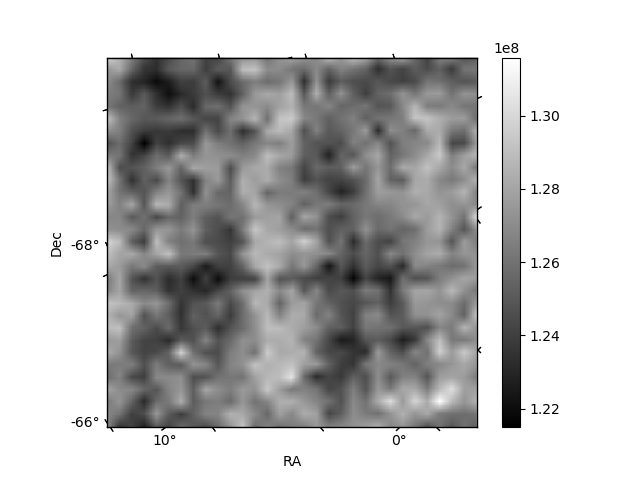
Quadrant B |
|---|---|---|---|
| Quadrant D | 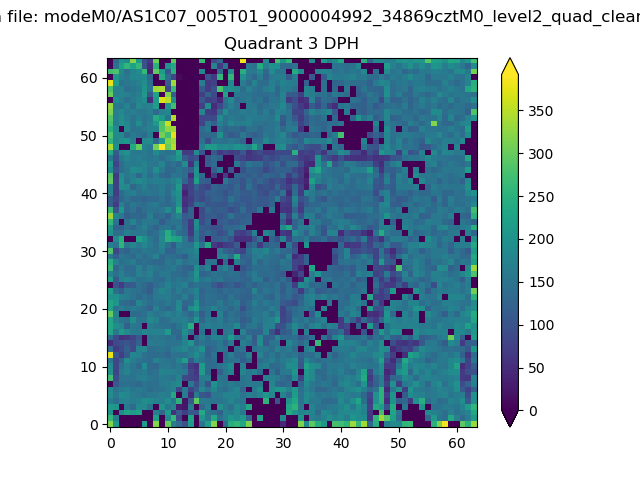 |
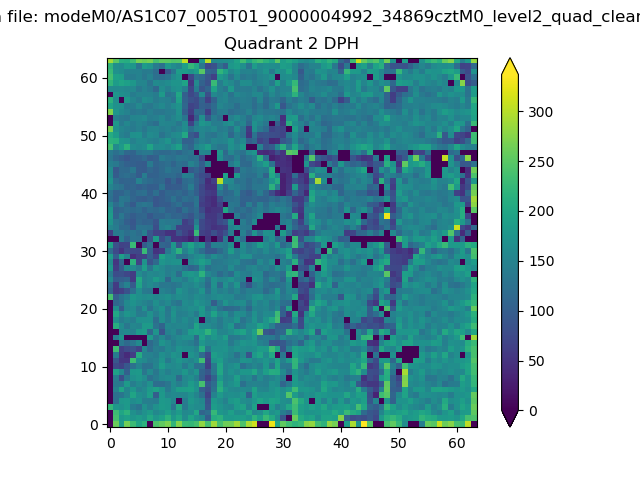 |
Quadrant C |
| Plot type | Count rate plots | Images |
|---|---|---|
| Comparison with Poisson distribution Blue bars denote a histogram of data divided into 1 sec bins. Red curve is a Poisson curve with rate = median count rate of data. |
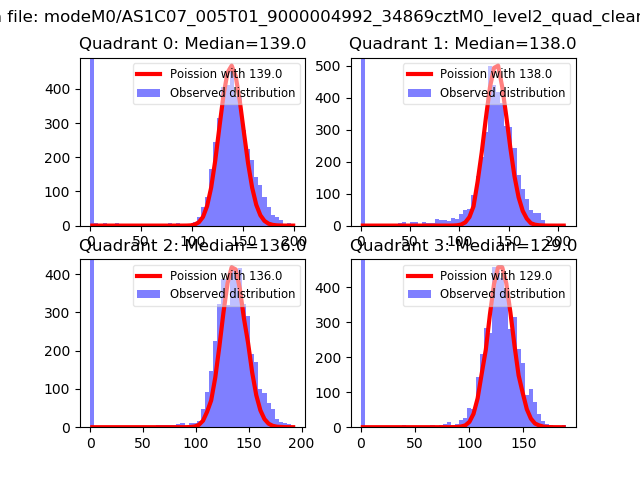 |
 |
| Quadrant-wise count rates Data is divided into 100 sec bins |
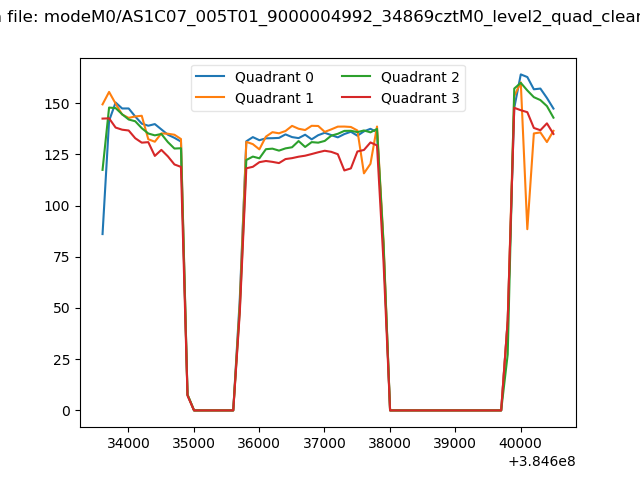 |
|
| Module-wise count rates for Quadrant A Data is divided into 100 sec bins |
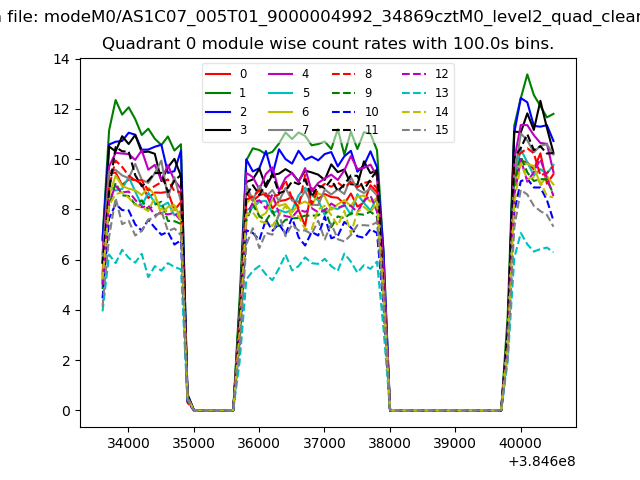 |
 |
| Module-wise count rates for Quadrant B Data is divided into 100 sec bins |
 |
 |
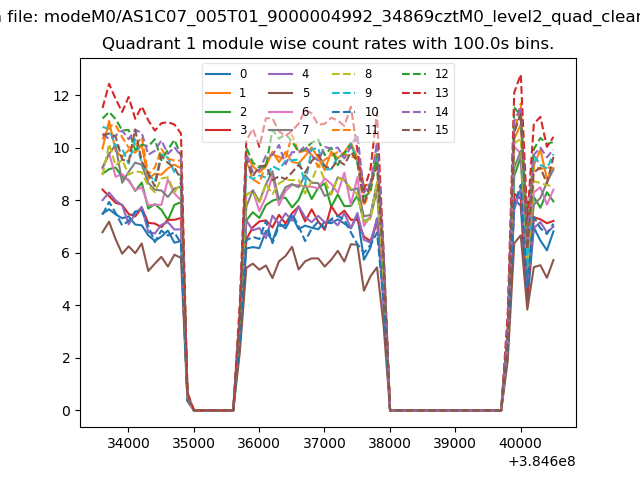
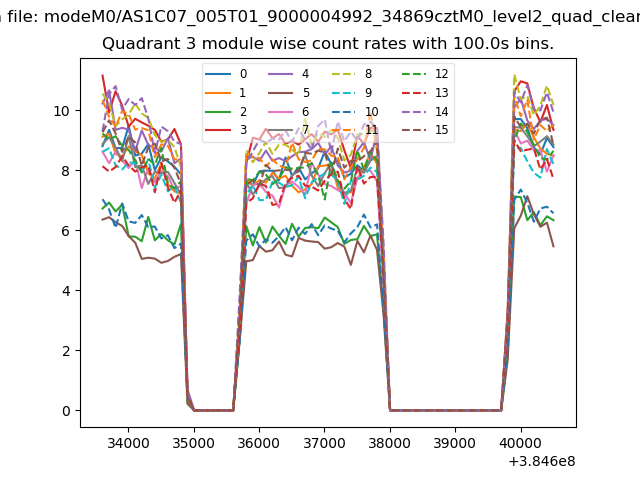
| Module-wise count rates for Quadrant C Data is divided into 100 sec bins |
 |
 |
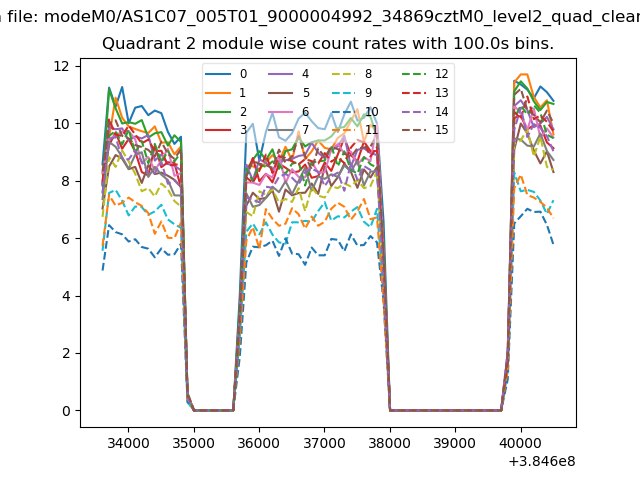
| Module-wise count rates for Quadrant D Data is divided into 100 sec bins |
 |
 |
| Parameter | Plot |
|---|---|
| CZT HV Monitor | 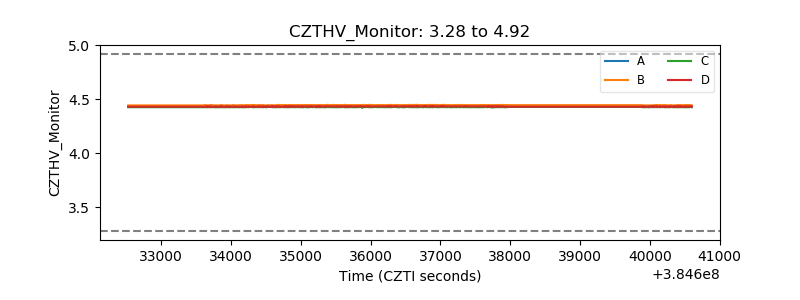 |
| D_VDD | 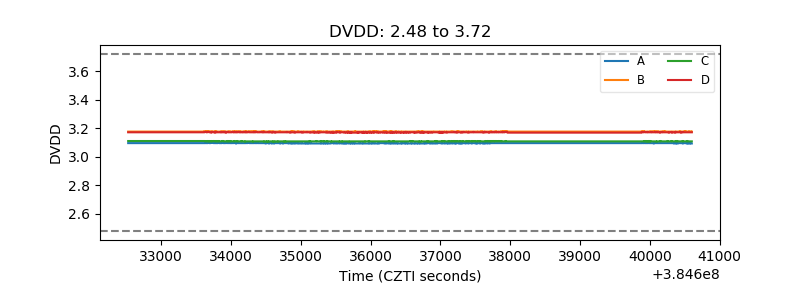 |
| Temperature 1 | 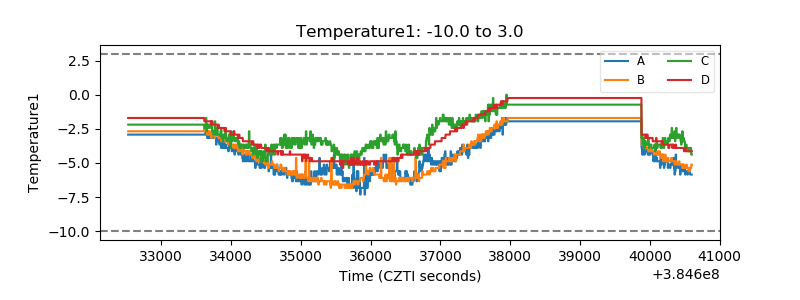 |
| Veto HV Monitor | 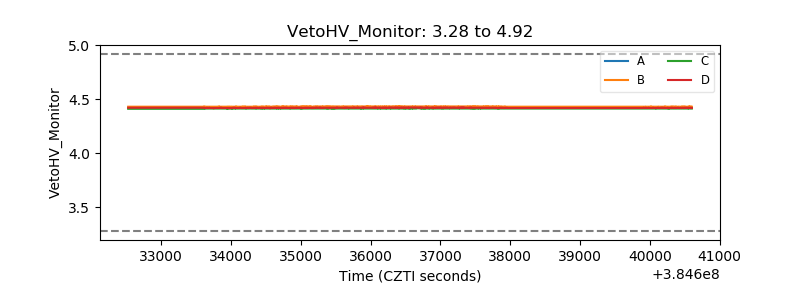 |
| Veto LLD | 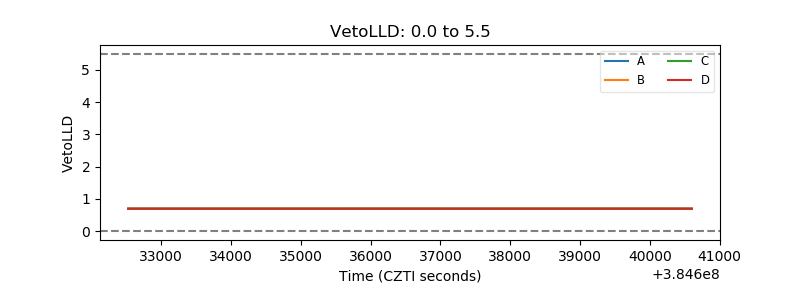 |
| Alpha Counter | 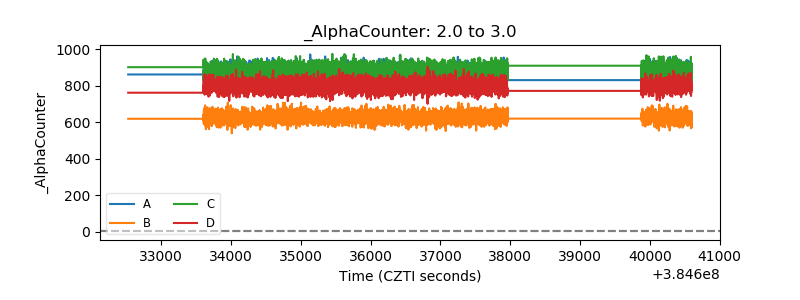 |
| _CPM_Rate | 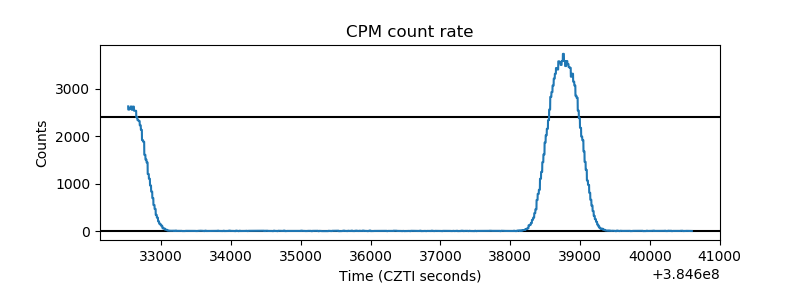 |
| CZT Counter | 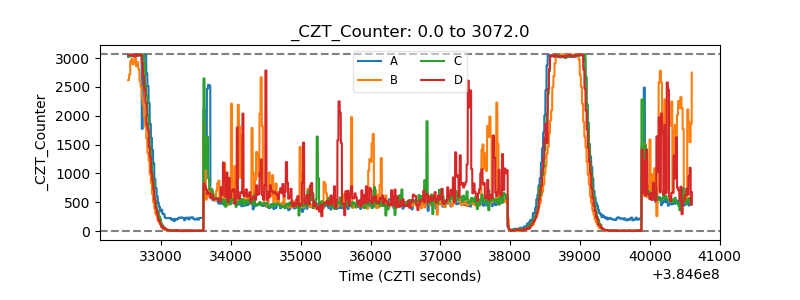 |
| +2.5 Volts monitor | 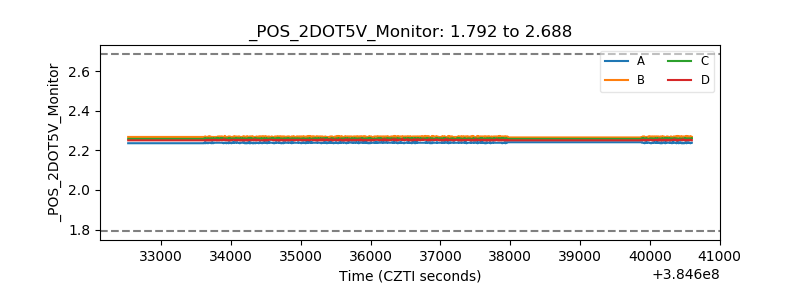 |
| +5 Volts monitor | 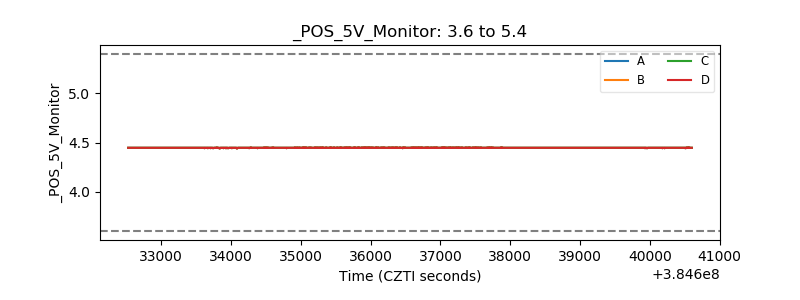 |
| _ROLL_ROT | 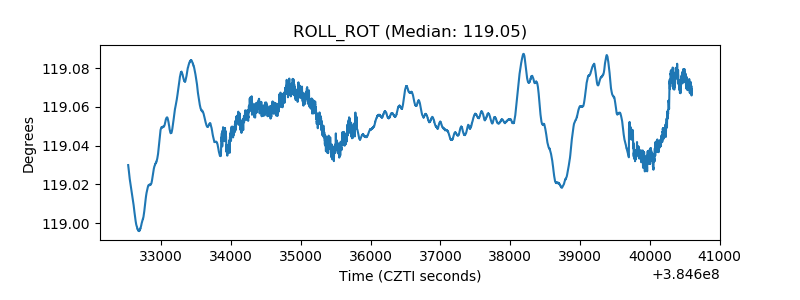 |
| _Roll_DEC | 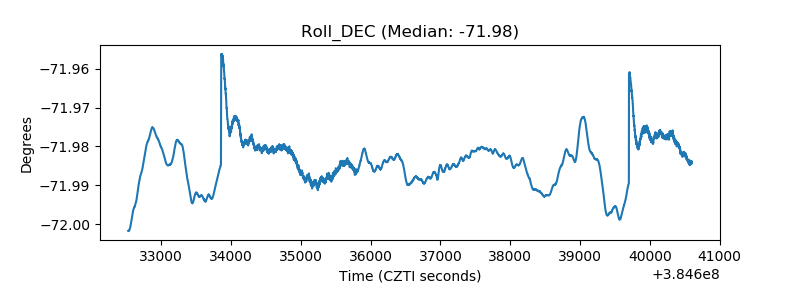 |
| _Roll_RA | 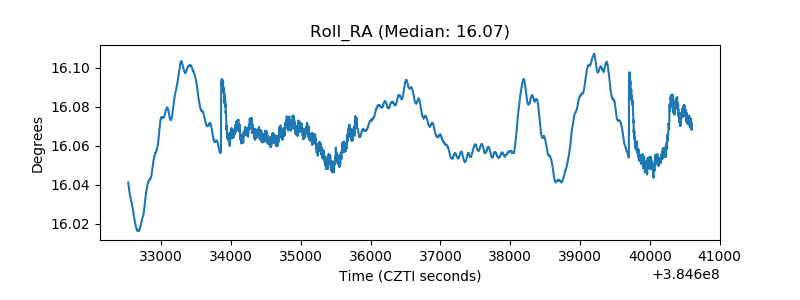 |
| Veto Counter | 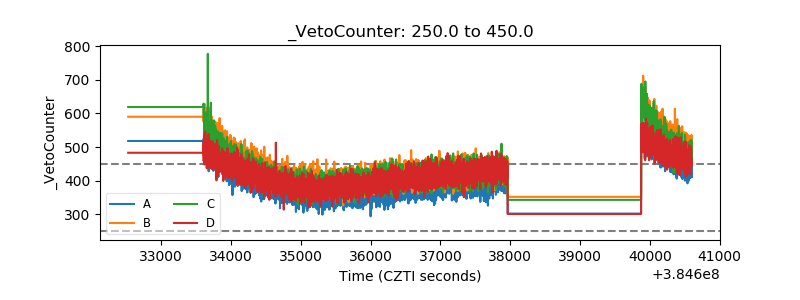 |