| Param | Original file | Final file |
|---|---|---|
| Filename | modeM0/AS1C07_005T01_9000004992_34866cztM0_level2.evt | modeM0/AS1C07_005T01_9000004992_34866cztM0_level2_quad_clean.evt |
| Size (bytes) | 780,275,520 | 81,705,600 |
| Size | 744.1 MB | 77.9 MB |
| Events in quadrant A | 2,907,881 | 581,955 |
| Events in quadrant B | 10,096,777 | 465,403 |
| Events in quadrant C | 3,153,768 | 567,437 |
| Events in quadrant D | 7,106,725 | 478,459 |
| Mode M9 | |||
|---|---|---|---|
| Quadrant | BADHDUFLAG | Total packets | Discarded packets |
| A | 0 | 19 | 0 |
| B | 0 | 19 | 0 |
| C | 0 | 19 | 0 |
| D | 0 | 20 | 0 |
| Mode M0 | |||
|---|---|---|---|
| Quadrant | BADHDUFLAG | Total packets | Discarded packets |
| A | 0 | 12340 | 3 |
| B | 0 | 33713 | 2 |
| C | 0 | 12595 | 2 |
| D | 0 | 24852 | 2 |
| Mode SS | |||
|---|---|---|---|
| Quadrant | BADHDUFLAG | Total packets | Discarded packets |
| A | 0 | 110 | 0 |
| B | 0 | 110 | 0 |
| C | 0 | 110 | 0 |
| D | 0 | 110 | 0 |
| Quadrant | Total seconds | Saturated seconds | Saturation percentage |
|---|---|---|---|
| A | 5419 | 60 | 1.107215% |
| B | 5419 | 3346 | 61.745710% |
| C | 5419 | 113 | 2.085256% |
| D | 5419 | 1321 | 24.377191% |
Noise dominated data is calculated using 1-second bins in cleaned event files. If a bin has >2000 counts, and if more than 50% of those come from <1% of pixels, then it is considered to be noise-dominated and hence unusable.
| Quadrant | # 1 sec bins | Bins with >0 counts | Bins with >2000 counts | High rate bins dominated by noise | Noise dominated (total time) | Noise dominated (detector-on time) | Marked lightcurve |
|---|---|---|---|---|---|---|---|
| A | 7061 | 5420 | 44 | 44 | 0.62% | 0.81% | 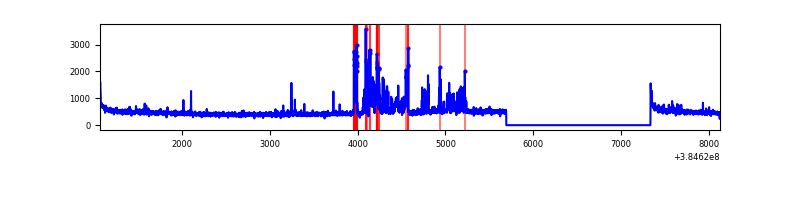 |
| B | 7061 | 5420 | 2865 | 2865 | 40.57% | 52.86% | 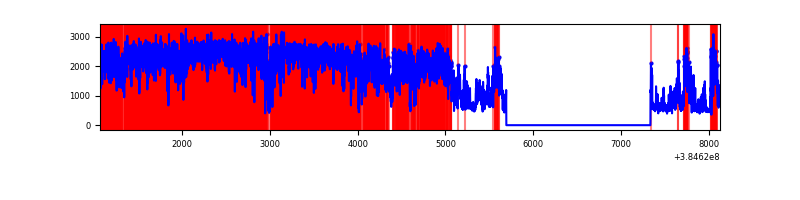 |
| C | 7061 | 5420 | 104 | 104 | 1.47% | 1.92% | 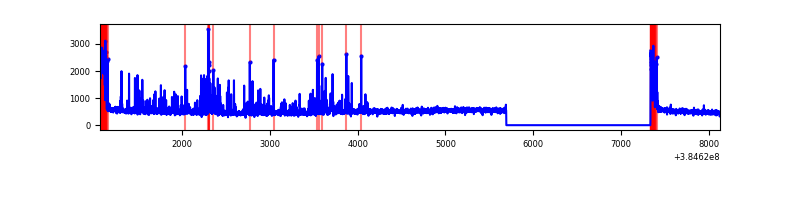 |
| D | 7061 | 5420 | 1326 | 1326 | 18.78% | 24.46% | 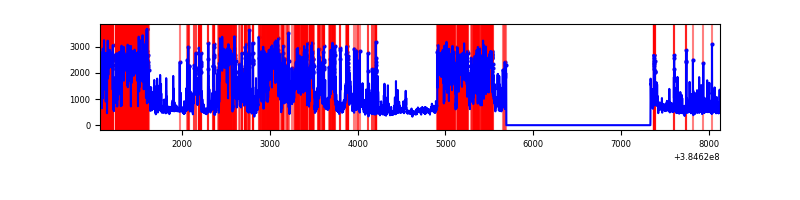 |
Top three noisy pixels from each quadrant. If the there are fewer than three noisy pixels in the level2.evt file, extra rows are filled as -1
| Pixel properties | Quadrant properties | ||||||
|---|---|---|---|---|---|---|---|
| Quadrant | DetID | PixID | Counts | Sigma | Mean | Median | Sigma |
| A | 15 | 169 | 418707 | 3306.74 | 622 | 609 | 126.4 |
| A | 10 | 83 | 57623 | 450.92 | 622 | 609 | 126.4 |
| A | 13 | 6 | 11854 | 88.94 | 622 | 609 | 126.4 |
| B | 5 | 31 | 4901792 | 49787.49 | 511 | 498 | 98.4 |
| B | 5 | 15 | 2541101 | 25807.52 | 511 | 498 | 98.4 |
| B | 5 | 172 | 327651 | 3323.23 | 511 | 498 | 98.4 |
| C | 0 | 207 | 297110 | 2155.13 | 593 | 597 | 137.6 |
| C | 0 | 10 | 268503 | 1947.21 | 593 | 597 | 137.6 |
| C | 15 | 214 | 229001 | 1660.1 | 593 | 597 | 137.6 |
| D | 12 | 227 | 3156357 | 23084.98 | 543 | 527 | 136.7 |
| D | 12 | 233 | 1078280 | 7883.79 | 543 | 527 | 136.7 |
| D | 8 | 195 | 452465 | 3305.94 | 543 | 527 | 136.7 |
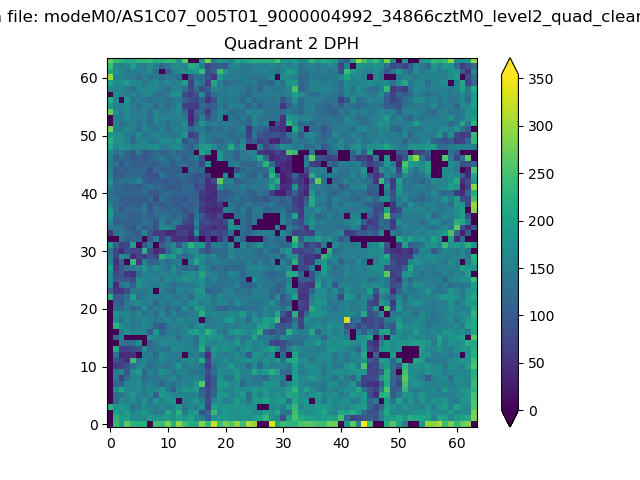
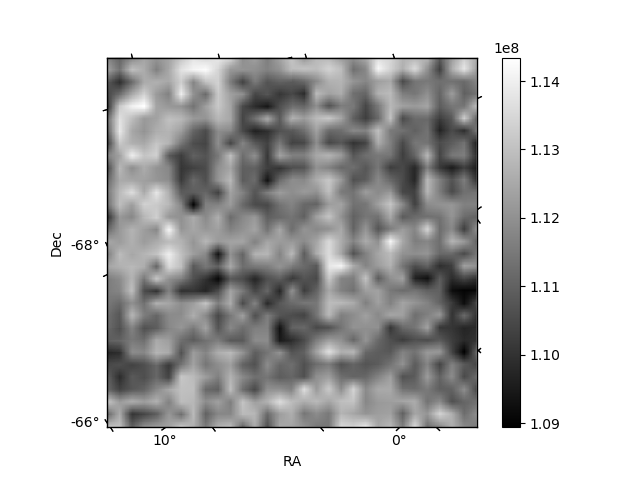
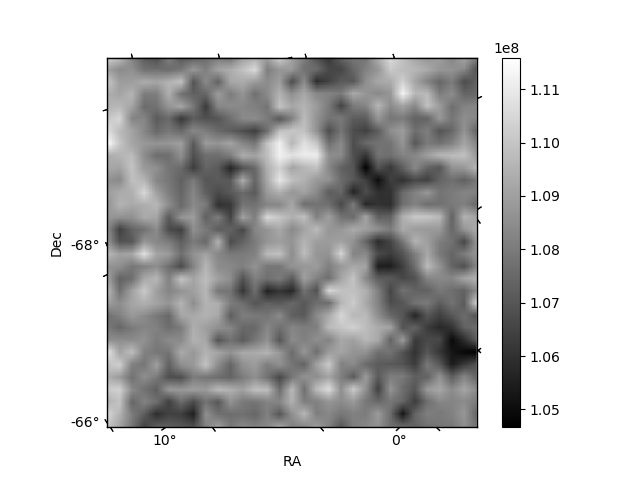
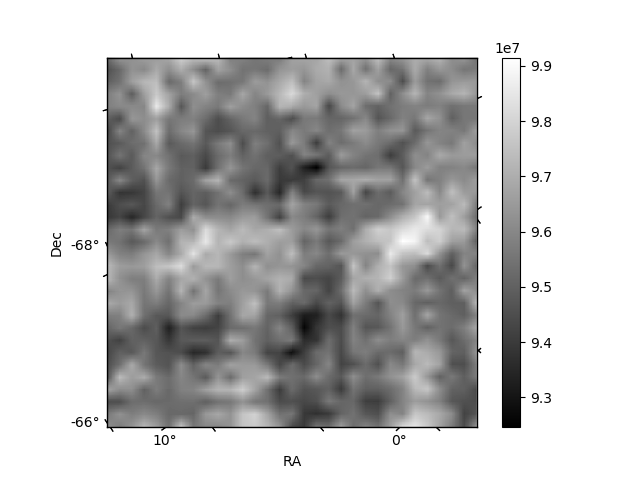
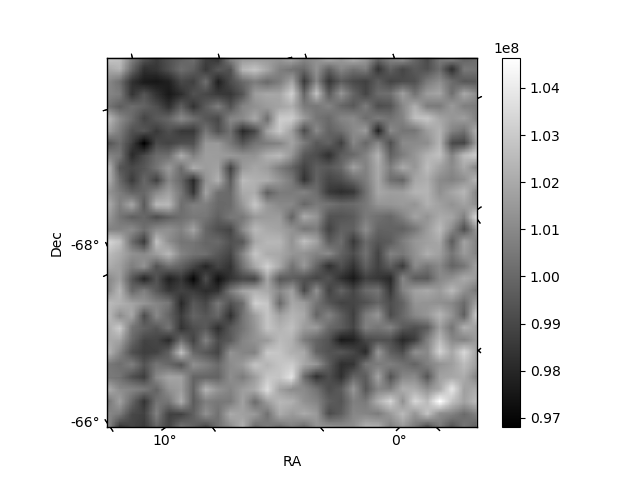
Histogram calculated using DETX and DETY for each event in the final _common_clean file
| Quadrant A | 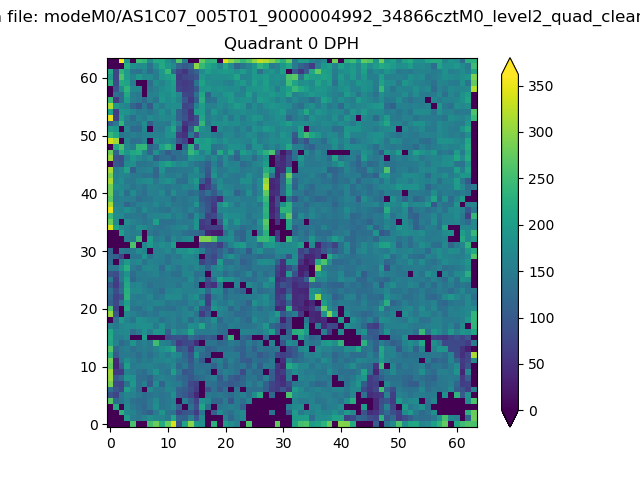 |
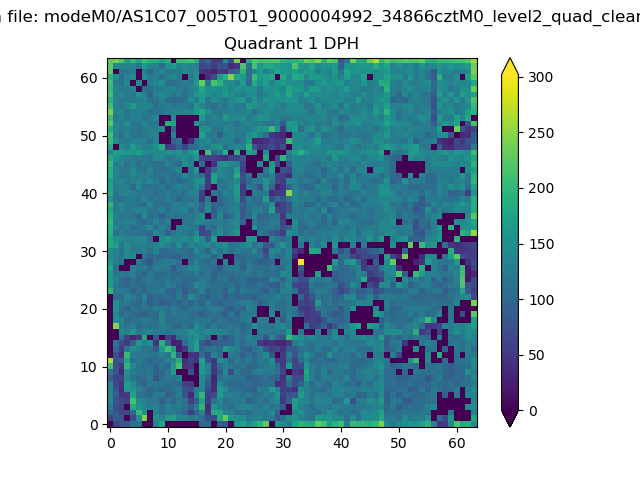 |
Quadrant B |
|---|---|---|---|
| Quadrant D | 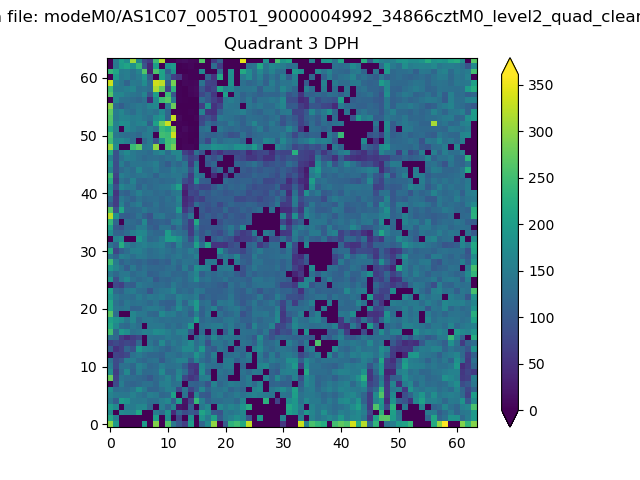 |
 |
Quadrant C |
| Plot type | Count rate plots | Images |
|---|---|---|
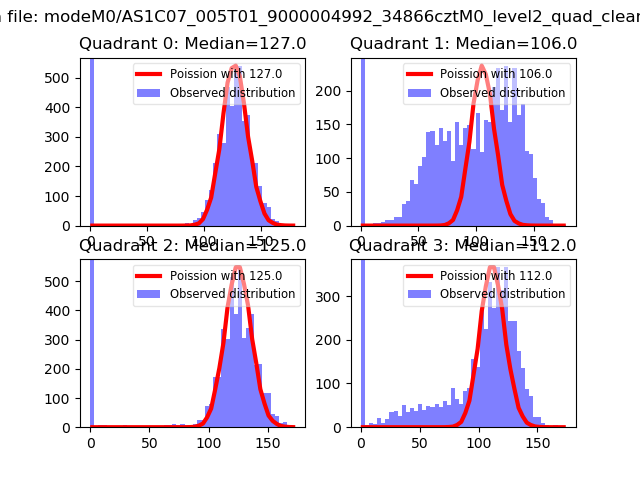
| Comparison with Poisson distribution Blue bars denote a histogram of data divided into 1 sec bins. Red curve is a Poisson curve with rate = median count rate of data. |
 |
 |
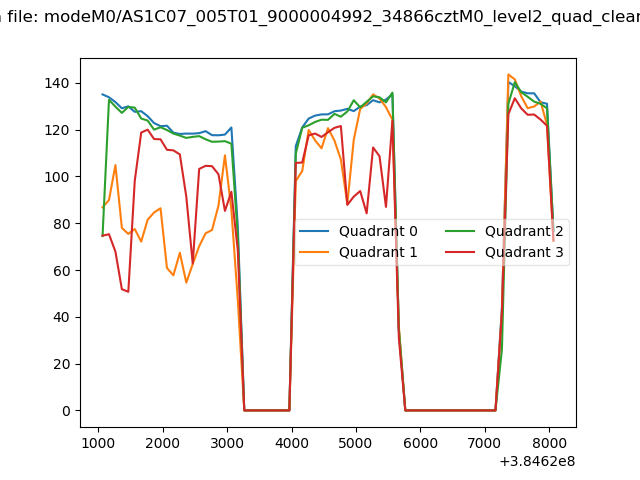
| Quadrant-wise count rates Data is divided into 100 sec bins |
 |
|
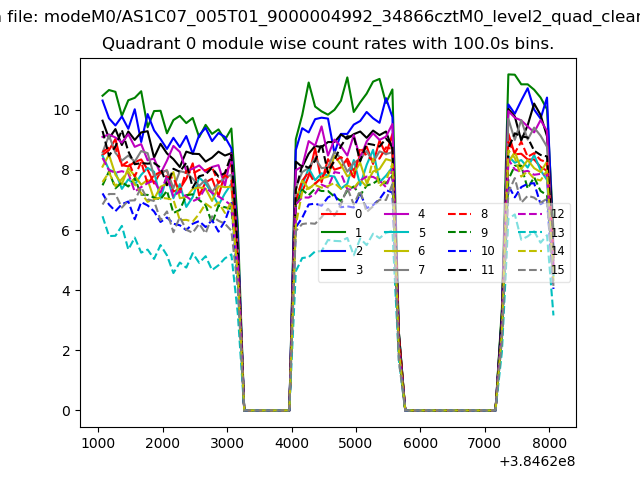
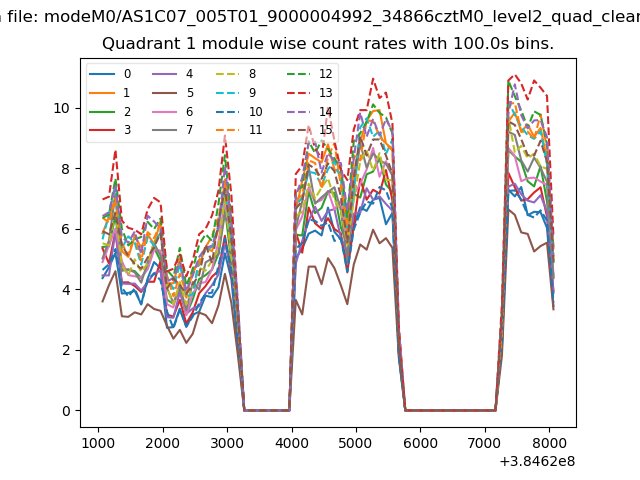
| Module-wise count rates for Quadrant A Data is divided into 100 sec bins |
 |
 |
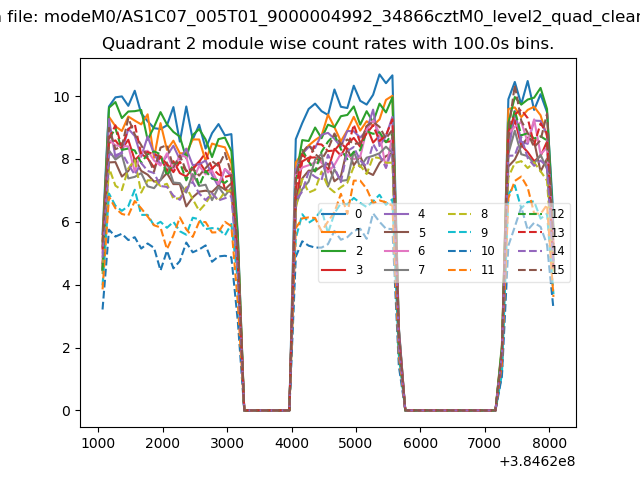
| Module-wise count rates for Quadrant B Data is divided into 100 sec bins |
 |
 |
| Module-wise count rates for Quadrant C Data is divided into 100 sec bins |
 |
 |
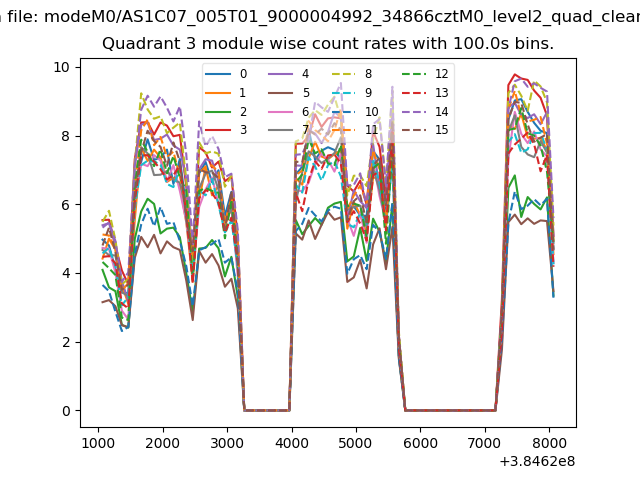
| Module-wise count rates for Quadrant D Data is divided into 100 sec bins |
 |
 |
| Parameter | Plot |
|---|---|
| CZT HV Monitor |  |
| D_VDD | 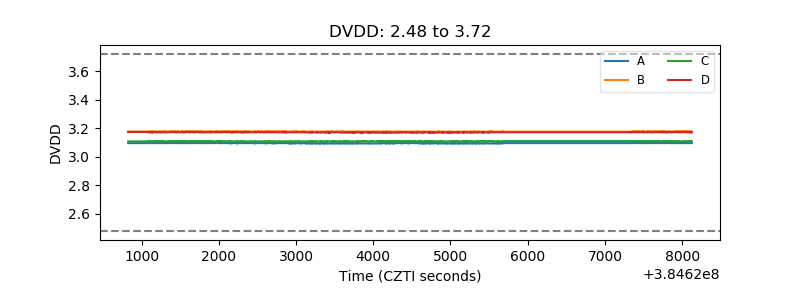 |
| Temperature 1 | 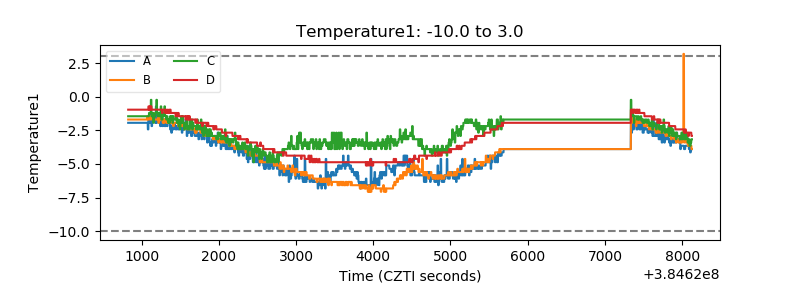 |
| Veto HV Monitor | 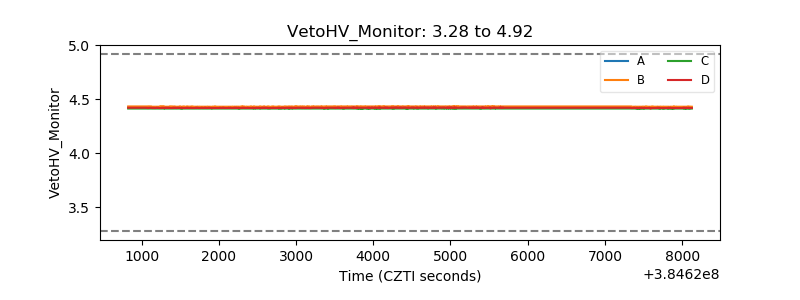 |
| Veto LLD | 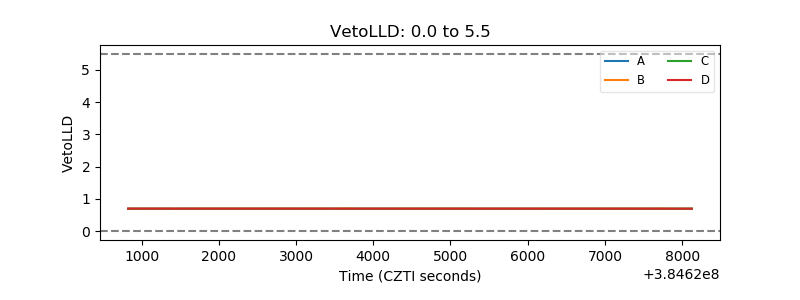 |
| Alpha Counter | 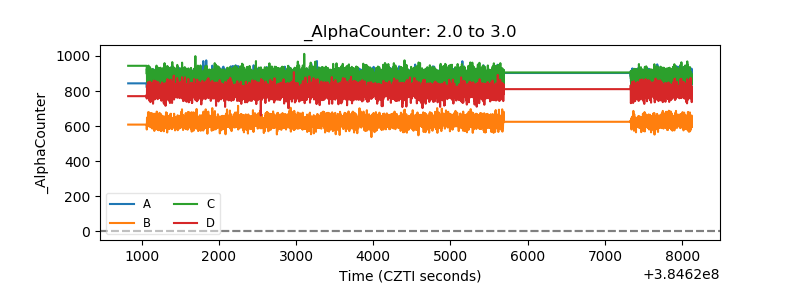 |
| _CPM_Rate | 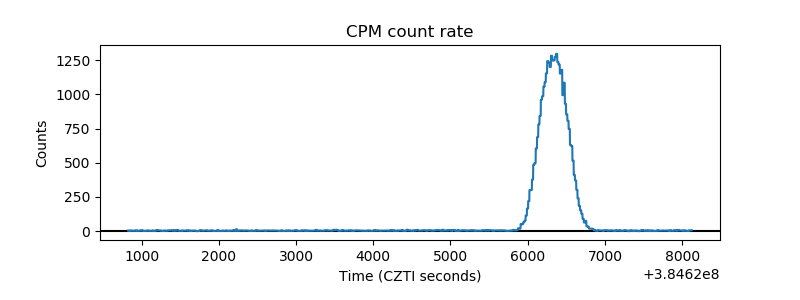 |
| CZT Counter | 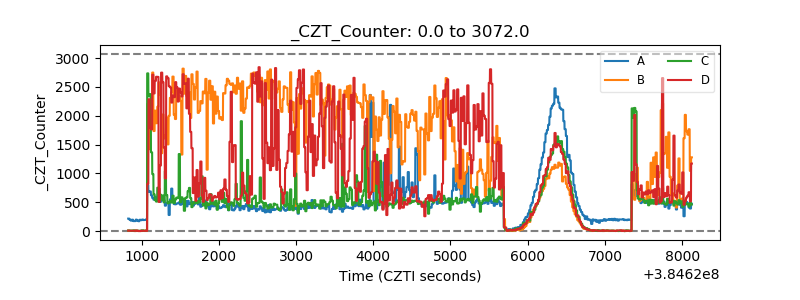 |
| +2.5 Volts monitor | 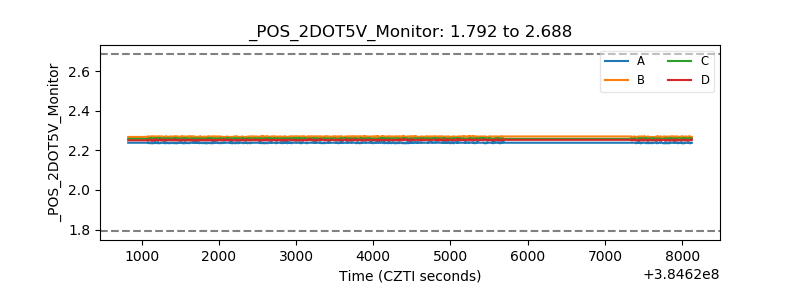 |
| +5 Volts monitor | 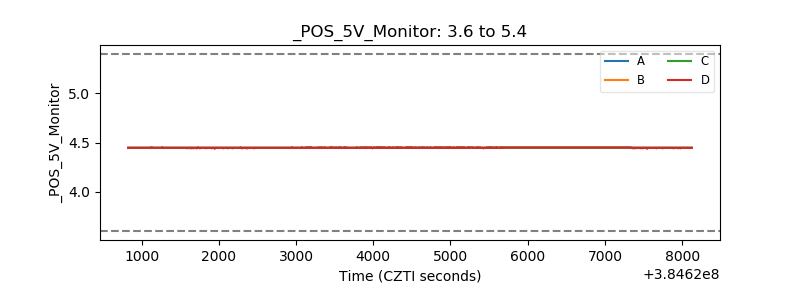 |
| _ROLL_ROT | 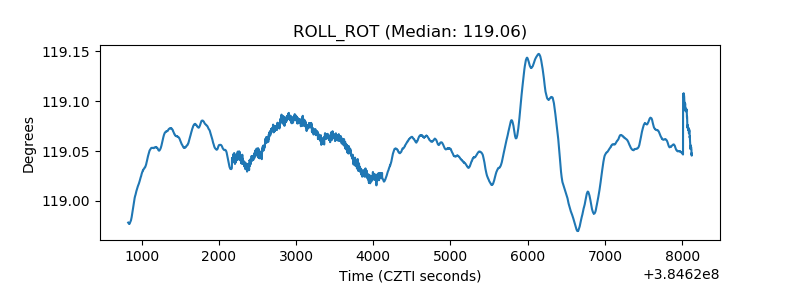 |
| _Roll_DEC | 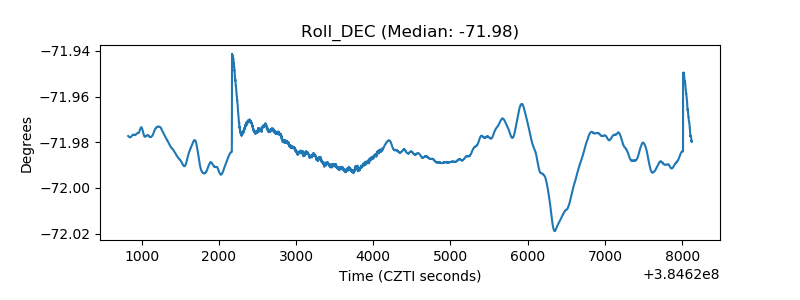 |
| _Roll_RA | 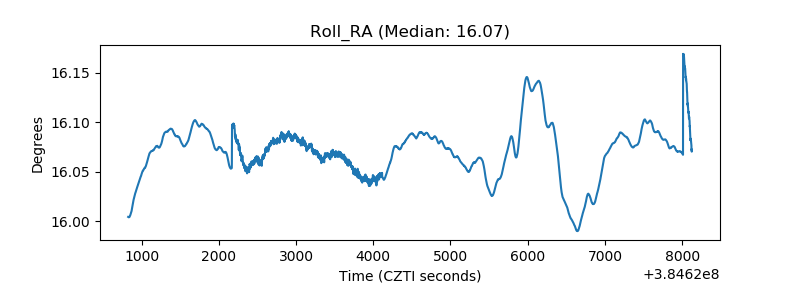 |
| Veto Counter | 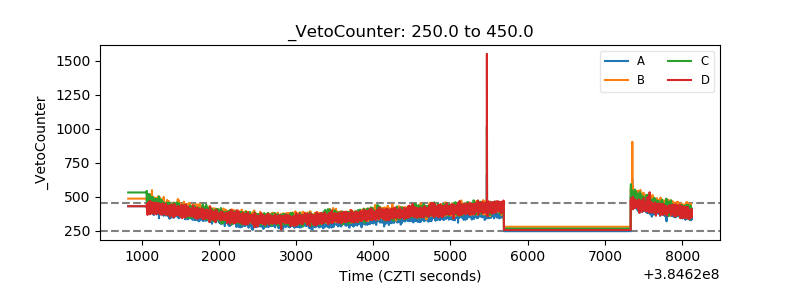 |