| Param | Original file | Final file |
|---|---|---|
| Filename | modeM0/AS1C07_005T01_9000004992_34861cztM0_level2.evt | modeM0/AS1C07_005T01_9000004992_34861cztM0_level2_quad_clean.evt |
| Size (bytes) | 1,192,426,560 | 74,352,960 |
| Size | 1.1 GB | 70.9 MB |
| Events in quadrant A | 13,114,575 | 368,012 |
| Events in quadrant B | 14,931,670 | 225,866 |
| Events in quadrant C | 3,339,331 | 642,484 |
| Events in quadrant D | 4,342,150 | 608,168 |
| Mode M9 | |||
|---|---|---|---|
| Quadrant | BADHDUFLAG | Total packets | Discarded packets |
| A | 0 | 14 | 0 |
| B | 0 | 14 | 0 |
| C | 0 | 14 | 0 |
| D | 0 | 14 | 0 |
| Mode M0 | |||
|---|---|---|---|
| Quadrant | BADHDUFLAG | Total packets | Discarded packets |
| A | 0 | 42862 | 3 |
| B | 0 | 48207 | 2 |
| C | 0 | 13282 | 2 |
| D | 0 | 16851 | 2 |
| Mode SS | |||
|---|---|---|---|
| Quadrant | BADHDUFLAG | Total packets | Discarded packets |
| A | 0 | 118 | 0 |
| B | 0 | 118 | 0 |
| C | 0 | 118 | 0 |
| D | 0 | 118 | 0 |
| Quadrant | Total seconds | Saturated seconds | Saturation percentage |
|---|---|---|---|
| A | 5749 | 4999 | 86.954253% |
| B | 5749 | 5734 | 99.739085% |
| C | 5749 | 113 | 1.965559% |
| D | 5750 | 176 | 3.060870% |
Noise dominated data is calculated using 1-second bins in cleaned event files. If a bin has >2000 counts, and if more than 50% of those come from <1% of pixels, then it is considered to be noise-dominated and hence unusable.
| Quadrant | # 1 sec bins | Bins with >0 counts | Bins with >2000 counts | High rate bins dominated by noise | Noise dominated (total time) | Noise dominated (detector-on time) | Marked lightcurve |
|---|---|---|---|---|---|---|---|
| A | 7121 | 5749 | 4625 | 4625 | 64.95% | 80.45% | 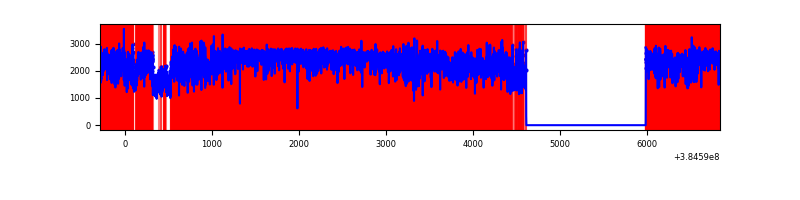 |
| B | 7121 | 5748 | 5612 | 5612 | 78.81% | 97.63% | 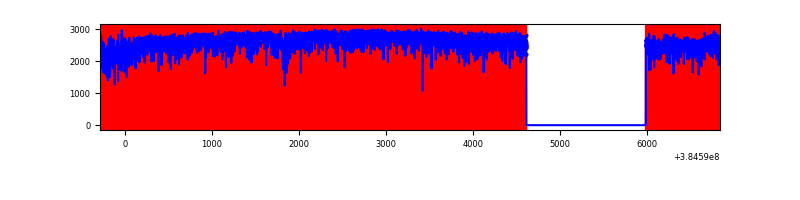 |
| C | 7122 | 5750 | 94 | 94 | 1.32% | 1.63% | 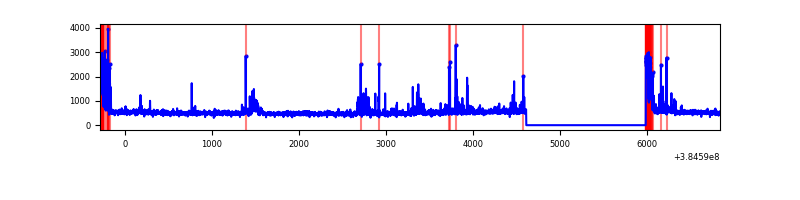 |
| D | 7123 | 5751 | 152 | 152 | 2.13% | 2.64% | 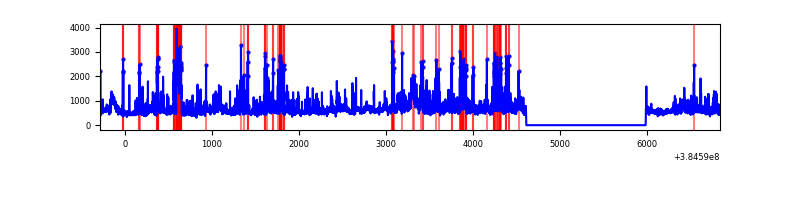 |
Top three noisy pixels from each quadrant. If the there are fewer than three noisy pixels in the level2.evt file, extra rows are filled as -1
| Pixel properties | Quadrant properties | ||||||
|---|---|---|---|---|---|---|---|
| Quadrant | DetID | PixID | Counts | Sigma | Mean | Median | Sigma |
| A | 15 | 169 | 11313087 | 128491.33 | 434 | 425 | 88.0 |
| A | 15 | 237 | 67001 | 756.18 | 434 | 425 | 88.0 |
| A | 10 | 83 | 38091 | 427.82 | 434 | 425 | 88.0 |
| B | 5 | 31 | 5498224 | 111141.71 | 255 | 248 | 49.5 |
| B | 5 | 15 | 5306126 | 107258.44 | 255 | 248 | 49.5 |
| B | 5 | 14 | 2735014 | 55283.36 | 255 | 248 | 49.5 |
| C | 0 | 10 | 276891 | 1864.91 | 637 | 639 | 148.1 |
| C | 15 | 214 | 264274 | 1779.74 | 637 | 639 | 148.1 |
| C | 0 | 207 | 264251 | 1779.58 | 637 | 639 | 148.1 |
| D | 8 | 195 | 450648 | 2843.13 | 636 | 620 | 158.3 |
| D | 12 | 6 | 312228 | 1968.64 | 636 | 620 | 158.3 |
| D | 1 | 52 | 273583 | 1724.49 | 636 | 620 | 158.3 |
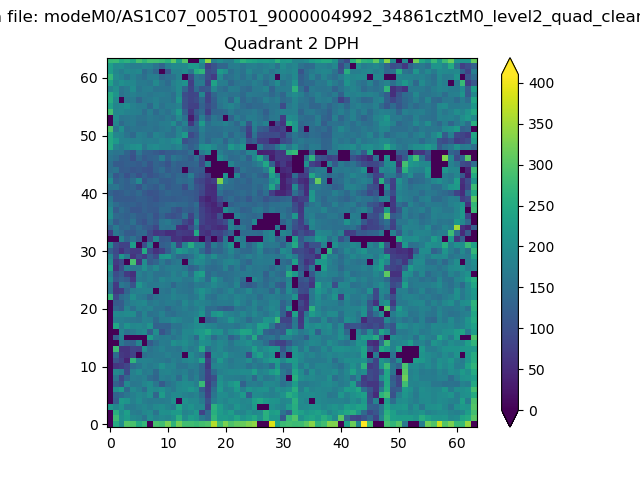
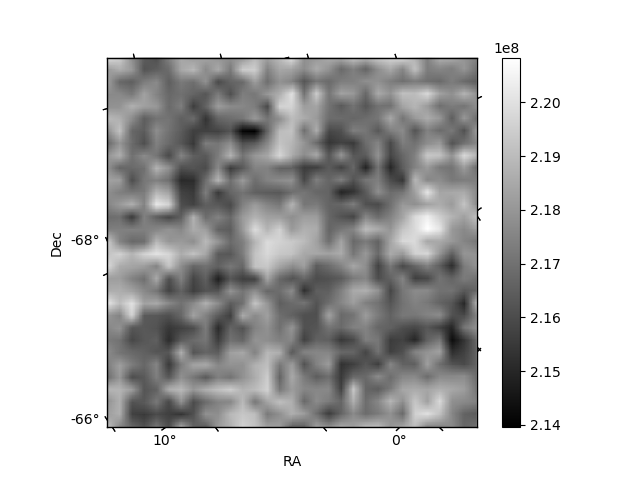
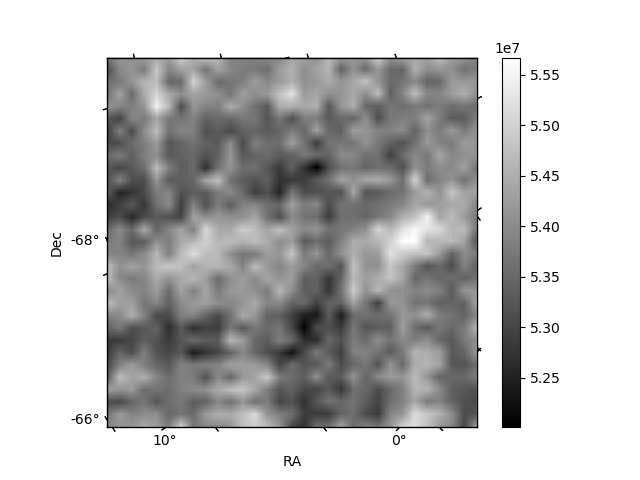
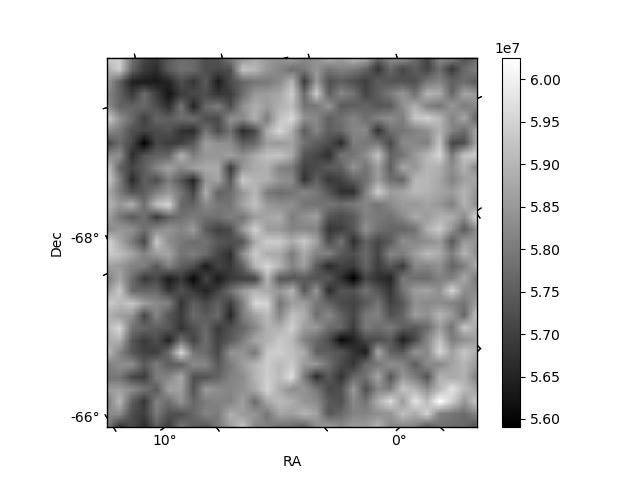
Histogram calculated using DETX and DETY for each event in the final _common_clean file
| Quadrant A | 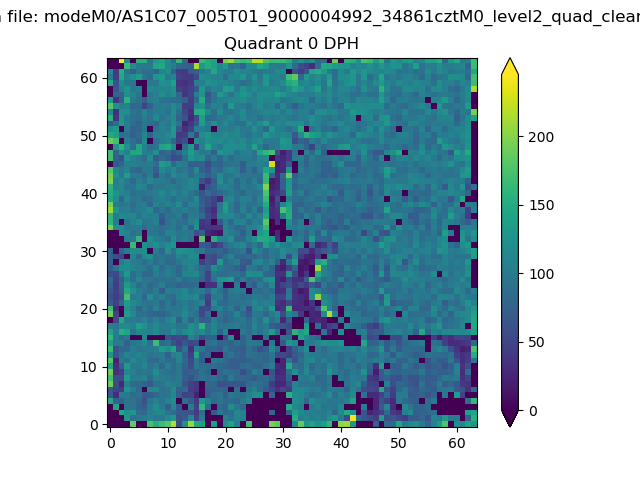 |
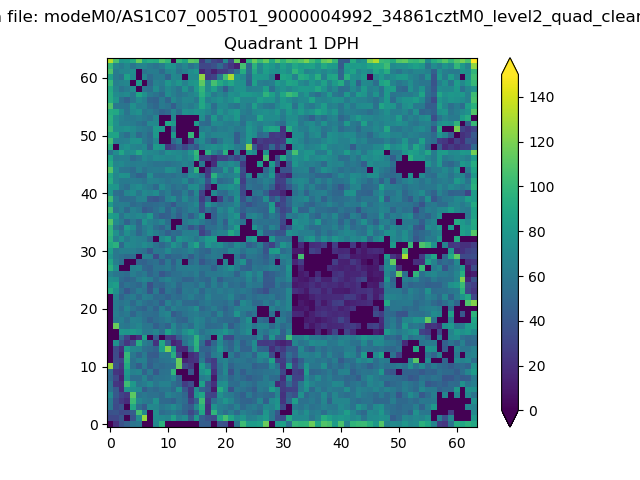 |
Quadrant B |
|---|---|---|---|
| Quadrant D | 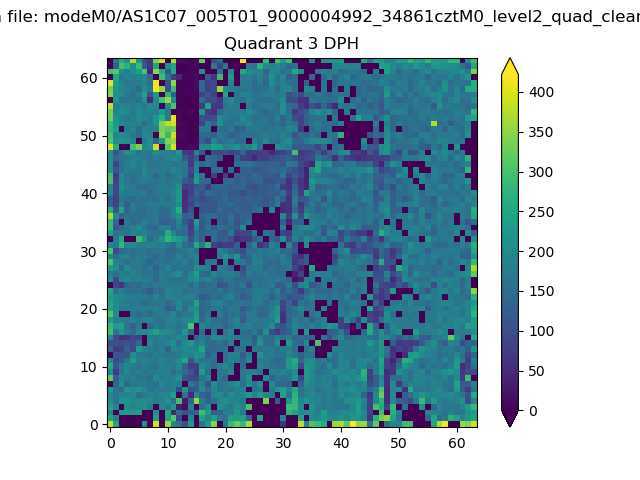 |
 |
Quadrant C |
| Plot type | Count rate plots | Images |
|---|---|---|
| Comparison with Poisson distribution Blue bars denote a histogram of data divided into 1 sec bins. Red curve is a Poisson curve with rate = median count rate of data. |
 |
 |
| Quadrant-wise count rates Data is divided into 100 sec bins |
 |
|
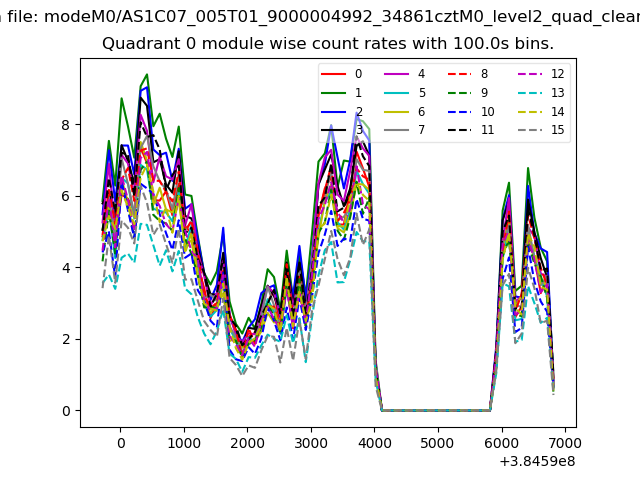
| Module-wise count rates for Quadrant A Data is divided into 100 sec bins |
 |
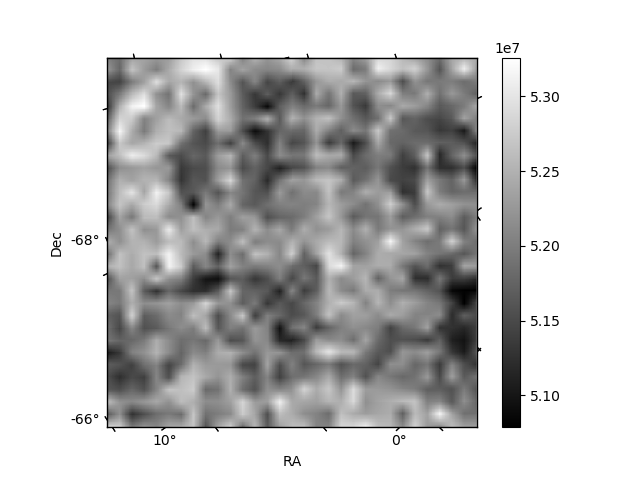 |
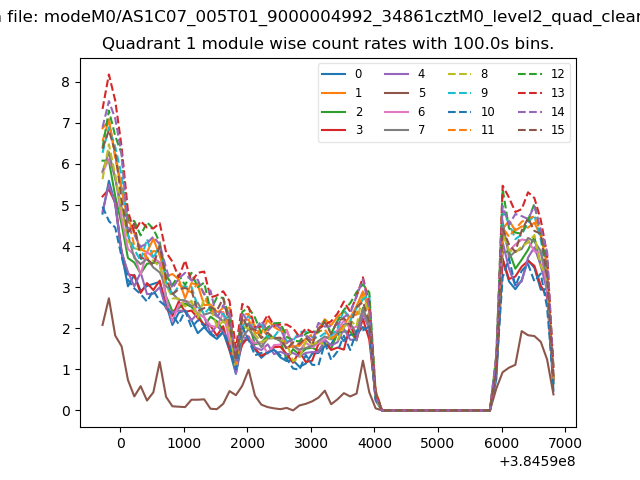
| Module-wise count rates for Quadrant B Data is divided into 100 sec bins |
 |
 |
| Module-wise count rates for Quadrant C Data is divided into 100 sec bins |
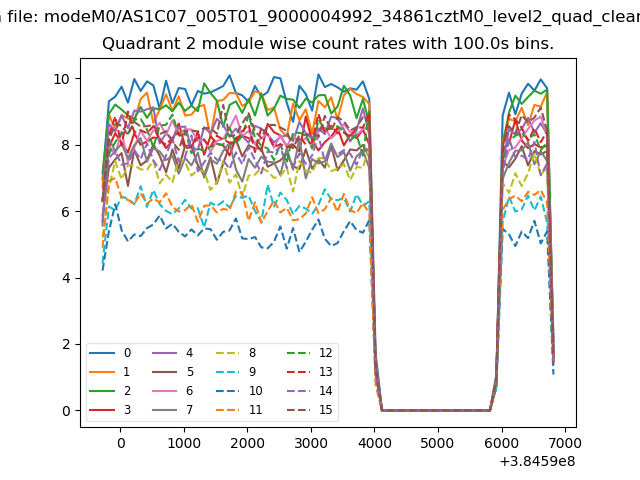 |
 |
| Module-wise count rates for Quadrant D Data is divided into 100 sec bins |
 |
 |
| Parameter | Plot |
|---|---|
| CZT HV Monitor | 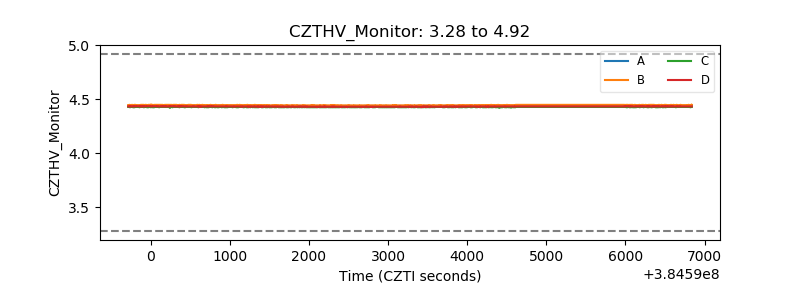 |
| D_VDD | 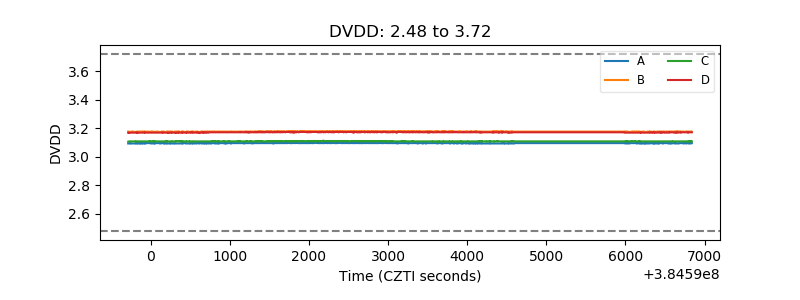 |
| Temperature 1 | 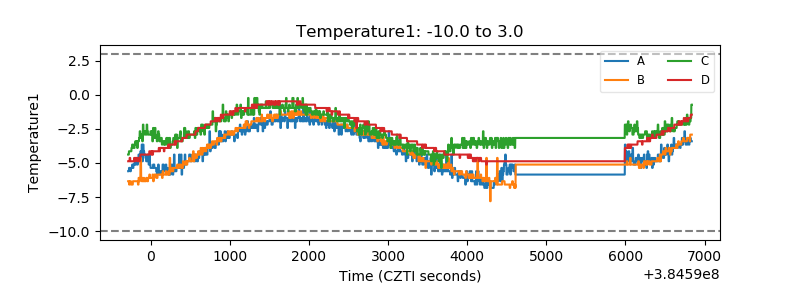 |
| Veto HV Monitor | 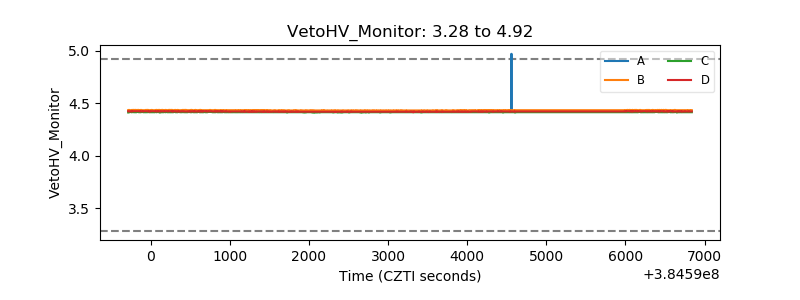 |
| Veto LLD | 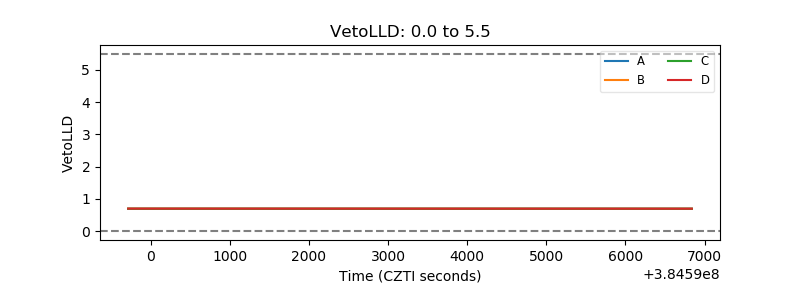 |
| Alpha Counter | 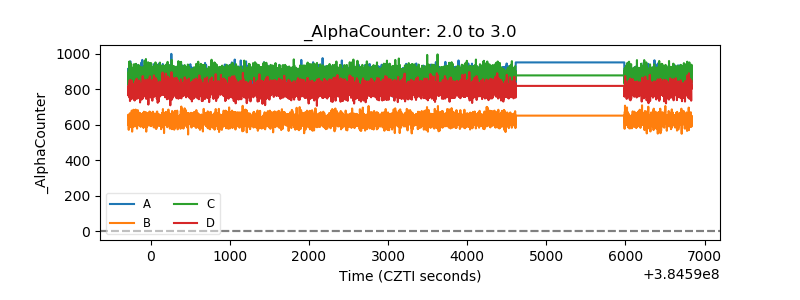 |
| _CPM_Rate | 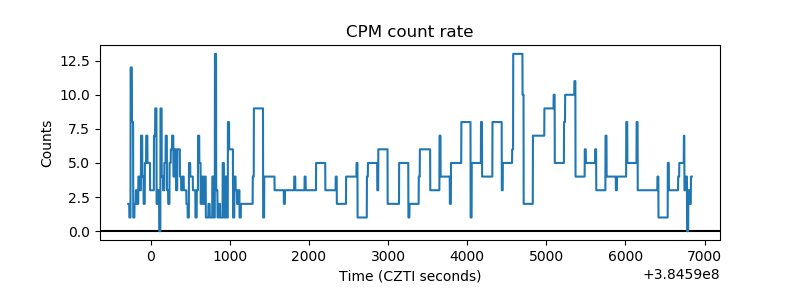 |
| CZT Counter | 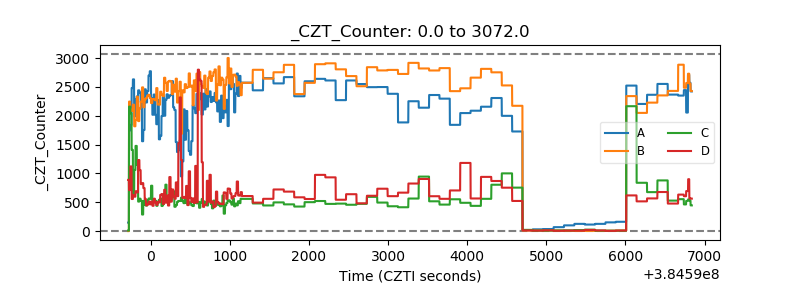 |
| +2.5 Volts monitor | 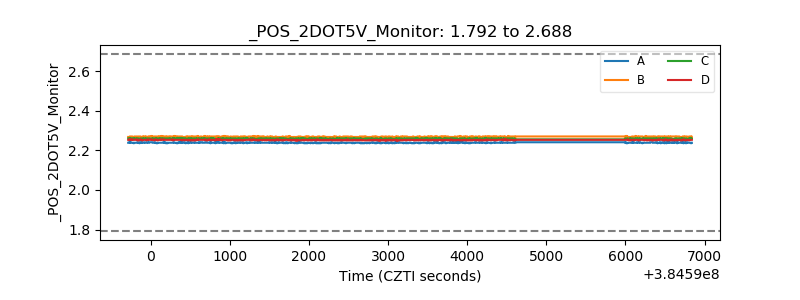 |
| +5 Volts monitor | 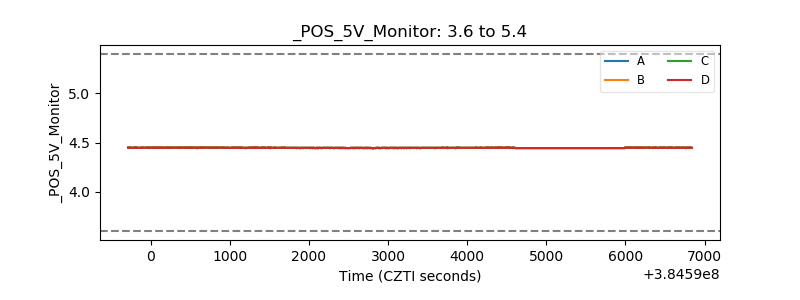 |
| _ROLL_ROT | 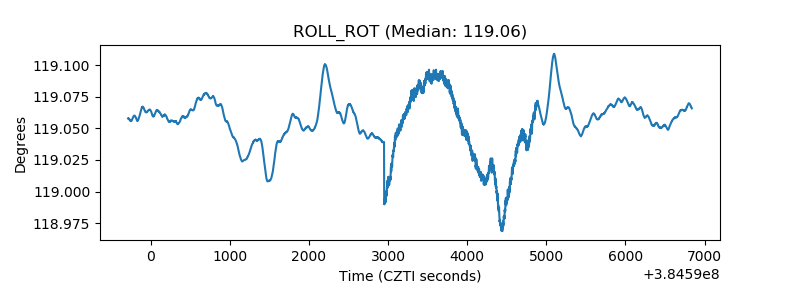 |
| _Roll_DEC | 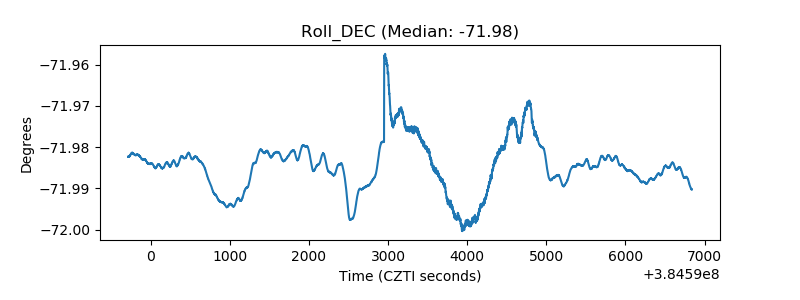 |
| _Roll_RA | 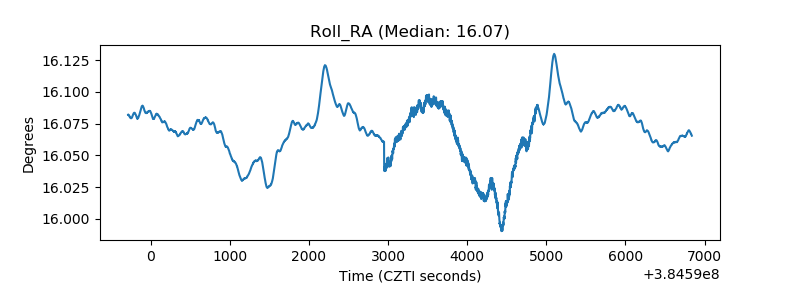 |
| Veto Counter | 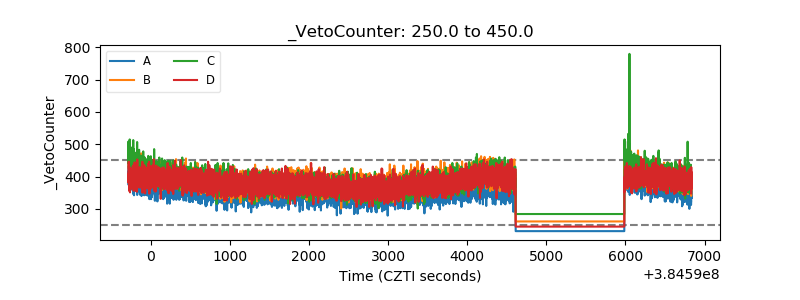 |