| Param | Original file | Final file |
|---|---|---|
| Filename | modeM0/AS1C07_005T01_9000004992_34855cztM0_level2.evt | modeM0/AS1C07_005T01_9000004992_34855cztM0_level2_quad_clean.evt |
| Size (bytes) | 954,515,520 | 77,287,680 |
| Size | 910.3 MB | 73.7 MB |
| Events in quadrant A | 11,196,155 | 396,481 |
| Events in quadrant B | 8,062,567 | 482,014 |
| Events in quadrant C | 3,817,881 | 565,388 |
| Events in quadrant D | 5,486,299 | 533,189 |
| Mode M9 | |||
|---|---|---|---|
| Quadrant | BADHDUFLAG | Total packets | Discarded packets |
| A | 0 | 29 | 0 |
| B | 0 | 29 | 0 |
| C | 0 | 29 | 0 |
| D | 0 | 30 | 0 |
| Mode M0 | |||
|---|---|---|---|
| Quadrant | BADHDUFLAG | Total packets | Discarded packets |
| A | 0 | 36717 | 3 |
| B | 0 | 27381 | 2 |
| C | 0 | 14591 | 2 |
| D | 0 | 19982 | 2 |
| Mode SS | |||
|---|---|---|---|
| Quadrant | BADHDUFLAG | Total packets | Discarded packets |
| A | 0 | 104 | 0 |
| B | 0 | 104 | 0 |
| C | 0 | 104 | 0 |
| D | 0 | 104 | 0 |
| Quadrant | Total seconds | Saturated seconds | Saturation percentage |
|---|---|---|---|
| A | 5146 | 3756 | 72.988729% |
| B | 5146 | 2482 | 48.231636% |
| C | 5146 | 307 | 5.965799% |
| D | 5146 | 486 | 9.444229% |
Noise dominated data is calculated using 1-second bins in cleaned event files. If a bin has >2000 counts, and if more than 50% of those come from <1% of pixels, then it is considered to be noise-dominated and hence unusable.
| Quadrant | # 1 sec bins | Bins with >0 counts | Bins with >2000 counts | High rate bins dominated by noise | Noise dominated (total time) | Noise dominated (detector-on time) | Marked lightcurve |
|---|---|---|---|---|---|---|---|
| A | 7118 | 5146 | 3513 | 3513 | 49.35% | 68.27% | 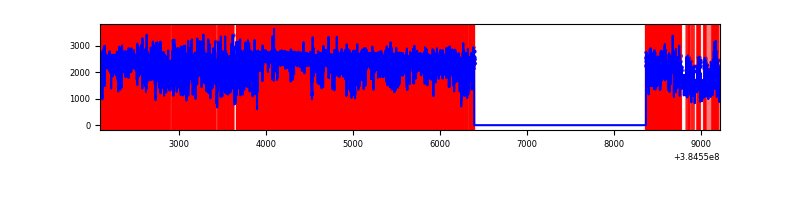 |
| B | 7118 | 5146 | 2217 | 2217 | 31.15% | 43.08% | 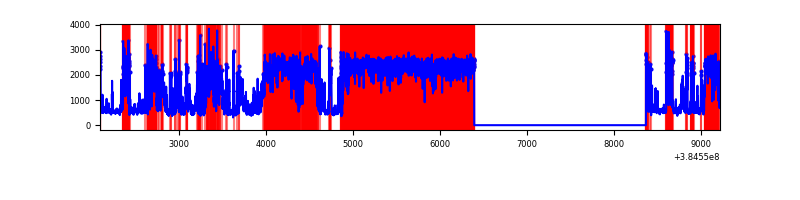 |
| C | 7118 | 5147 | 281 | 281 | 3.95% | 5.46% | 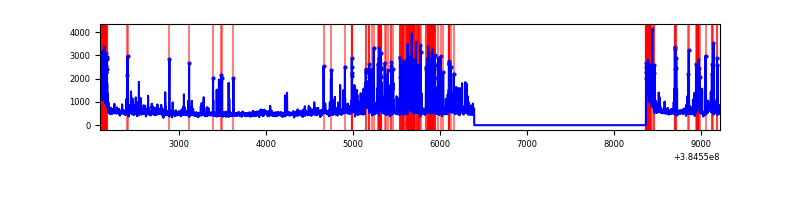 |
| D | 7118 | 5147 | 532 | 532 | 7.47% | 10.34% | 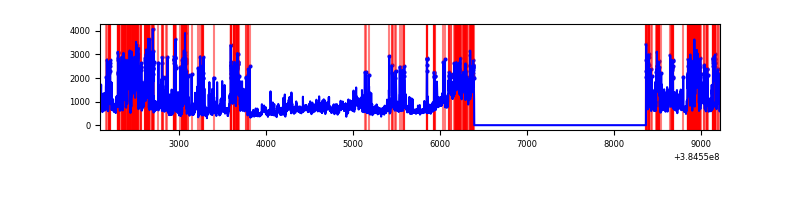 |
Top three noisy pixels from each quadrant. If the there are fewer than three noisy pixels in the level2.evt file, extra rows are filled as -1
| Pixel properties | Quadrant properties | ||||||
|---|---|---|---|---|---|---|---|
| Quadrant | DetID | PixID | Counts | Sigma | Mean | Median | Sigma |
| A | 15 | 169 | 9288235 | 98499.49 | 474 | 467 | 94.3 |
| A | 10 | 83 | 38264 | 400.85 | 474 | 467 | 94.3 |
| A | 15 | 237 | 20602 | 213.54 | 474 | 467 | 94.3 |
| B | 5 | 31 | 1673021 | 17173.06 | 523 | 512 | 97.4 |
| B | 5 | 15 | 1669535 | 17137.26 | 523 | 512 | 97.4 |
| B | 5 | 14 | 1667575 | 17117.14 | 523 | 512 | 97.4 |
| C | 0 | 207 | 973275 | 7161.59 | 593 | 597 | 135.8 |
| C | 0 | 10 | 240265 | 1764.62 | 593 | 597 | 135.8 |
| C | 15 | 214 | 229881 | 1688.16 | 593 | 597 | 135.8 |
| D | 1 | 52 | 1294275 | 8233.7 | 582 | 570 | 157.1 |
| D | 12 | 227 | 998691 | 6352.48 | 582 | 570 | 157.1 |
| D | 8 | 195 | 393687 | 2501.97 | 582 | 570 | 157.1 |
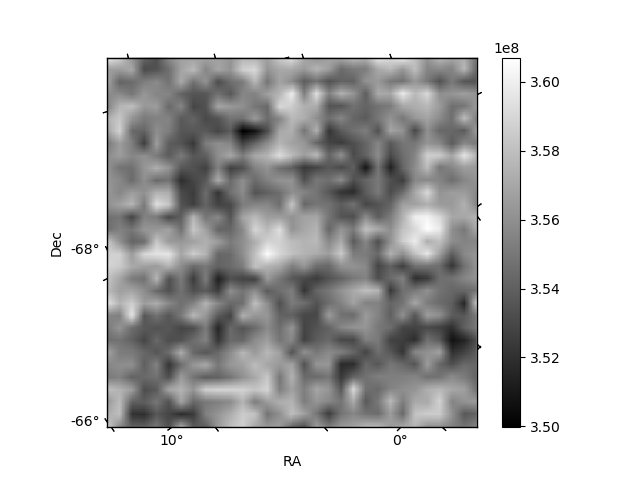
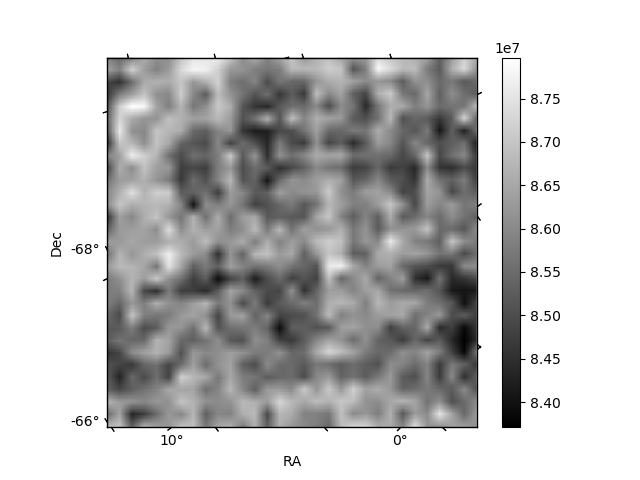
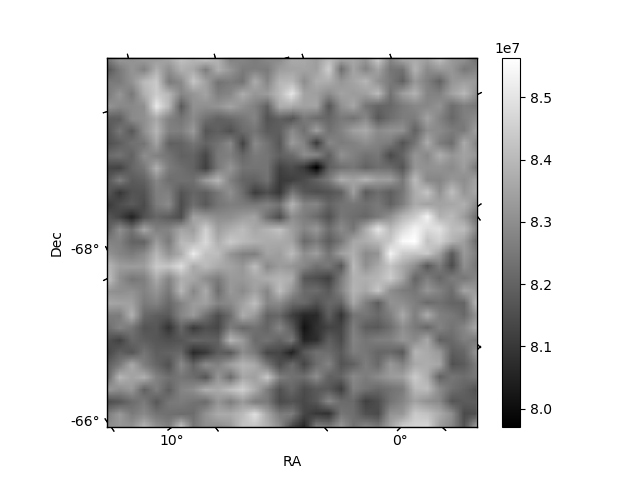
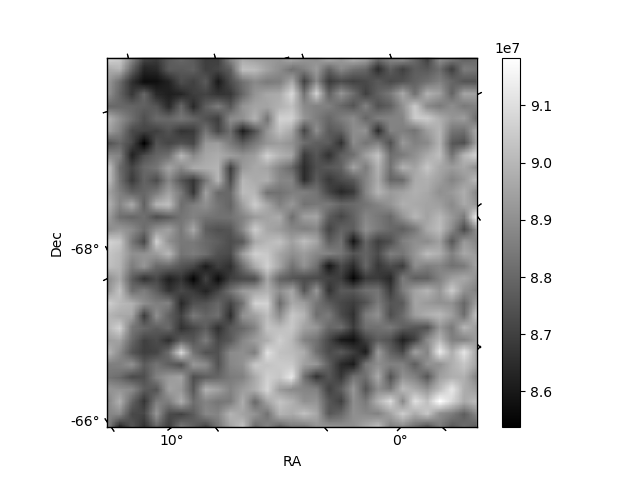
Histogram calculated using DETX and DETY for each event in the final _common_clean file
| Quadrant A | 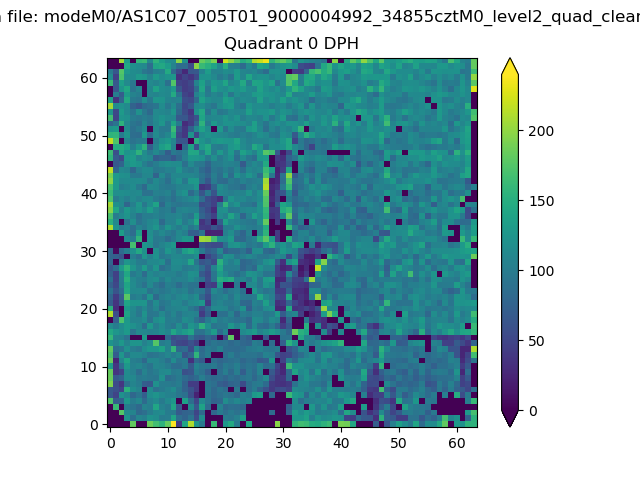 |
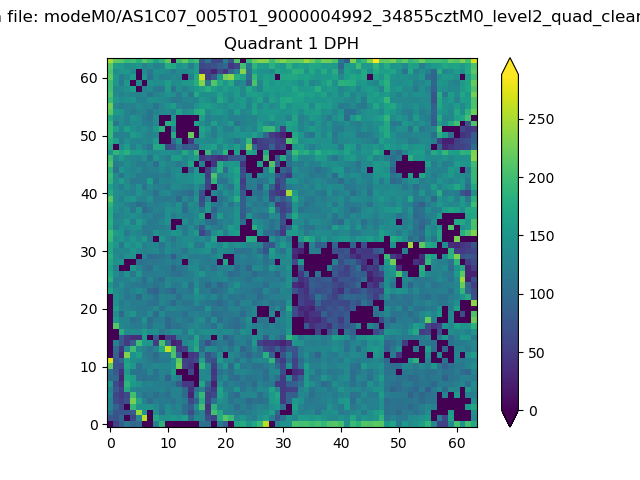 |
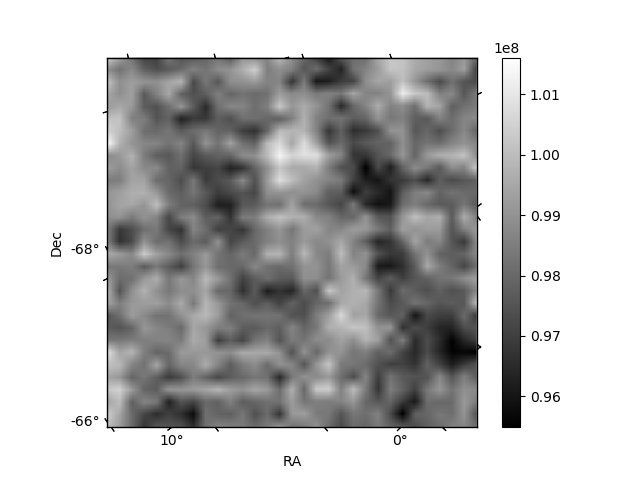
Quadrant B |
|---|---|---|---|
| Quadrant D | 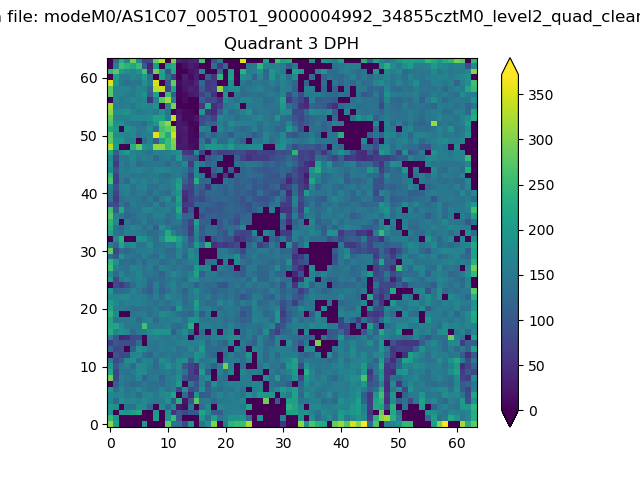 |
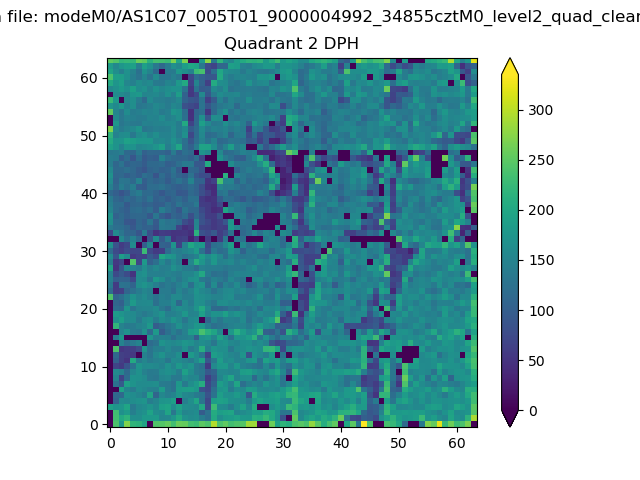 |
Quadrant C |
| Plot type | Count rate plots | Images |
|---|---|---|
| Comparison with Poisson distribution Blue bars denote a histogram of data divided into 1 sec bins. Red curve is a Poisson curve with rate = median count rate of data. |
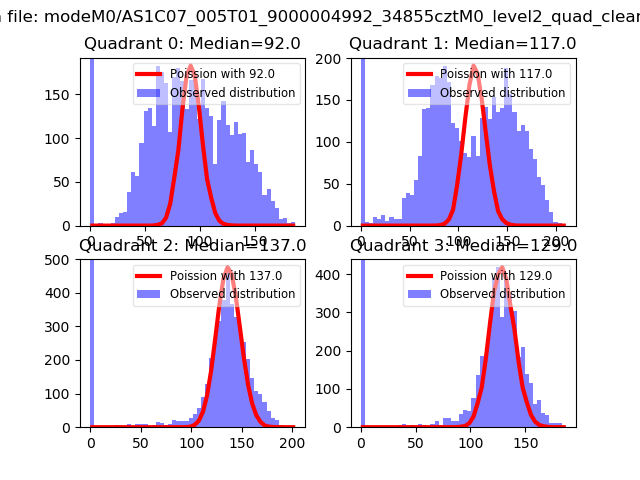 |
 |
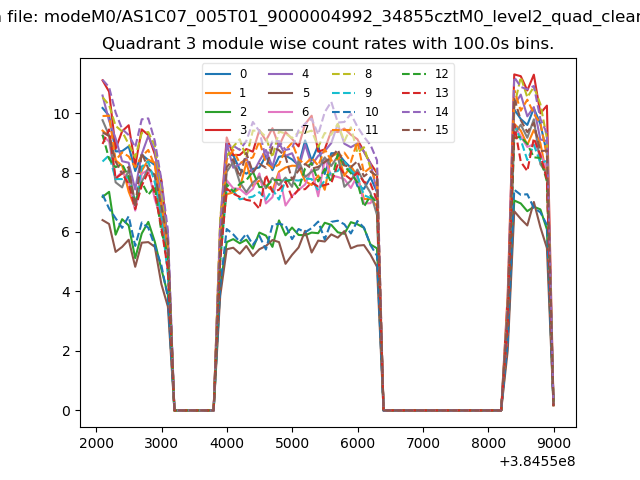
| Quadrant-wise count rates Data is divided into 100 sec bins |
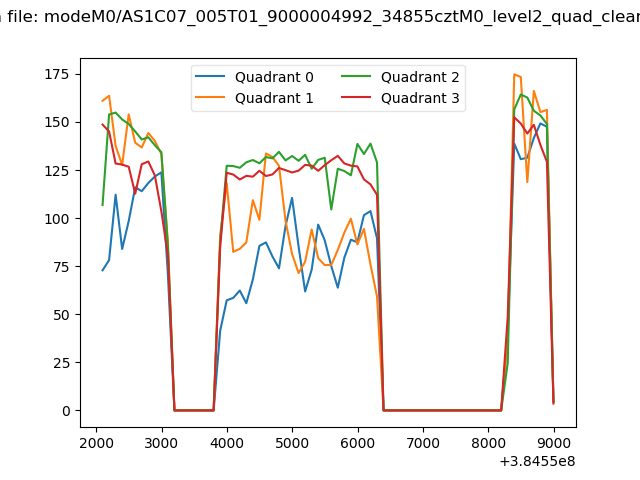 |
|
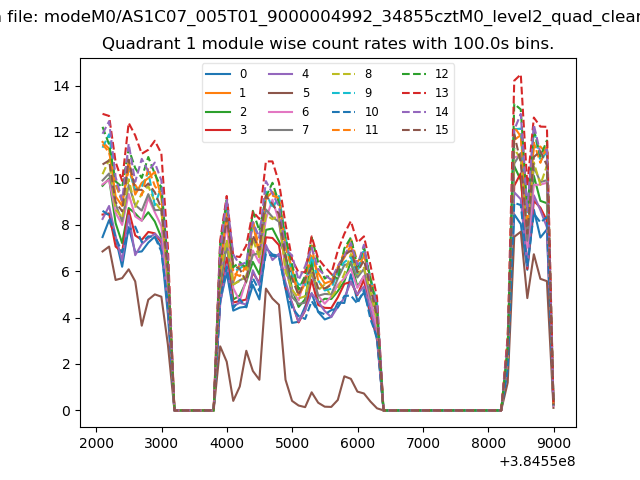
| Module-wise count rates for Quadrant A Data is divided into 100 sec bins |
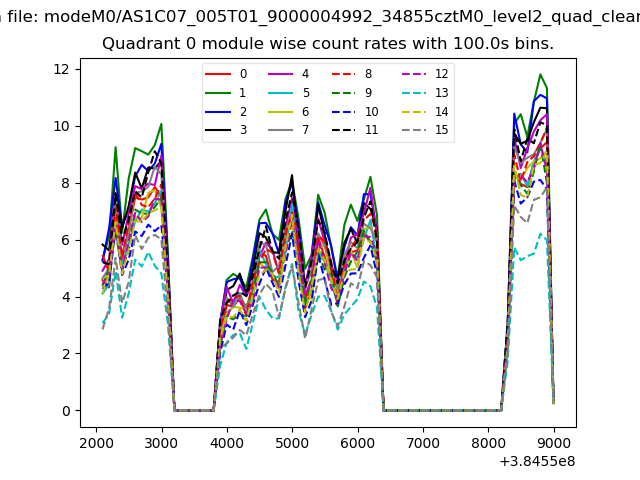 |
 |
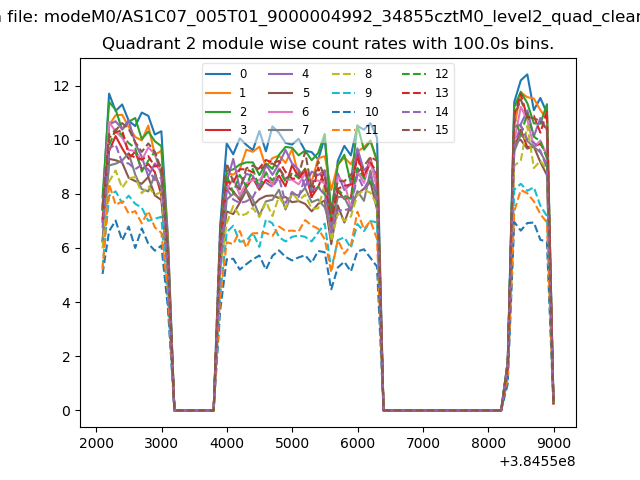
| Module-wise count rates for Quadrant B Data is divided into 100 sec bins |
 |
 |
| Module-wise count rates for Quadrant C Data is divided into 100 sec bins |
 |
 |
| Module-wise count rates for Quadrant D Data is divided into 100 sec bins |
 |
 |
| Parameter | Plot |
|---|---|
| CZT HV Monitor | 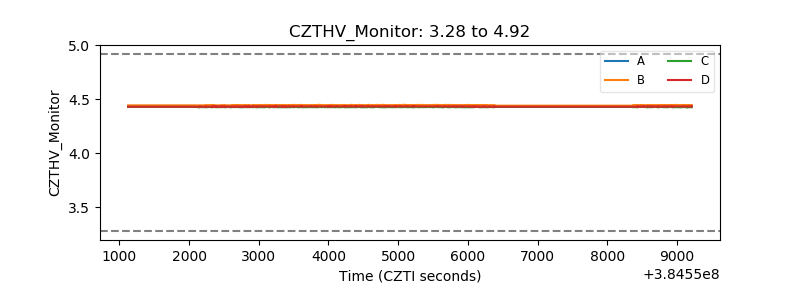 |
| D_VDD | 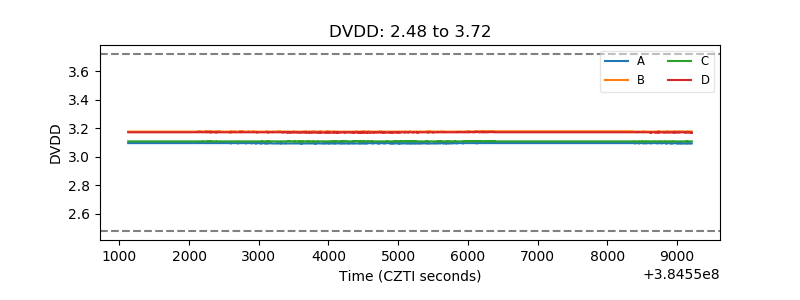 |
| Temperature 1 | 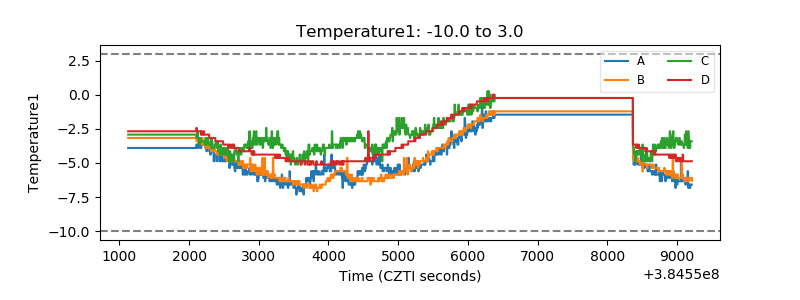 |
| Veto HV Monitor | 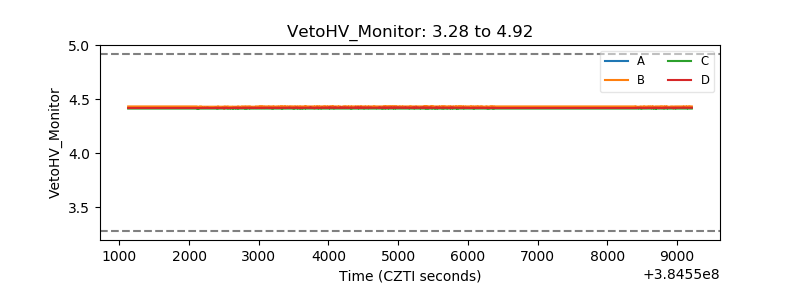 |
| Veto LLD | 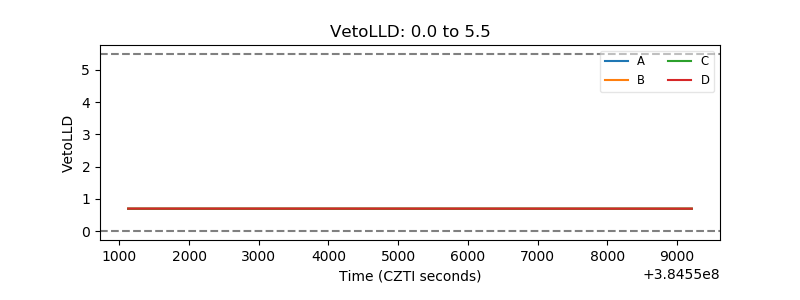 |
| Alpha Counter | 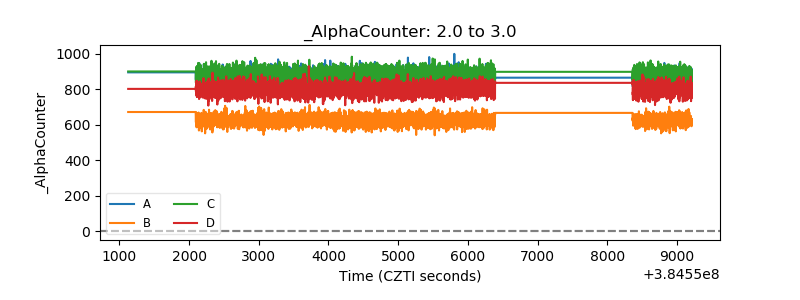 |
| _CPM_Rate | 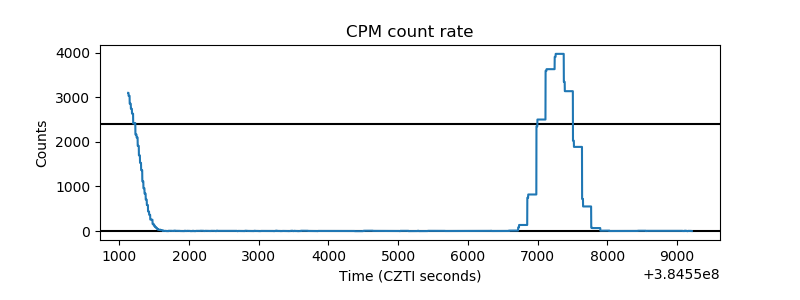 |
| CZT Counter | 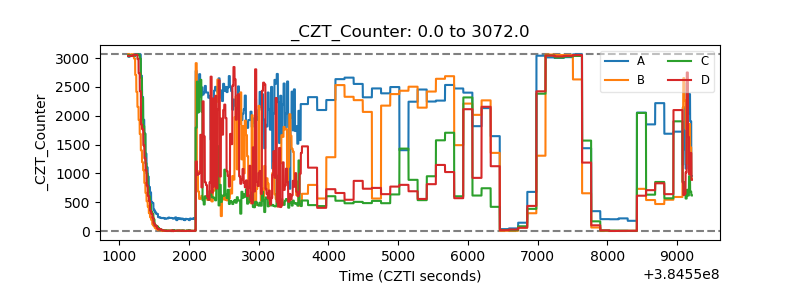 |
| +2.5 Volts monitor | 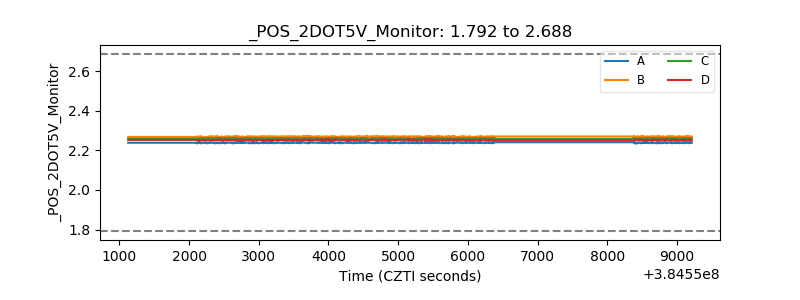 |
| +5 Volts monitor | 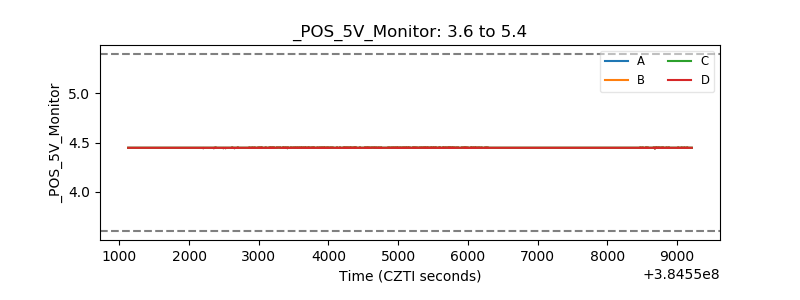 |
| _ROLL_ROT | 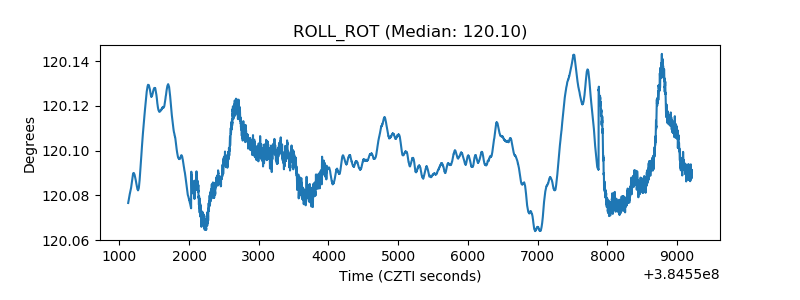 |
| _Roll_DEC | 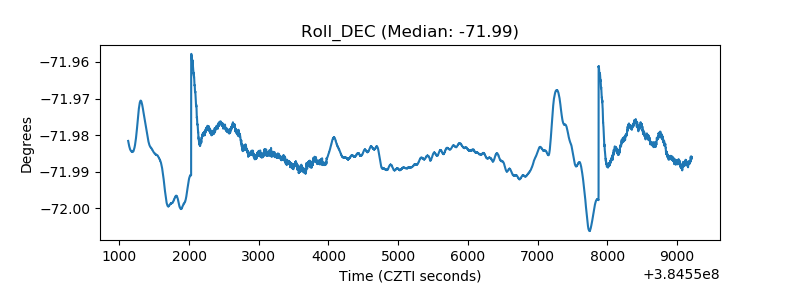 |
| _Roll_RA | 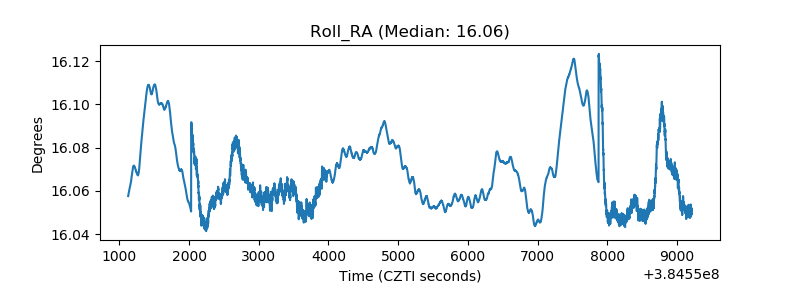 |
| Veto Counter | 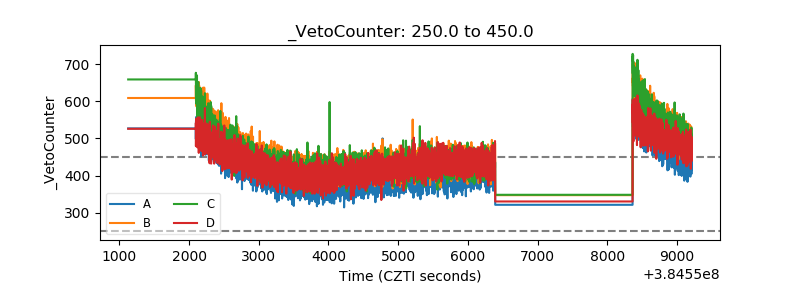 |