| Param | Original file | Final file |
|---|---|---|
| Filename | modeM0/AS1C07_005T01_9000004992_34854cztM0_level2.evt | modeM0/AS1C07_005T01_9000004992_34854cztM0_level2_quad_clean.evt |
| Size (bytes) | 726,837,120 | 82,912,320 |
| Size | 693.2 MB | 79.1 MB |
| Events in quadrant A | 8,904,773 | 443,431 |
| Events in quadrant B | 4,363,078 | 592,242 |
| Events in quadrant C | 3,148,377 | 580,610 |
| Events in quadrant D | 5,246,194 | 529,316 |
| Mode M9 | |||
|---|---|---|---|
| Quadrant | BADHDUFLAG | Total packets | Discarded packets |
| A | 0 | 18 | 0 |
| B | 0 | 18 | 0 |
| C | 0 | 18 | 0 |
| D | 0 | 19 | 0 |
| Mode M0 | |||
|---|---|---|---|
| Quadrant | BADHDUFLAG | Total packets | Discarded packets |
| A | 0 | 30038 | 3 |
| B | 0 | 16344 | 2 |
| C | 0 | 12563 | 2 |
| D | 0 | 19311 | 2 |
| Mode SS | |||
|---|---|---|---|
| Quadrant | BADHDUFLAG | Total packets | Discarded packets |
| A | 0 | 106 | 0 |
| B | 0 | 106 | 0 |
| C | 0 | 106 | 0 |
| D | 0 | 106 | 0 |
| Quadrant | Total seconds | Saturated seconds | Saturation percentage |
|---|---|---|---|
| A | 5192 | 2309 | 44.472265% |
| B | 5192 | 509 | 9.803544% |
| C | 5192 | 123 | 2.369029% |
| D | 5192 | 598 | 11.517720% |
Noise dominated data is calculated using 1-second bins in cleaned event files. If a bin has >2000 counts, and if more than 50% of those come from <1% of pixels, then it is considered to be noise-dominated and hence unusable.
| Quadrant | # 1 sec bins | Bins with >0 counts | Bins with >2000 counts | High rate bins dominated by noise | Noise dominated (total time) | Noise dominated (detector-on time) | Marked lightcurve |
|---|---|---|---|---|---|---|---|
| A | 7045 | 5193 | 2035 | 2035 | 28.89% | 39.19% | 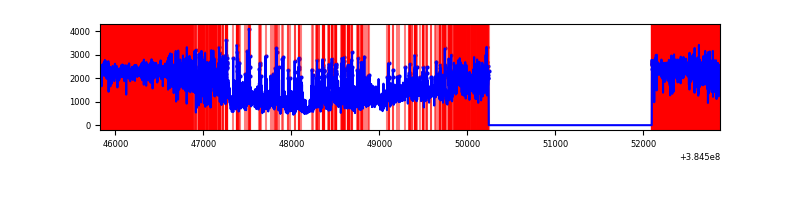 |
| B | 7045 | 5193 | 422 | 422 | 5.99% | 8.13% | 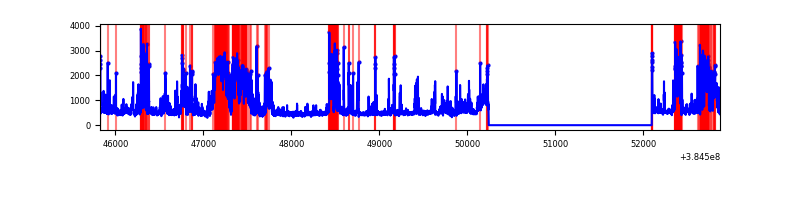 |
| C | 7045 | 5193 | 111 | 111 | 1.58% | 2.14% | 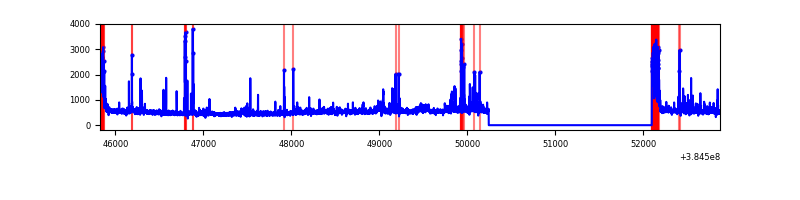 |
| D | 7045 | 5193 | 618 | 618 | 8.77% | 11.90% | 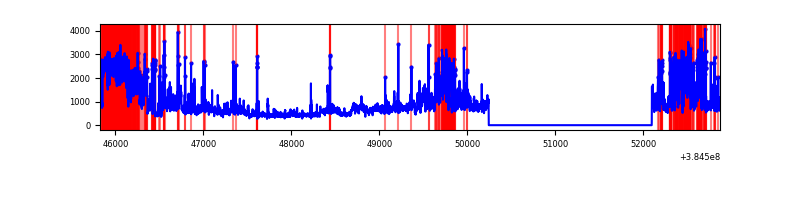 |
Top three noisy pixels from each quadrant. If the there are fewer than three noisy pixels in the level2.evt file, extra rows are filled as -1
| Pixel properties | Quadrant properties | ||||||
|---|---|---|---|---|---|---|---|
| Quadrant | DetID | PixID | Counts | Sigma | Mean | Median | Sigma |
| A | 15 | 169 | 6909623 | 69776.14 | 496 | 487 | 99.0 |
| A | 10 | 83 | 30098 | 299.04 | 496 | 487 | 99.0 |
| A | 15 | 237 | 27294 | 270.73 | 496 | 487 | 99.0 |
| B | 5 | 172 | 527415 | 4745.5 | 594 | 581 | 111.0 |
| B | 5 | 31 | 350064 | 3148.0 | 594 | 581 | 111.0 |
| B | 5 | 15 | 349367 | 3141.72 | 594 | 581 | 111.0 |
| C | 0 | 207 | 317410 | 2354.97 | 582 | 585 | 134.5 |
| C | 15 | 214 | 235510 | 1746.2 | 582 | 585 | 134.5 |
| C | 0 | 10 | 226921 | 1682.36 | 582 | 585 | 134.5 |
| D | 12 | 227 | 1520678 | 10060.21 | 560 | 549 | 151.1 |
| D | 8 | 195 | 674642 | 4461.15 | 560 | 549 | 151.1 |
| D | 1 | 52 | 310942 | 2054.18 | 560 | 549 | 151.1 |
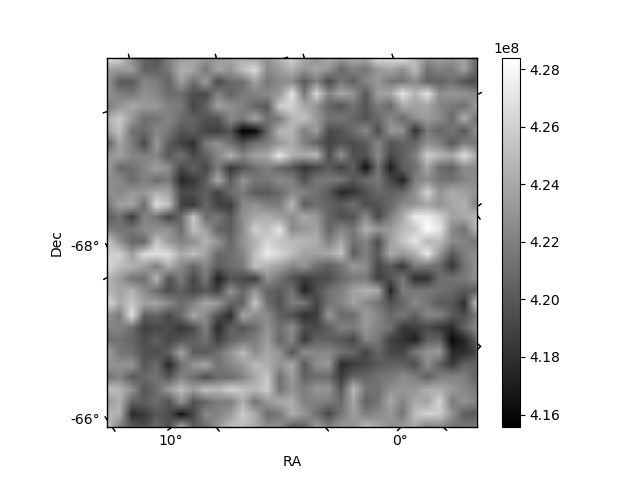
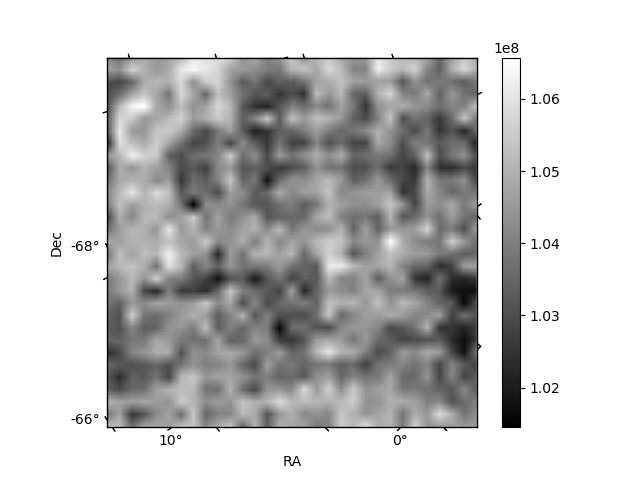
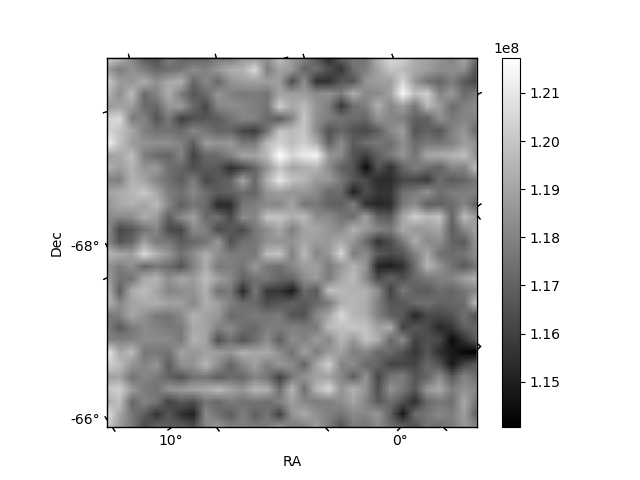
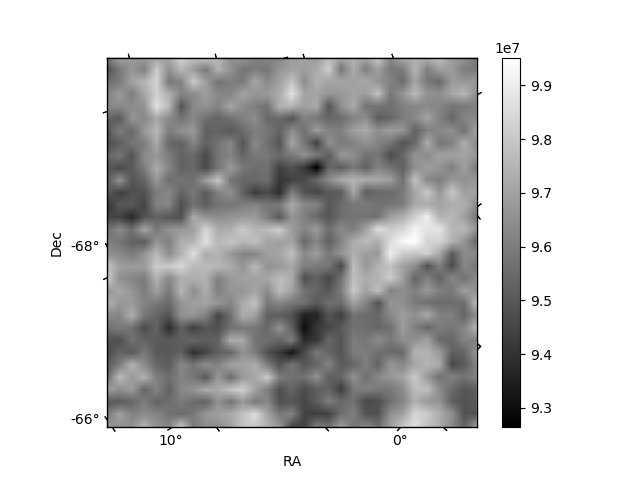
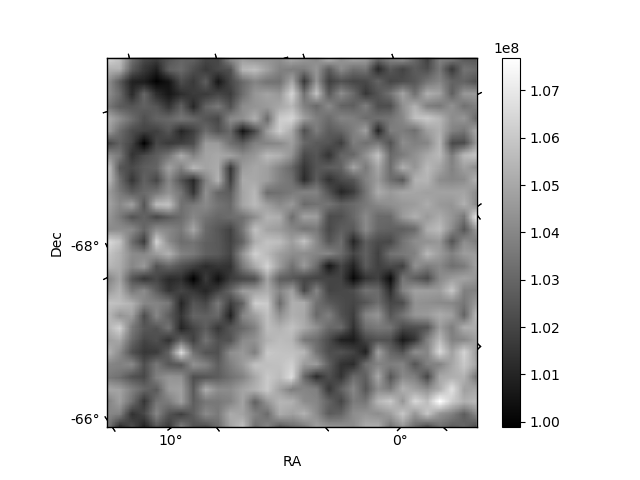
Histogram calculated using DETX and DETY for each event in the final _common_clean file
| Quadrant A | 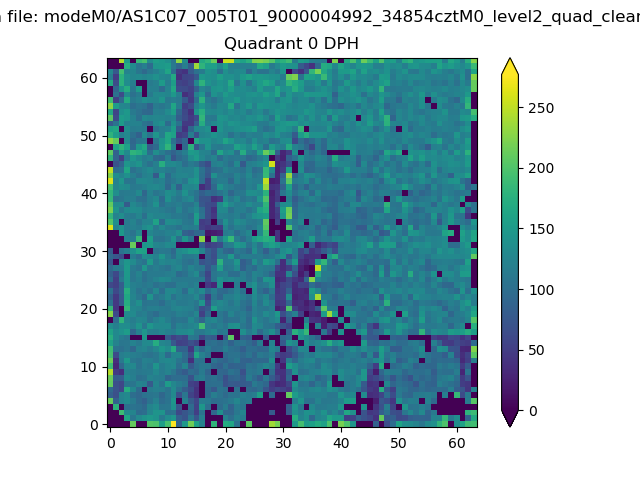 |
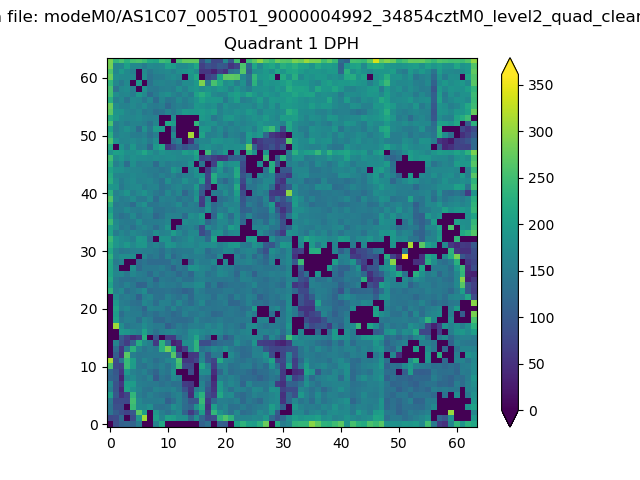 |
Quadrant B |
|---|---|---|---|
| Quadrant D | 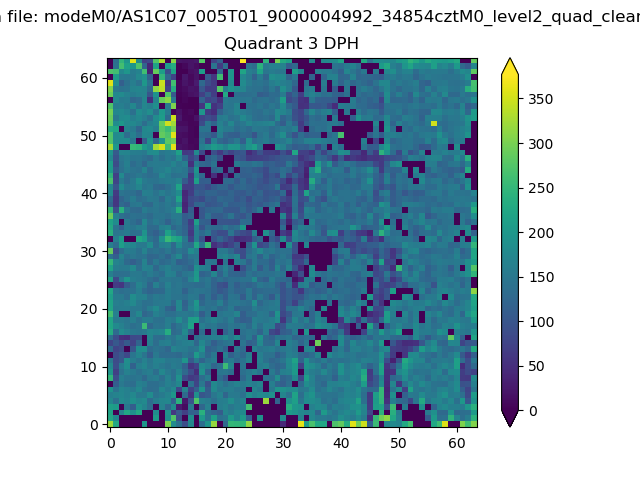 |
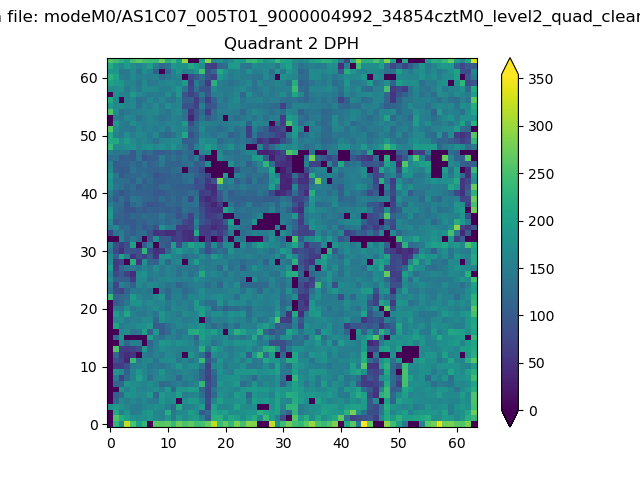 |
Quadrant C |
| Plot type | Count rate plots | Images |
|---|---|---|
| Comparison with Poisson distribution Blue bars denote a histogram of data divided into 1 sec bins. Red curve is a Poisson curve with rate = median count rate of data. |
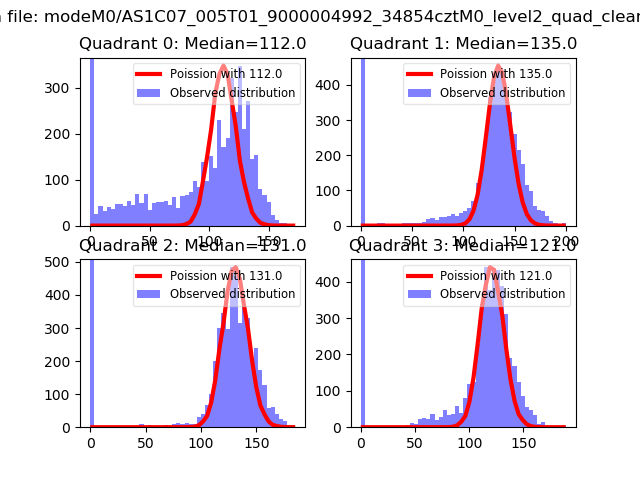 |
 |
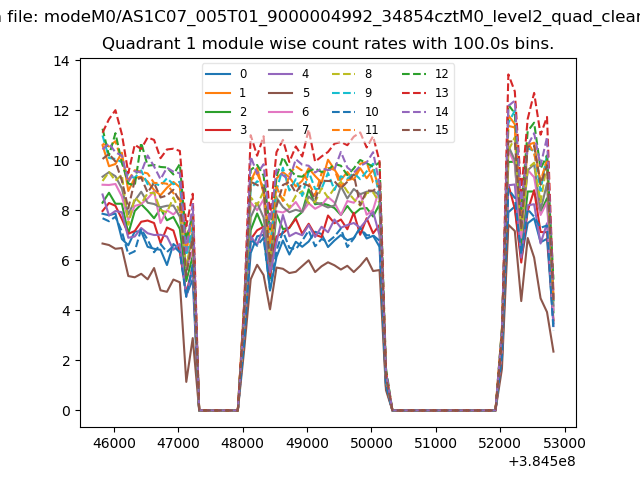
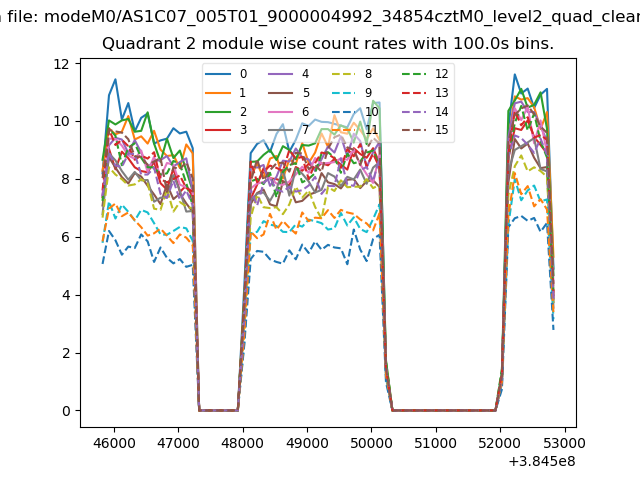
| Quadrant-wise count rates Data is divided into 100 sec bins |
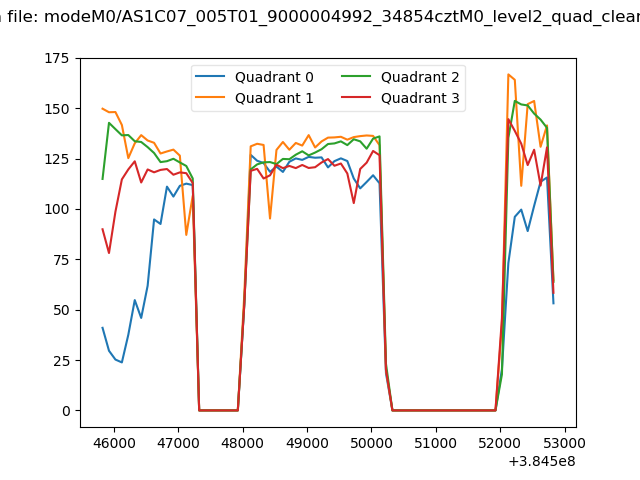 |
|
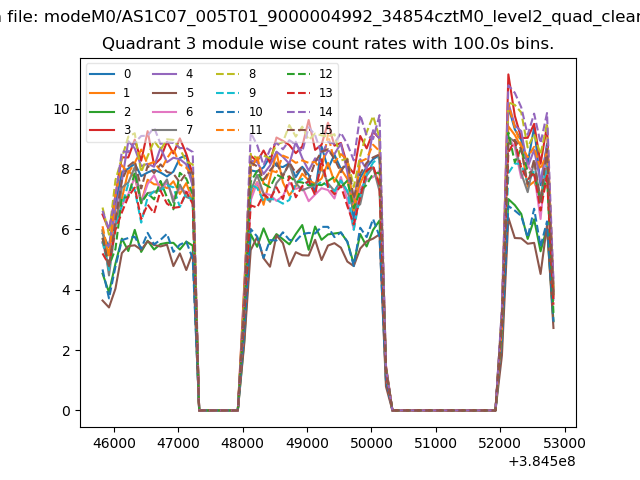
| Module-wise count rates for Quadrant A Data is divided into 100 sec bins |
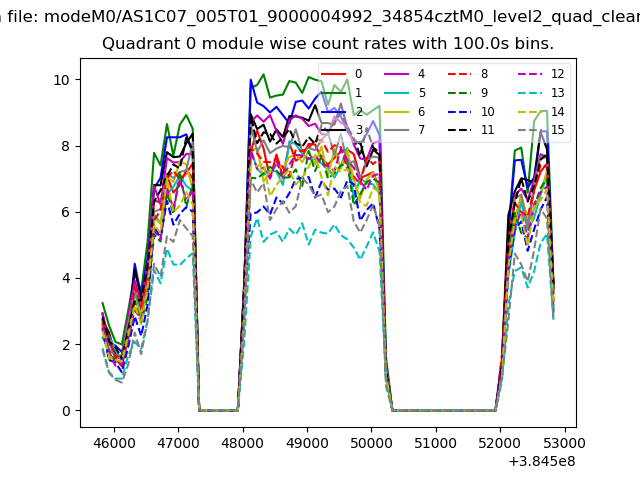 |
 |
| Module-wise count rates for Quadrant B Data is divided into 100 sec bins |
 |
 |
| Module-wise count rates for Quadrant C Data is divided into 100 sec bins |
 |
 |
| Module-wise count rates for Quadrant D Data is divided into 100 sec bins |
 |
 |
| Parameter | Plot |
|---|---|
| CZT HV Monitor | 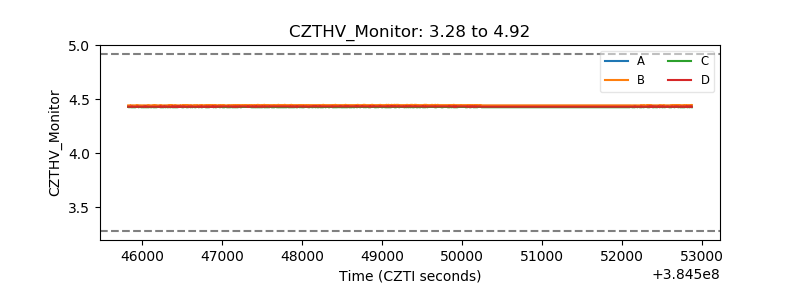 |
| D_VDD | 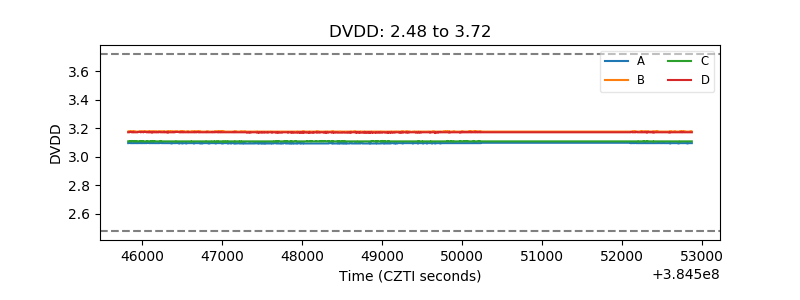 |
| Temperature 1 | 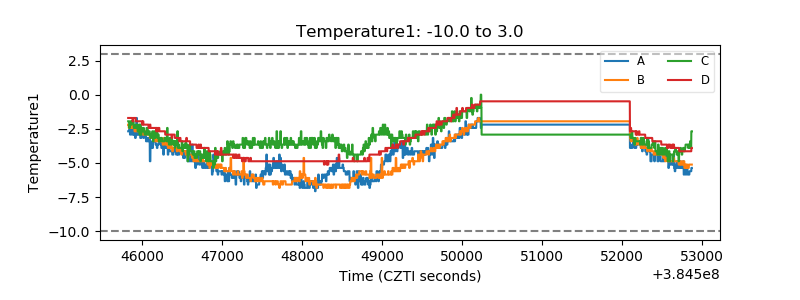 |
| Veto HV Monitor | 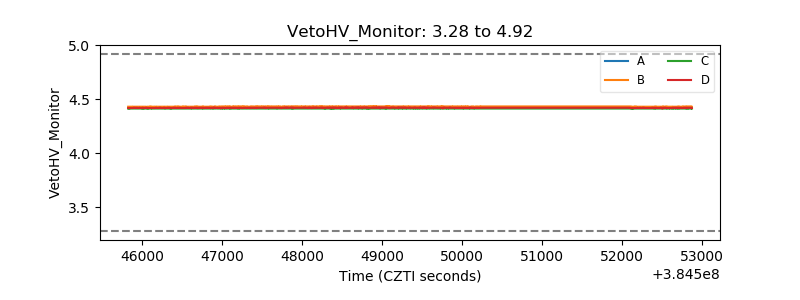 |
| Veto LLD | 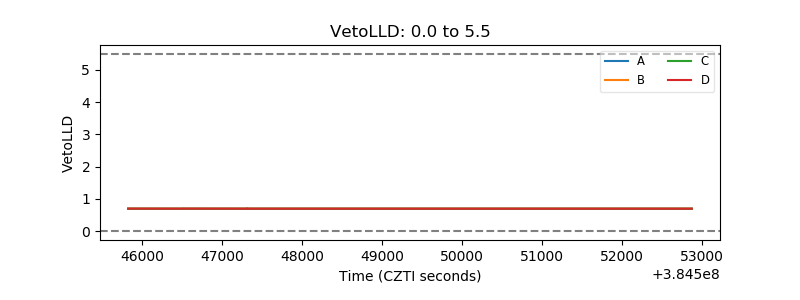 |
| Alpha Counter | 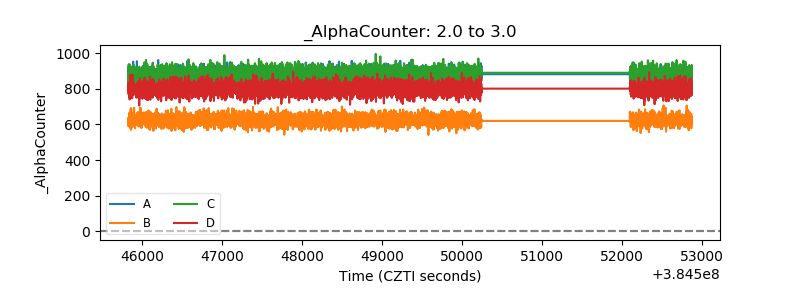 |
| _CPM_Rate | 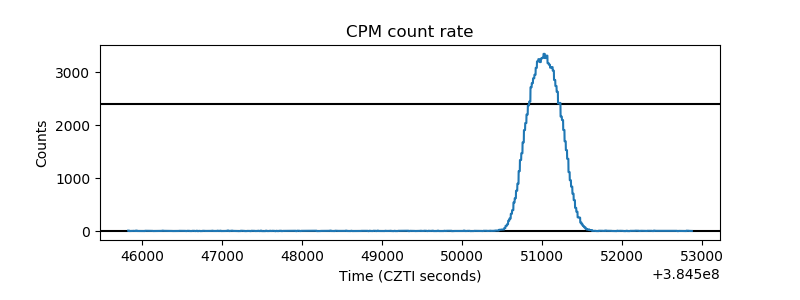 |
| CZT Counter | 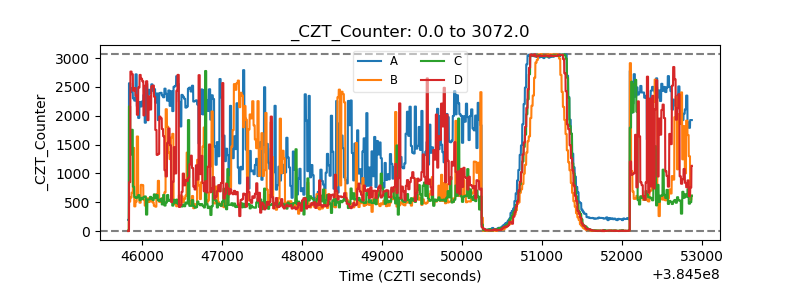 |
| +2.5 Volts monitor | 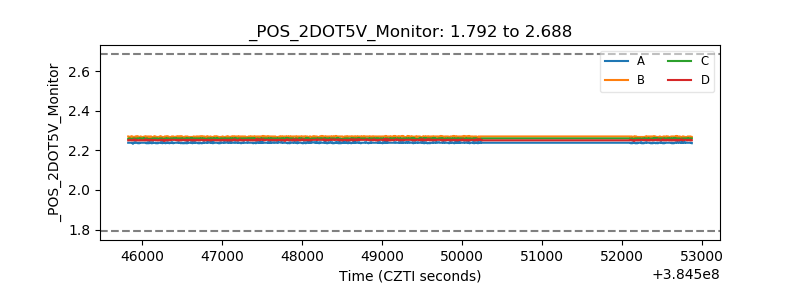 |
| +5 Volts monitor | 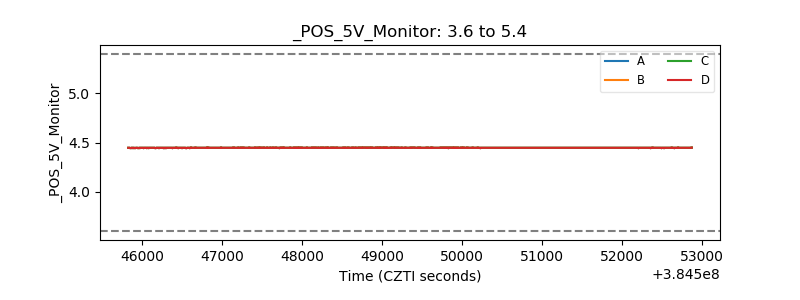 |
| _ROLL_ROT | 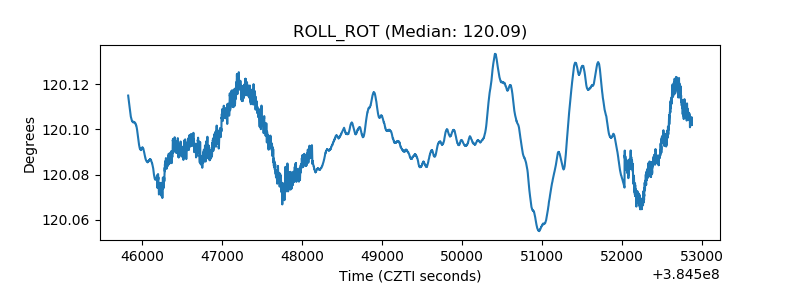 |
| _Roll_DEC | 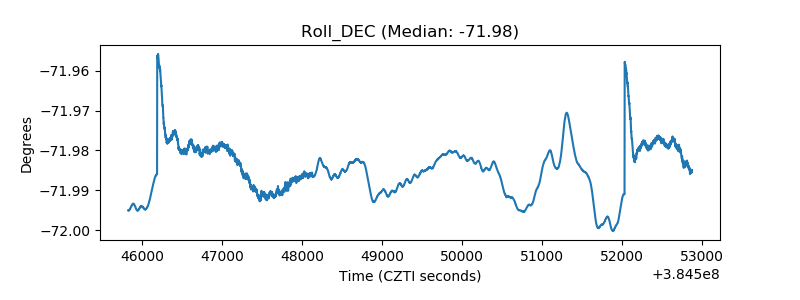 |
| _Roll_RA | 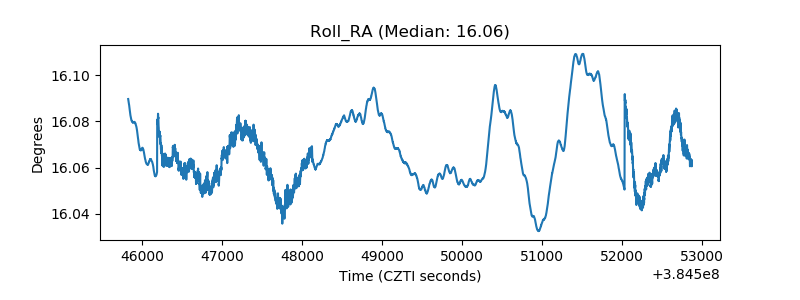 |
| Veto Counter | 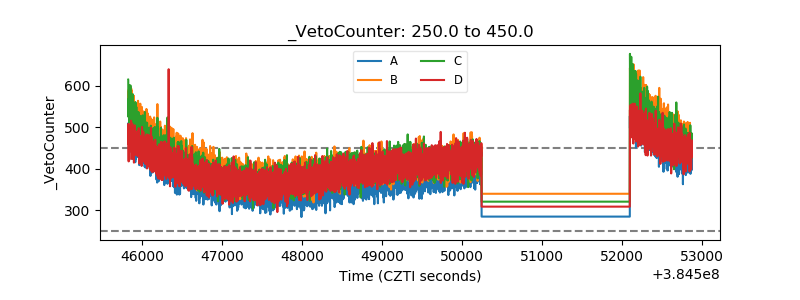 |