| Param | Original file | Final file |
|---|---|---|
| Filename | modeM0/AS1C07_005T01_9000004992_34852cztM0_level2.evt | modeM0/AS1C07_005T01_9000004992_34852cztM0_level2_quad_clean.evt |
| Size (bytes) | 903,504,960 | 76,579,200 |
| Size | 861.6 MB | 73.0 MB |
| Events in quadrant A | 10,397,948 | 310,529 |
| Events in quadrant B | 8,928,355 | 492,624 |
| Events in quadrant C | 2,990,924 | 589,154 |
| Events in quadrant D | 4,680,792 | 545,008 |
| Mode M9 | |||
|---|---|---|---|
| Quadrant | BADHDUFLAG | Total packets | Discarded packets |
| A | 0 | 23 | 0 |
| B | 0 | 23 | 0 |
| C | 0 | 23 | 0 |
| D | 0 | 24 | 0 |
| Mode M0 | |||
|---|---|---|---|
| Quadrant | BADHDUFLAG | Total packets | Discarded packets |
| A | 0 | 34630 | 3 |
| B | 0 | 30067 | 2 |
| C | 0 | 12199 | 2 |
| D | 0 | 17559 | 2 |
| Mode SS | |||
|---|---|---|---|
| Quadrant | BADHDUFLAG | Total packets | Discarded packets |
| A | 0 | 108 | 0 |
| B | 0 | 108 | 0 |
| C | 0 | 108 | 0 |
| D | 0 | 108 | 0 |
| Quadrant | Total seconds | Saturated seconds | Saturation percentage |
|---|---|---|---|
| A | 5421 | 3847 | 70.964767% |
| B | 5421 | 2953 | 54.473344% |
| C | 5421 | 79 | 1.457296% |
| D | 5421 | 425 | 7.839882% |
Noise dominated data is calculated using 1-second bins in cleaned event files. If a bin has >2000 counts, and if more than 50% of those come from <1% of pixels, then it is considered to be noise-dominated and hence unusable.
| Quadrant | # 1 sec bins | Bins with >0 counts | Bins with >2000 counts | High rate bins dominated by noise | Noise dominated (total time) | Noise dominated (detector-on time) | Marked lightcurve |
|---|---|---|---|---|---|---|---|
| A | 7123 | 5420 | 3120 | 3120 | 43.80% | 57.56% | 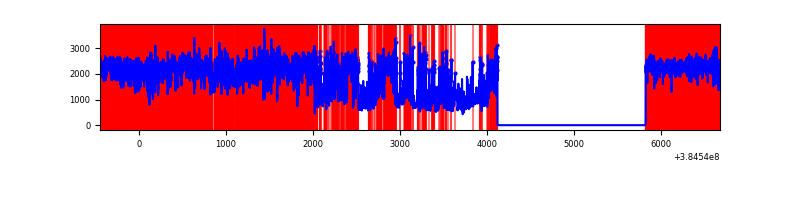 |
| B | 7124 | 5422 | 2662 | 2662 | 37.37% | 49.10% | 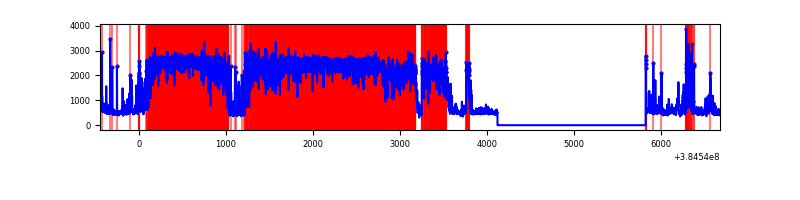 |
| C | 7124 | 5422 | 70 | 70 | 0.98% | 1.29% | 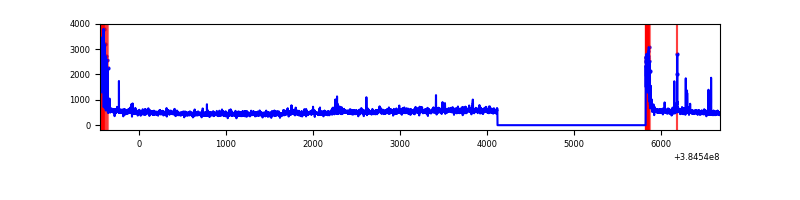 |
| D | 7124 | 5422 | 452 | 452 | 6.34% | 8.34% | 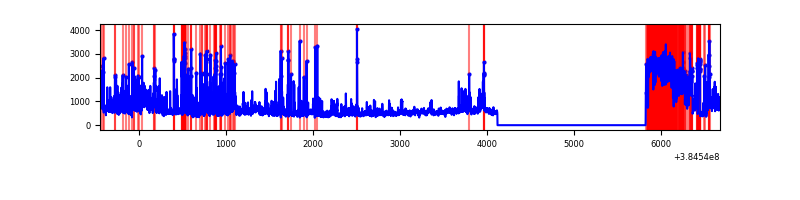 |
Top three noisy pixels from each quadrant. If the there are fewer than three noisy pixels in the level2.evt file, extra rows are filled as -1
| Pixel properties | Quadrant properties | ||||||
|---|---|---|---|---|---|---|---|
| Quadrant | DetID | PixID | Counts | Sigma | Mean | Median | Sigma |
| A | 15 | 169 | 8961372 | 124092.98 | 355 | 348 | 72.2 |
| A | 10 | 83 | 20222 | 275.22 | 355 | 348 | 72.2 |
| A | 15 | 237 | 18053 | 245.18 | 355 | 348 | 72.2 |
| B | 5 | 14 | 1995902 | 20978.56 | 501 | 488 | 95.1 |
| B | 5 | 31 | 1989719 | 20913.56 | 501 | 488 | 95.1 |
| B | 5 | 15 | 1984999 | 20863.93 | 501 | 488 | 95.1 |
| C | 15 | 214 | 246214 | 1772.92 | 597 | 600 | 138.5 |
| C | 0 | 10 | 212642 | 1530.58 | 597 | 600 | 138.5 |
| C | 14 | 67 | 132573 | 952.62 | 597 | 600 | 138.5 |
| D | 12 | 227 | 989988 | 6966.75 | 583 | 568 | 142.0 |
| D | 8 | 195 | 611587 | 4302.33 | 583 | 568 | 142.0 |
| D | 2 | 250 | 299242 | 2103.04 | 583 | 568 | 142.0 |
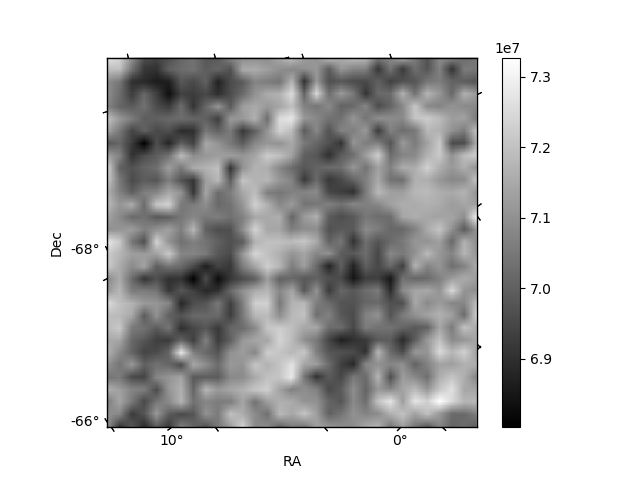
Histogram calculated using DETX and DETY for each event in the final _common_clean file
| Quadrant A | 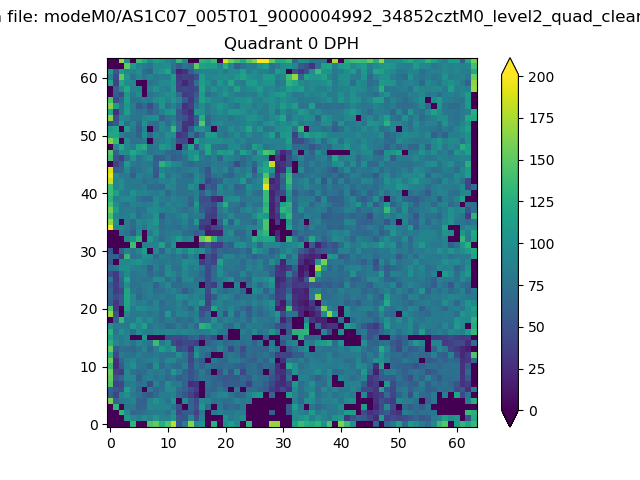 |
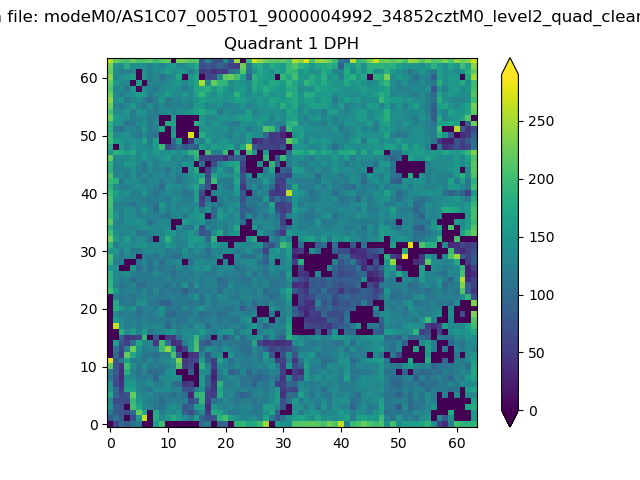 |
Quadrant B |
|---|---|---|---|
| Quadrant D | 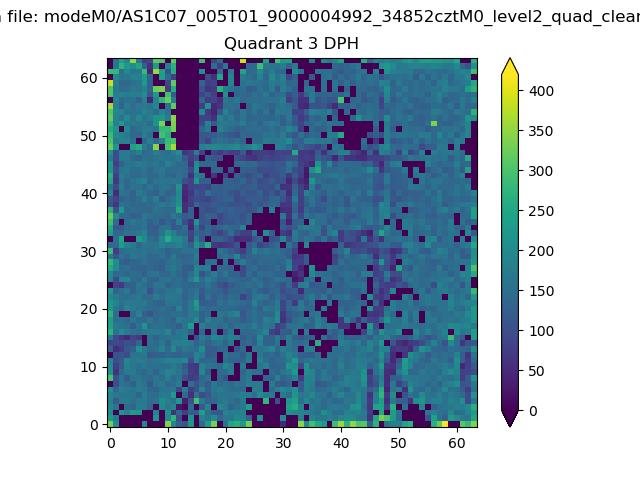 |
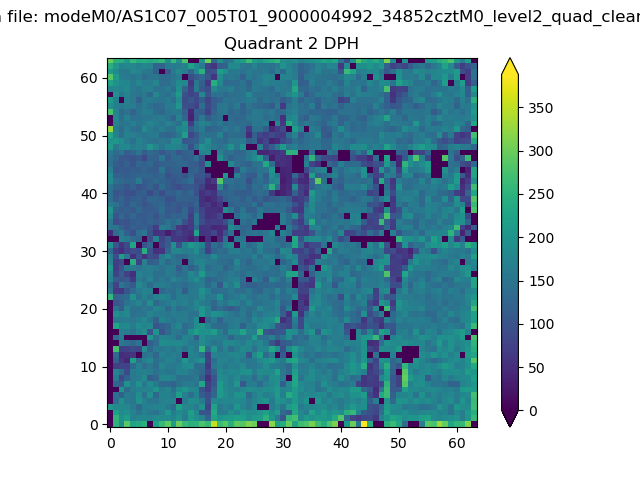 |
Quadrant C |
| Plot type | Count rate plots | Images |
|---|---|---|
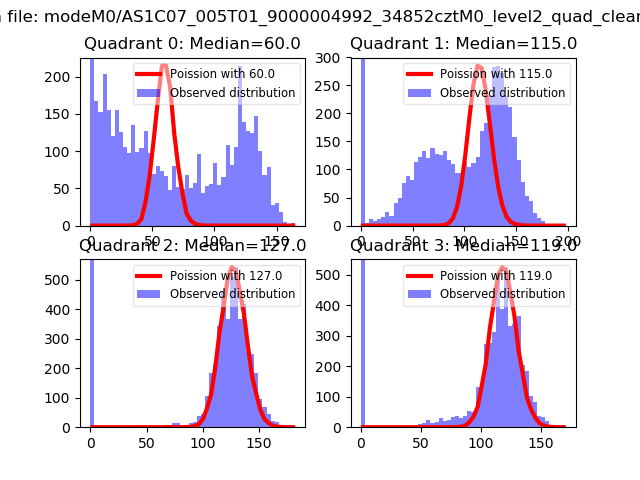
| Comparison with Poisson distribution Blue bars denote a histogram of data divided into 1 sec bins. Red curve is a Poisson curve with rate = median count rate of data. |
 |
 |
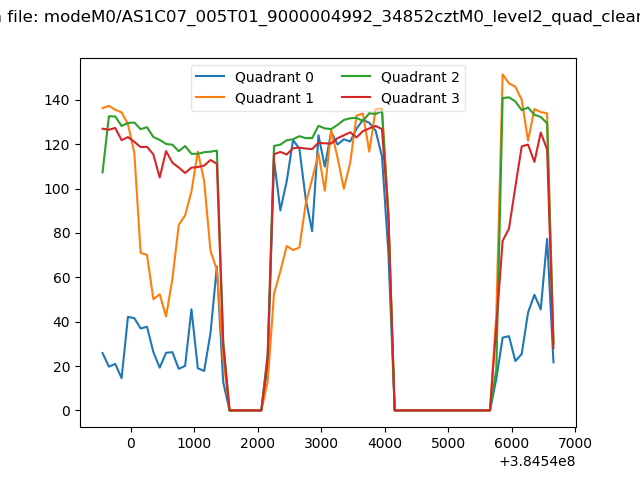
| Quadrant-wise count rates Data is divided into 100 sec bins |
 |
|
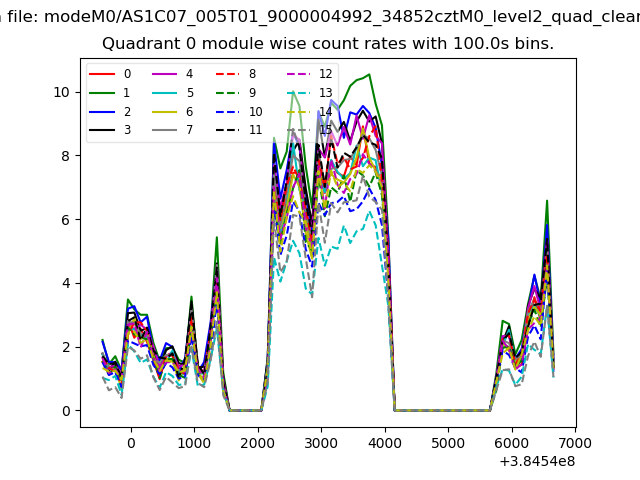
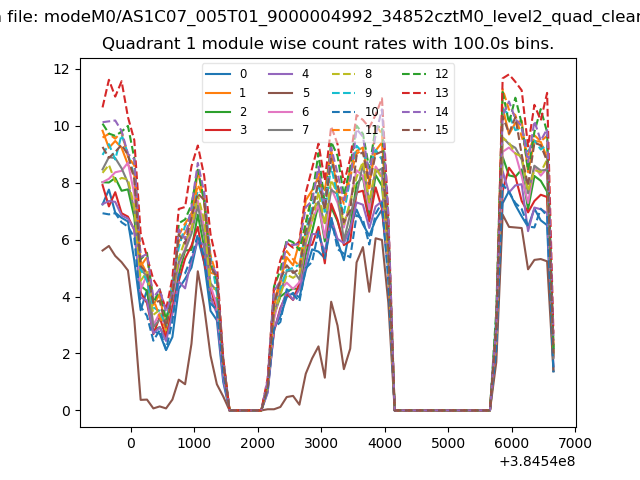
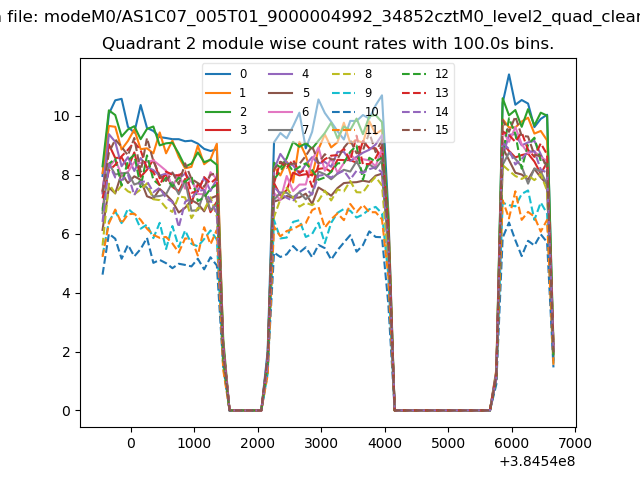
| Module-wise count rates for Quadrant A Data is divided into 100 sec bins |
 |
 |
| Module-wise count rates for Quadrant B Data is divided into 100 sec bins |
 |
 |
| Module-wise count rates for Quadrant C Data is divided into 100 sec bins |
 |
 |
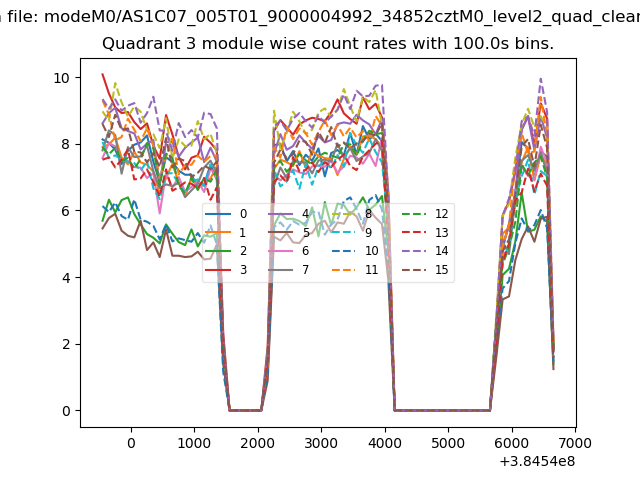
| Module-wise count rates for Quadrant D Data is divided into 100 sec bins |
 |
 |
| Parameter | Plot |
|---|---|
| CZT HV Monitor | 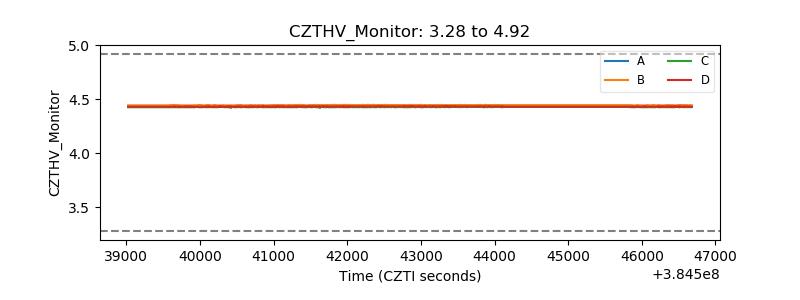 |
| D_VDD | 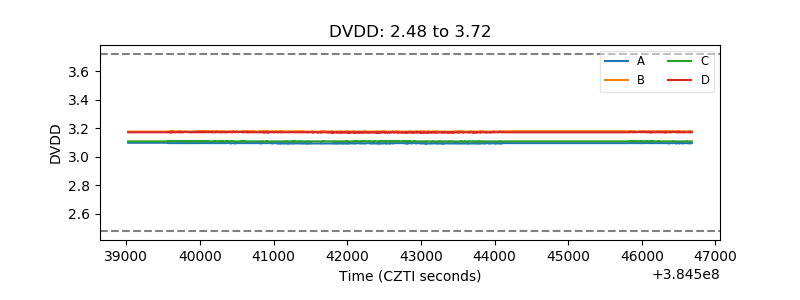 |
| Temperature 1 | 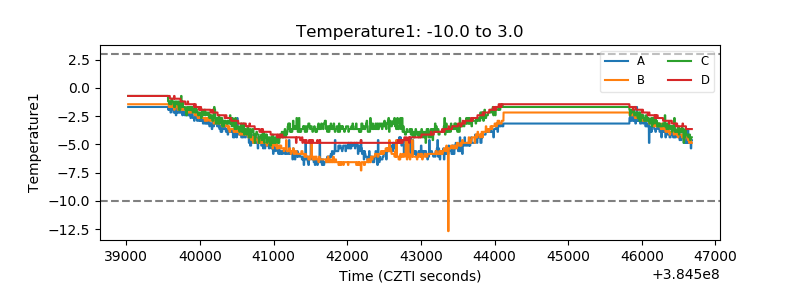 |
| Veto HV Monitor | 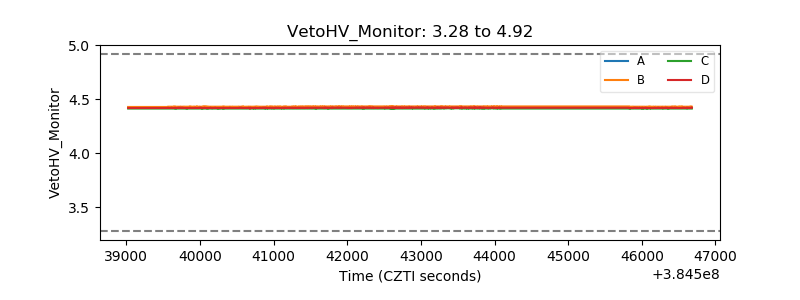 |
| Veto LLD | 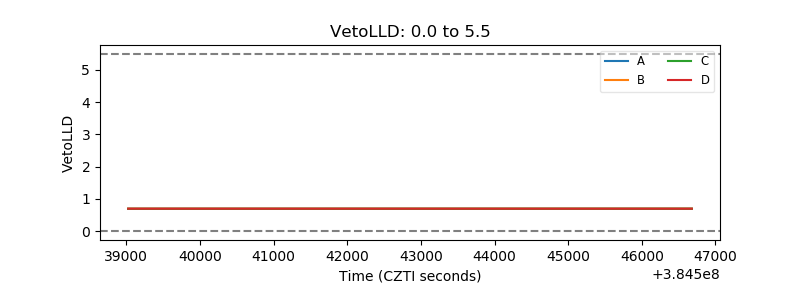 |
| Alpha Counter | 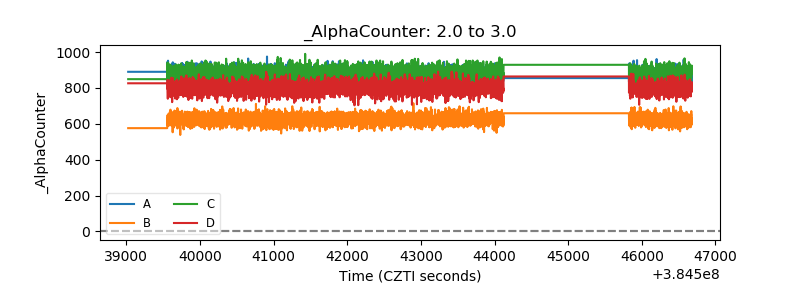 |
| _CPM_Rate | 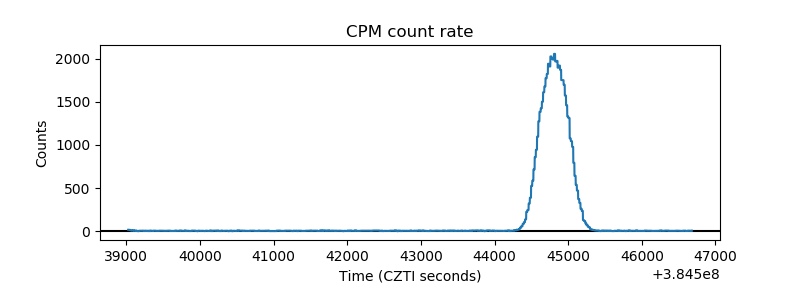 |
| CZT Counter | 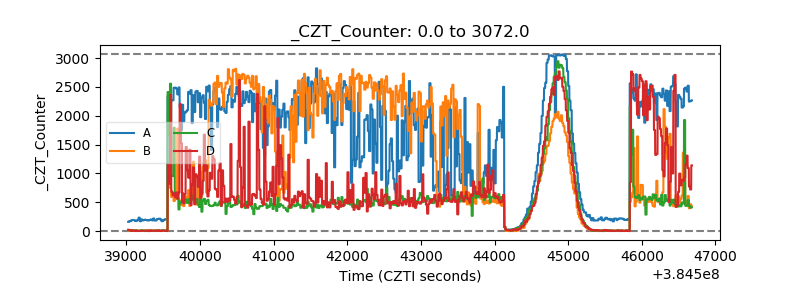 |
| +2.5 Volts monitor | 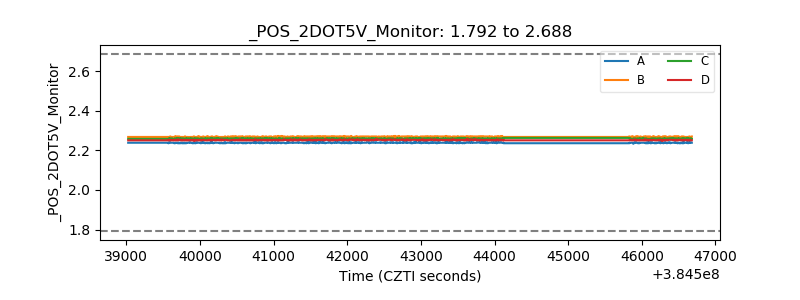 |
| +5 Volts monitor | 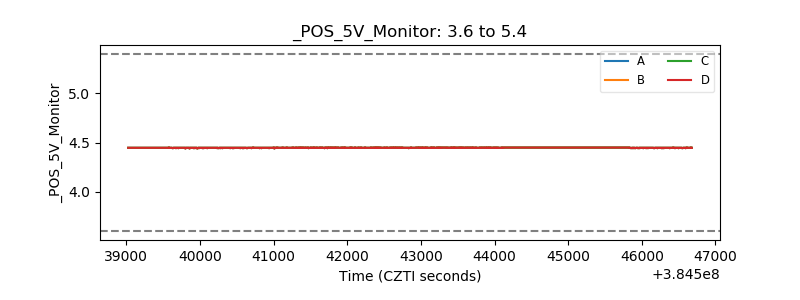 |
| _ROLL_ROT | 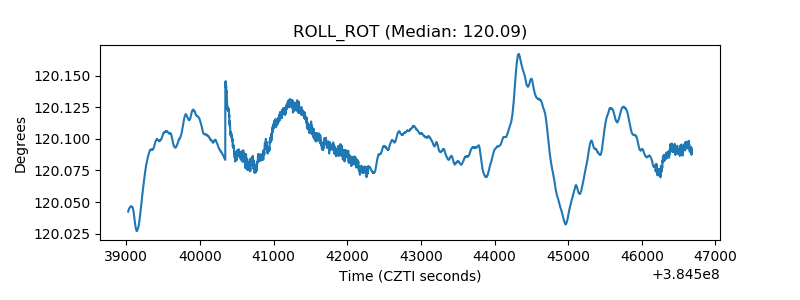 |
| _Roll_DEC | 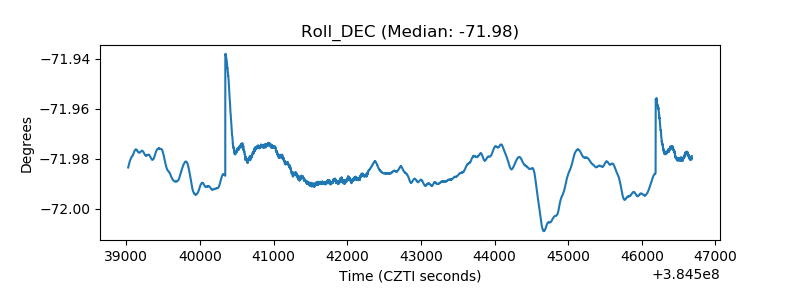 |
| _Roll_RA | 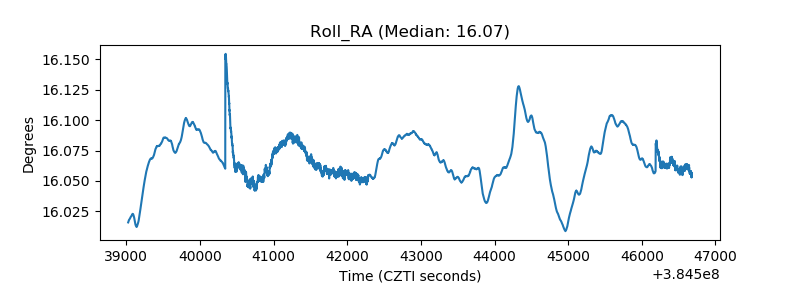 |
| Veto Counter | 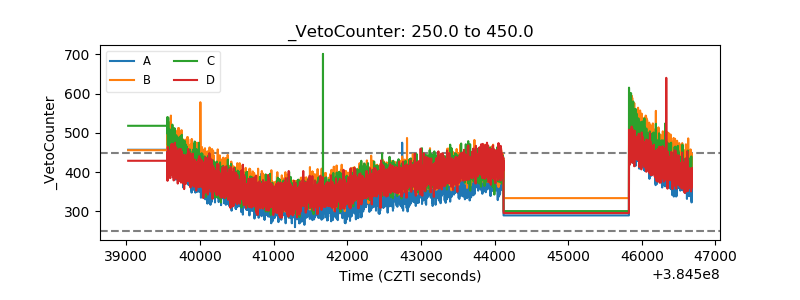 |