| Param | Original file | Final file |
|---|---|---|
| Filename | modeM0/AS1C07_005T01_9000004992_34850cztM0_level2.evt | modeM0/AS1C07_005T01_9000004992_34850cztM0_level2_quad_clean.evt |
| Size (bytes) | 1,511,948,160 | 148,550,400 |
| Size | 1.4 GB | 141.7 MB |
| Events in quadrant A | 22,356,415 | 536,640 |
| Events in quadrant B | 8,991,274 | 1,074,330 |
| Events in quadrant C | 6,368,563 | 1,102,240 |
| Events in quadrant D | 7,366,025 | 1,053,703 |
| Mode M9 | |||
|---|---|---|---|
| Quadrant | BADHDUFLAG | Total packets | Discarded packets |
| A | 0 | 28 | 0 |
| B | 0 | 28 | 0 |
| C | 0 | 28 | 0 |
| D | 0 | 28 | 0 |
| Mode M0 | |||
|---|---|---|---|
| Quadrant | BADHDUFLAG | Total packets | Discarded packets |
| A | 0 | 73541 | 3 |
| B | 0 | 33649 | 2 |
| C | 0 | 25522 | 2 |
| D | 0 | 29403 | 2 |
| Mode SS | |||
|---|---|---|---|
| Quadrant | BADHDUFLAG | Total packets | Discarded packets |
| A | 0 | 214 | 0 |
| B | 0 | 214 | 0 |
| C | 0 | 214 | 0 |
| D | 0 | 214 | 0 |
| Quadrant | Total seconds | Saturated seconds | Saturation percentage |
|---|---|---|---|
| A | 10519 | 8333 | 79.218557% |
| B | 10519 | 1290 | 12.263523% |
| C | 10519 | 210 | 1.996387% |
| D | 10519 | 255 | 2.424185% |
Noise dominated data is calculated using 1-second bins in cleaned event files. If a bin has >2000 counts, and if more than 50% of those come from <1% of pixels, then it is considered to be noise-dominated and hence unusable.
| Quadrant | # 1 sec bins | Bins with >0 counts | Bins with >2000 counts | High rate bins dominated by noise | Noise dominated (total time) | Noise dominated (detector-on time) | Marked lightcurve |
|---|---|---|---|---|---|---|---|
| A | 13324 | 10518 | 7787 | 7787 | 58.44% | 74.03% | 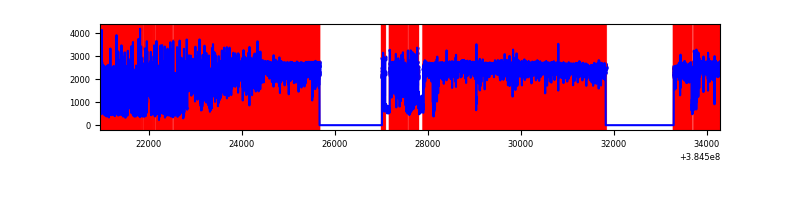 |
| B | 13324 | 10520 | 1107 | 1107 | 8.31% | 10.52% | 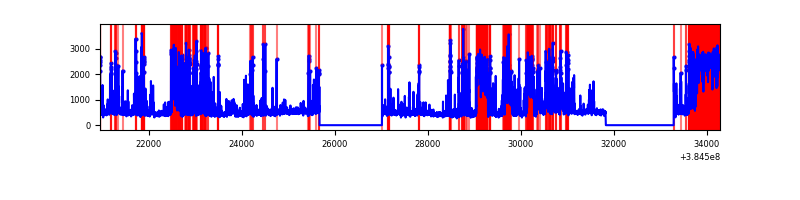 |
| C | 13325 | 10521 | 170 | 170 | 1.28% | 1.62% | 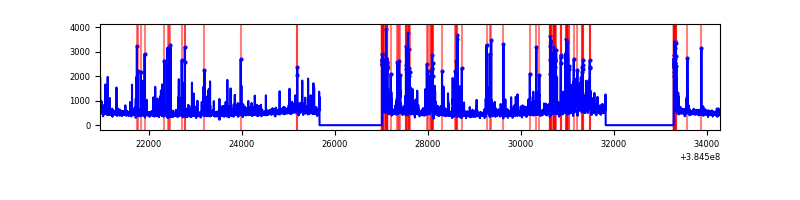 |
| D | 13325 | 10521 | 222 | 222 | 1.67% | 2.11% | 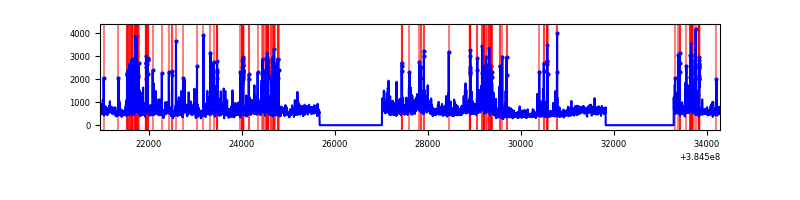 |
Top three noisy pixels from each quadrant. If the there are fewer than three noisy pixels in the level2.evt file, extra rows are filled as -1
| Pixel properties | Quadrant properties | ||||||
|---|---|---|---|---|---|---|---|
| Quadrant | DetID | PixID | Counts | Sigma | Mean | Median | Sigma |
| A | 15 | 169 | 19791631 | 154263.78 | 636 | 623 | 128.3 |
| A | 10 | 83 | 38730 | 297.03 | 636 | 623 | 128.3 |
| A | 13 | 6 | 18625 | 140.32 | 636 | 623 | 128.3 |
| B | 5 | 14 | 1030667 | 4752.76 | 1148 | 1118 | 216.6 |
| B | 5 | 31 | 1023546 | 4719.88 | 1148 | 1118 | 216.6 |
| B | 5 | 15 | 1021763 | 4711.65 | 1148 | 1118 | 216.6 |
| C | 0 | 207 | 503938 | 1894.24 | 1151 | 1159 | 265.4 |
| C | 15 | 214 | 474867 | 1784.72 | 1151 | 1159 | 265.4 |
| C | 0 | 10 | 299288 | 1123.21 | 1151 | 1159 | 265.4 |
| D | 8 | 195 | 1201392 | 4267.62 | 1154 | 1121 | 281.3 |
| D | 13 | 249 | 291394 | 1032.08 | 1154 | 1121 | 281.3 |
| D | 12 | 227 | 283719 | 1004.79 | 1154 | 1121 | 281.3 |
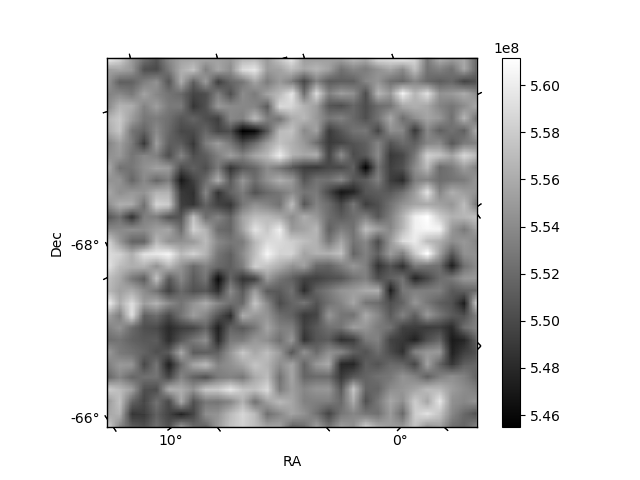
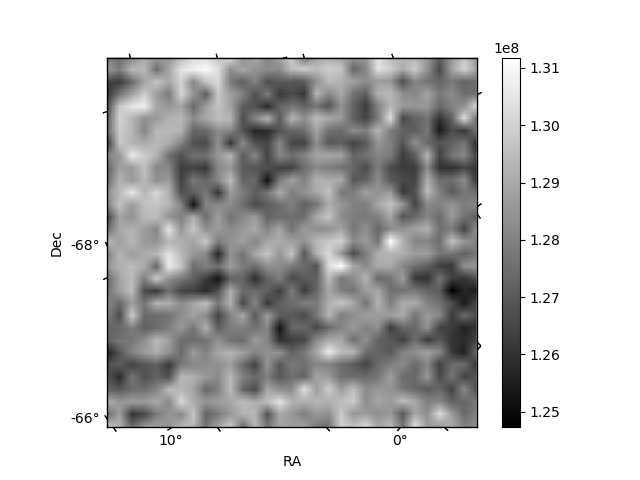
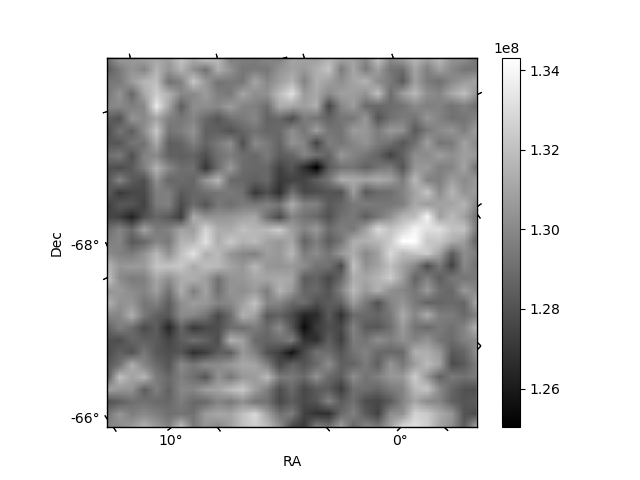
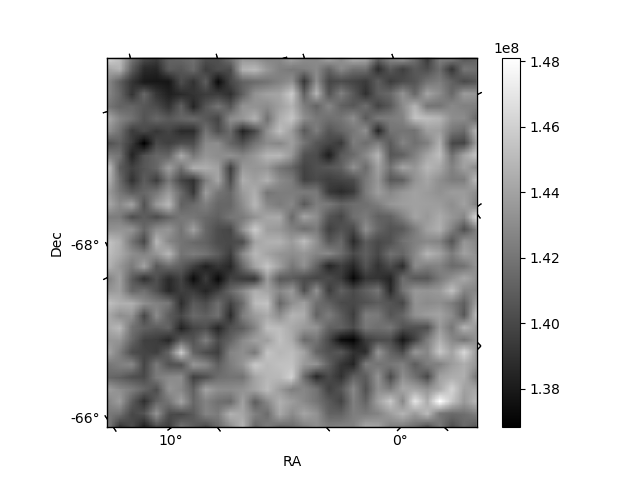
Histogram calculated using DETX and DETY for each event in the final _common_clean file
| Quadrant A | 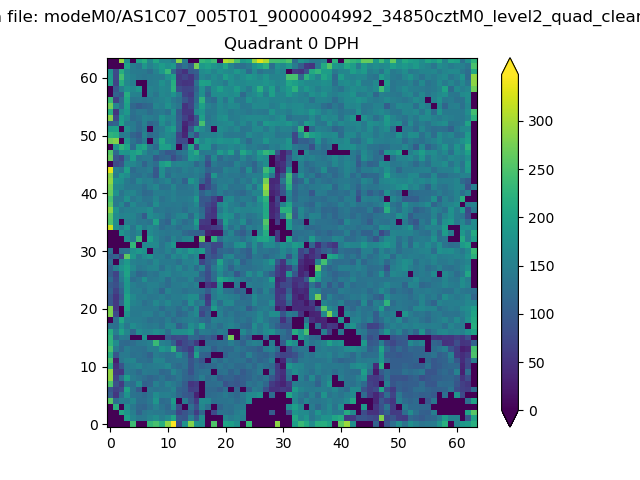 |
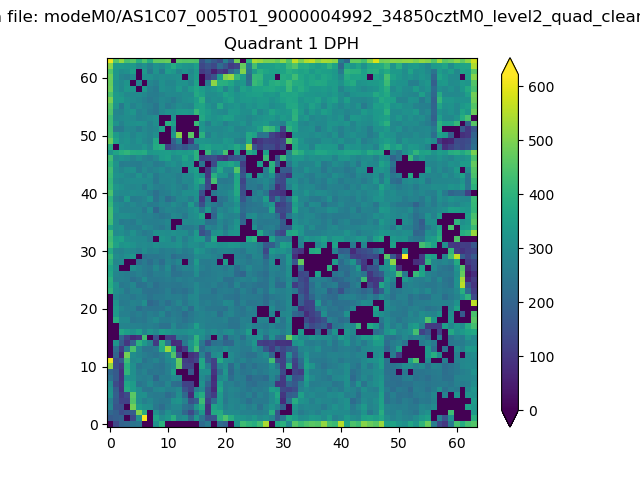 |
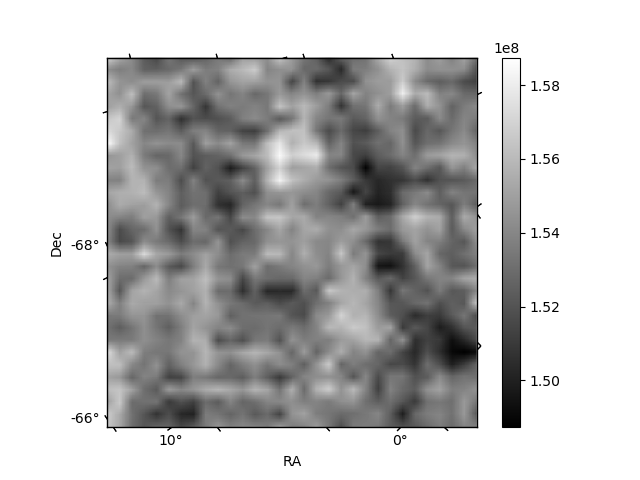
Quadrant B |
|---|---|---|---|
| Quadrant D | 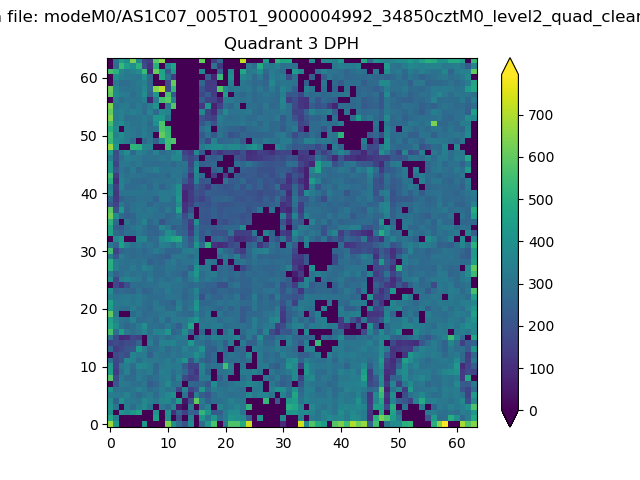 |
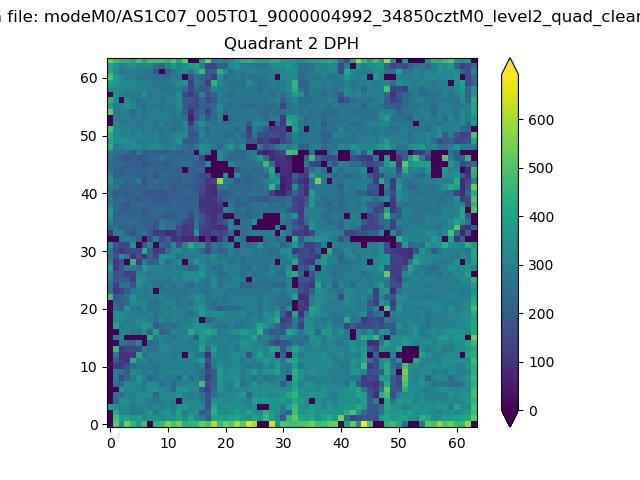 |
Quadrant C |
| Plot type | Count rate plots | Images |
|---|---|---|
| Comparison with Poisson distribution Blue bars denote a histogram of data divided into 1 sec bins. Red curve is a Poisson curve with rate = median count rate of data. |
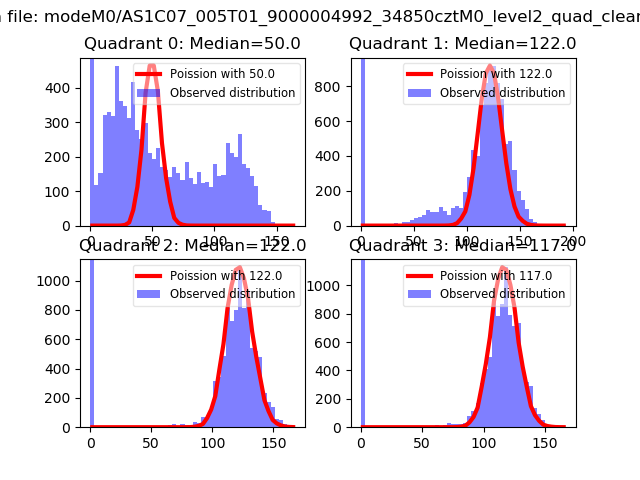 |
 |
| Quadrant-wise count rates Data is divided into 100 sec bins |
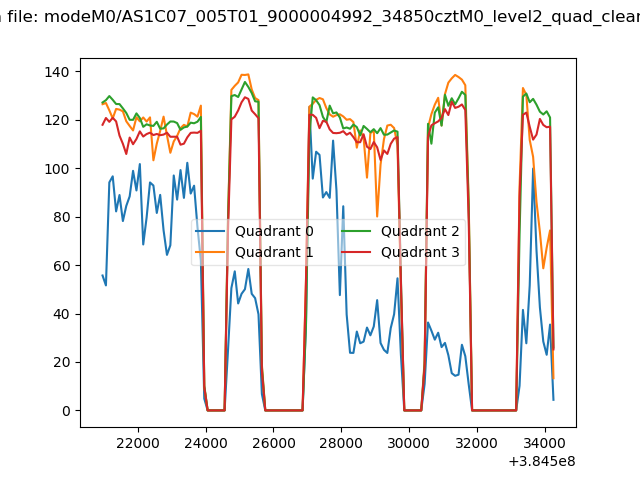 |
|
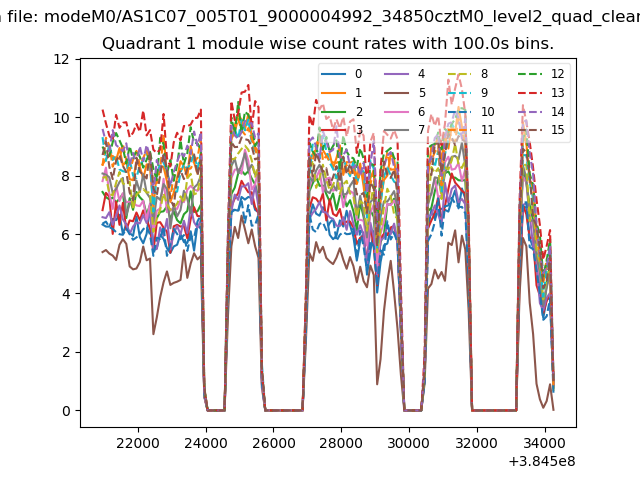
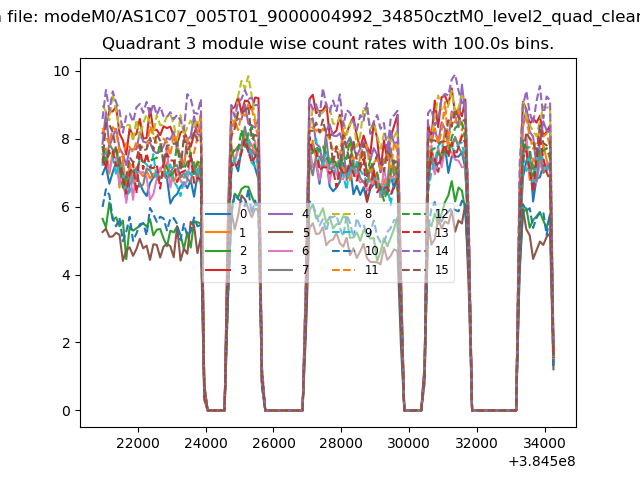
| Module-wise count rates for Quadrant A Data is divided into 100 sec bins |
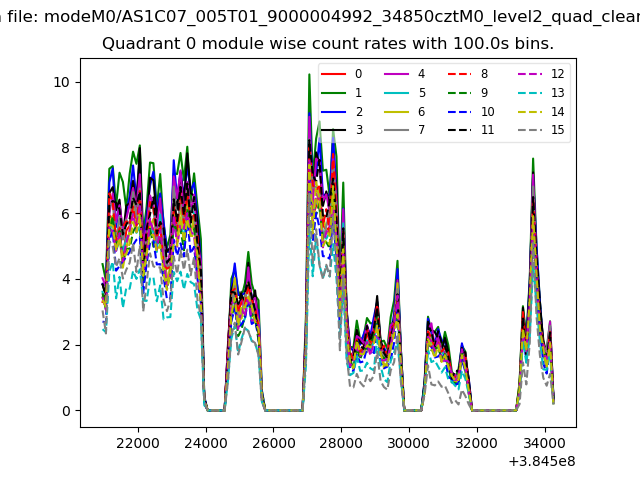 |
 |
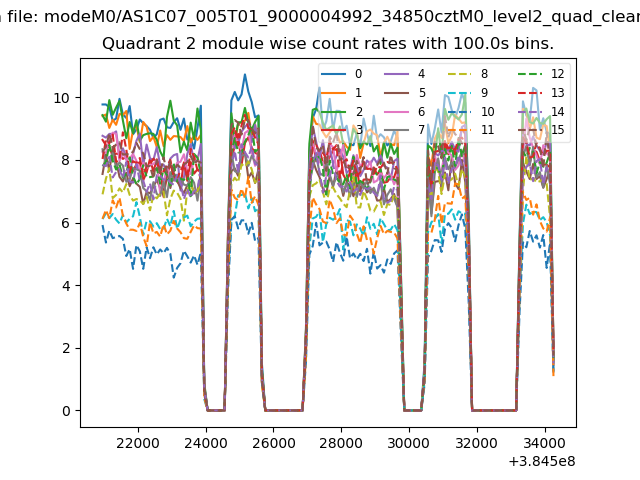
| Module-wise count rates for Quadrant B Data is divided into 100 sec bins |
 |
 |
| Module-wise count rates for Quadrant C Data is divided into 100 sec bins |
 |
 |
| Module-wise count rates for Quadrant D Data is divided into 100 sec bins |
 |
 |
| Parameter | Plot |
|---|---|
| CZT HV Monitor | 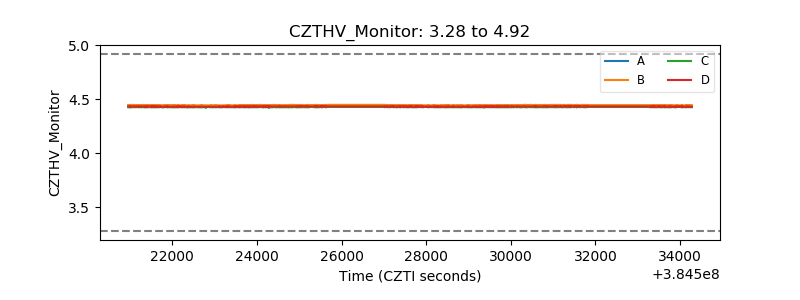 |
| D_VDD | 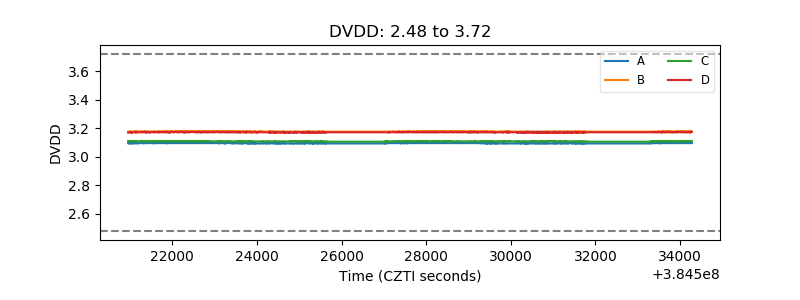 |
| Temperature 1 | 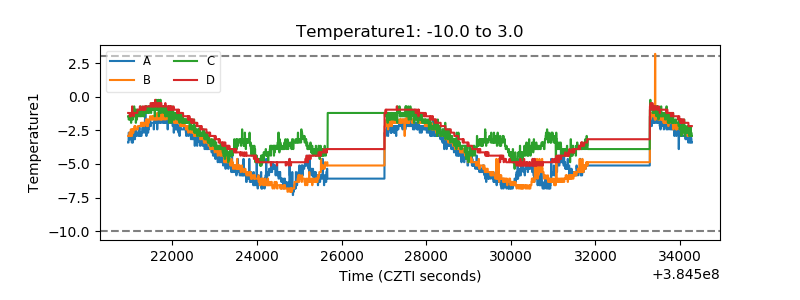 |
| Veto HV Monitor | 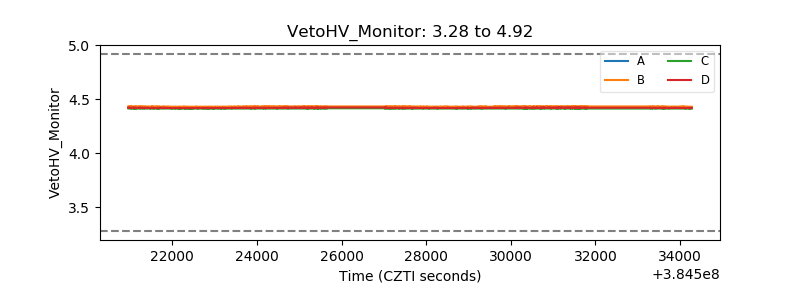 |
| Veto LLD | 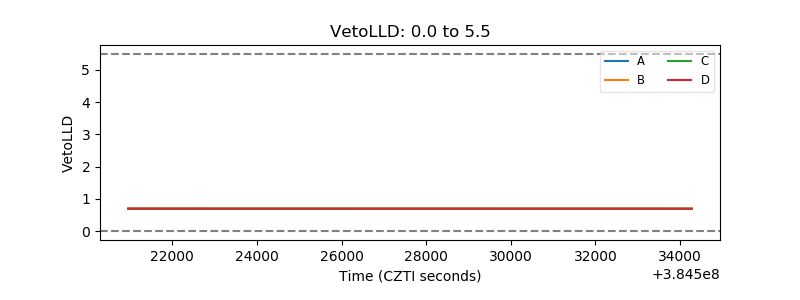 |
| Alpha Counter | 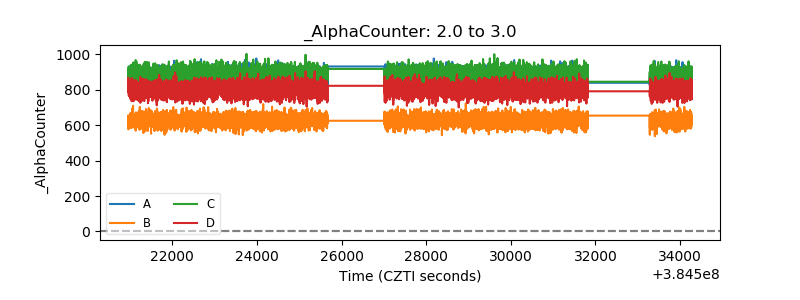 |
| _CPM_Rate | 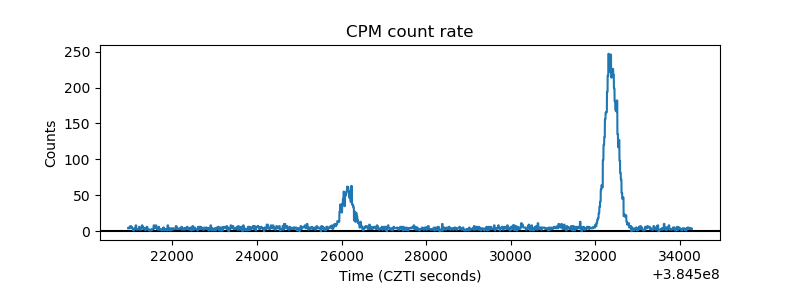 |
| CZT Counter | 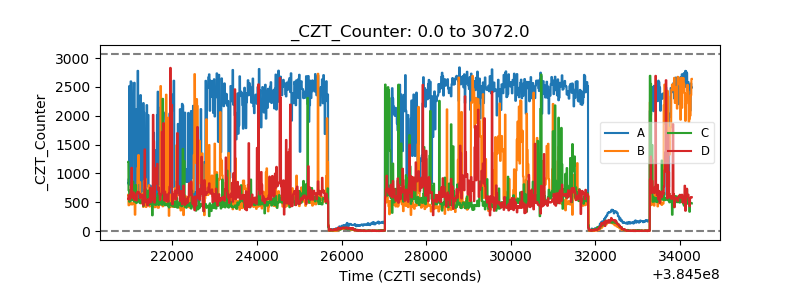 |
| +2.5 Volts monitor | 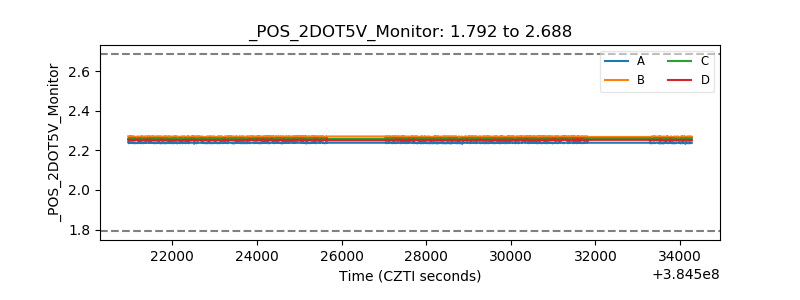 |
| +5 Volts monitor | 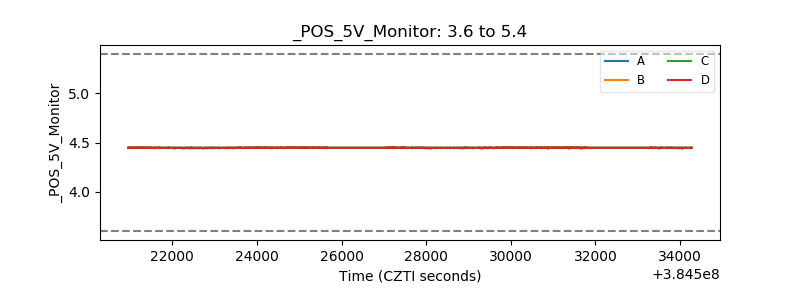 |
| _ROLL_ROT | 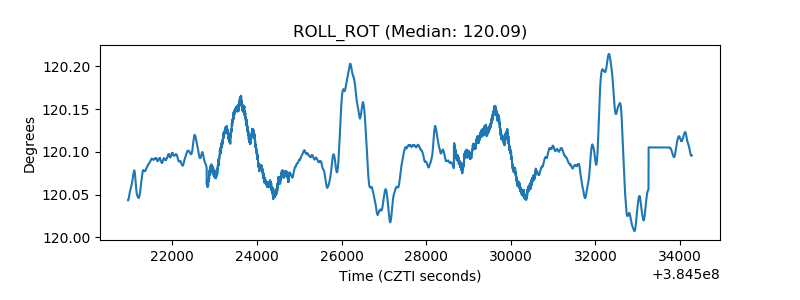 |
| _Roll_DEC | 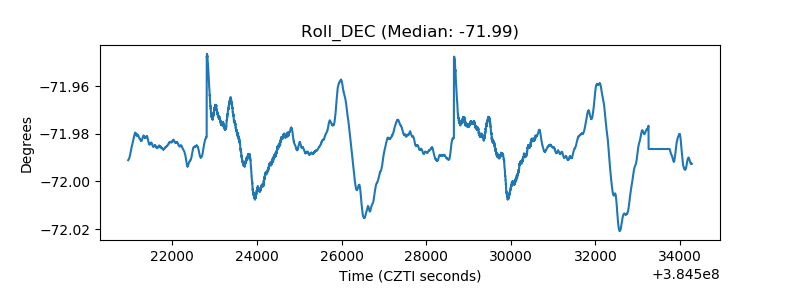 |
| _Roll_RA | 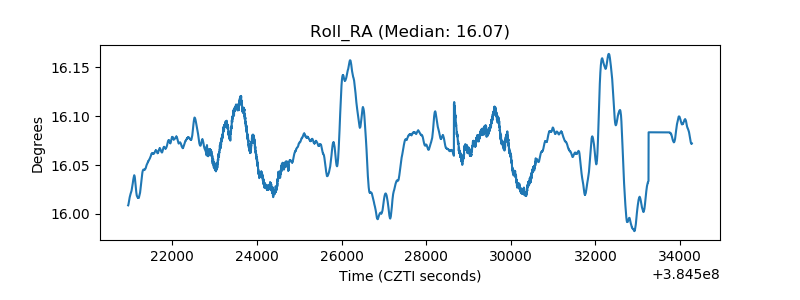 |
| Veto Counter | 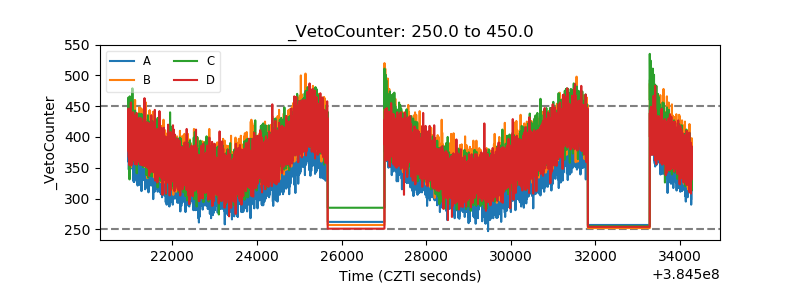 |