| Param | Original file | Final file |
|---|---|---|
| Filename | modeM0/AS1C07_005T01_9000004992_34848cztM0_level2.evt | modeM0/AS1C07_005T01_9000004992_34848cztM0_level2_quad_clean.evt |
| Size (bytes) | 730,906,560 | 83,335,680 |
| Size | 697.0 MB | 79.5 MB |
| Events in quadrant A | 7,495,058 | 400,831 |
| Events in quadrant B | 7,043,959 | 554,152 |
| Events in quadrant C | 3,144,059 | 603,135 |
| Events in quadrant D | 4,073,319 | 571,342 |
| Mode M9 | |||
|---|---|---|---|
| Quadrant | BADHDUFLAG | Total packets | Discarded packets |
| A | 0 | 13 | 0 |
| B | 0 | 13 | 0 |
| C | 0 | 13 | 0 |
| D | 0 | 13 | 0 |
| Mode M0 | |||
|---|---|---|---|
| Quadrant | BADHDUFLAG | Total packets | Discarded packets |
| A | 0 | 26197 | 2 |
| B | 0 | 24674 | 1 |
| C | 0 | 12705 | 1 |
| D | 0 | 16002 | 1 |
| Mode SS | |||
|---|---|---|---|
| Quadrant | BADHDUFLAG | Total packets | Discarded packets |
| A | 0 | 114 | 0 |
| B | 0 | 114 | 0 |
| C | 0 | 114 | 0 |
| D | 0 | 114 | 0 |
| Quadrant | Total seconds | Saturated seconds | Saturation percentage |
|---|---|---|---|
| A | 5614 | 2207 | 39.312433% |
| B | 5614 | 1526 | 27.182045% |
| C | 5614 | 99 | 1.763449% |
| D | 5614 | 189 | 3.366584% |
Noise dominated data is calculated using 1-second bins in cleaned event files. If a bin has >2000 counts, and if more than 50% of those come from <1% of pixels, then it is considered to be noise-dominated and hence unusable.
| Quadrant | # 1 sec bins | Bins with >0 counts | Bins with >2000 counts | High rate bins dominated by noise | Noise dominated (total time) | Noise dominated (detector-on time) | Marked lightcurve |
|---|---|---|---|---|---|---|---|
| A | 6897 | 5615 | 1289 | 1289 | 18.69% | 22.96% | 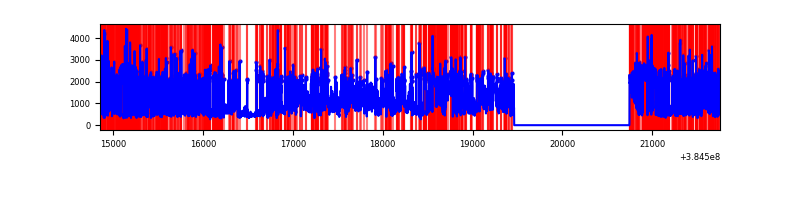 |
| B | 6897 | 5615 | 1307 | 1307 | 18.95% | 23.28% | 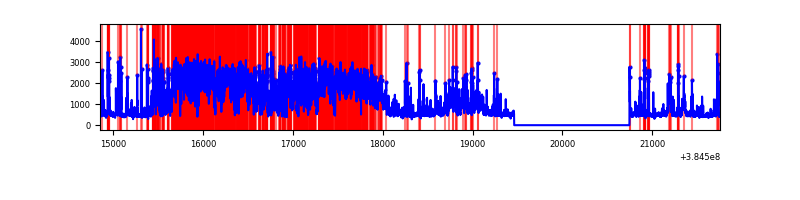 |
| C | 6897 | 5615 | 83 | 83 | 1.20% | 1.48% | 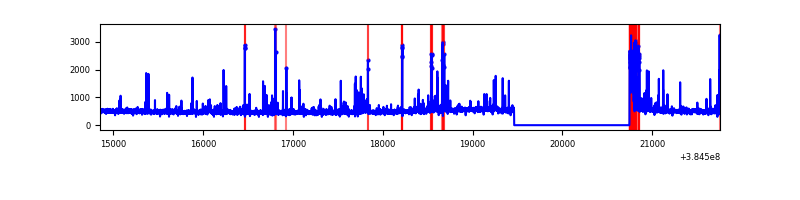 |
| D | 6896 | 5614 | 173 | 173 | 2.51% | 3.08% | 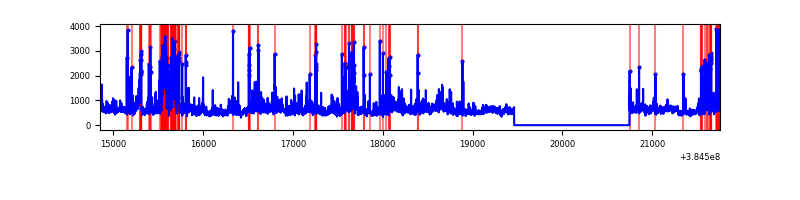 |
Top three noisy pixels from each quadrant. If the there are fewer than three noisy pixels in the level2.evt file, extra rows are filled as -1
| Pixel properties | Quadrant properties | ||||||
|---|---|---|---|---|---|---|---|
| Quadrant | DetID | PixID | Counts | Sigma | Mean | Median | Sigma |
| A | 15 | 169 | 5787128 | 65976.99 | 429 | 420 | 87.7 |
| A | 10 | 83 | 23882 | 267.5 | 429 | 420 | 87.7 |
| A | 13 | 6 | 11304 | 124.09 | 429 | 420 | 87.7 |
| B | 5 | 14 | 1216417 | 10653.69 | 597 | 582 | 114.1 |
| B | 5 | 31 | 1205838 | 10560.99 | 597 | 582 | 114.1 |
| B | 5 | 15 | 1203771 | 10542.88 | 597 | 582 | 114.1 |
| C | 15 | 214 | 252556 | 1756.7 | 617 | 620 | 143.4 |
| C | 0 | 10 | 211205 | 1468.37 | 617 | 620 | 143.4 |
| C | 0 | 207 | 195303 | 1357.49 | 617 | 620 | 143.4 |
| D | 8 | 195 | 592151 | 3749.78 | 617 | 601 | 157.8 |
| D | 12 | 233 | 349671 | 2212.72 | 617 | 601 | 157.8 |
| D | 13 | 249 | 126609 | 798.75 | 617 | 601 | 157.8 |
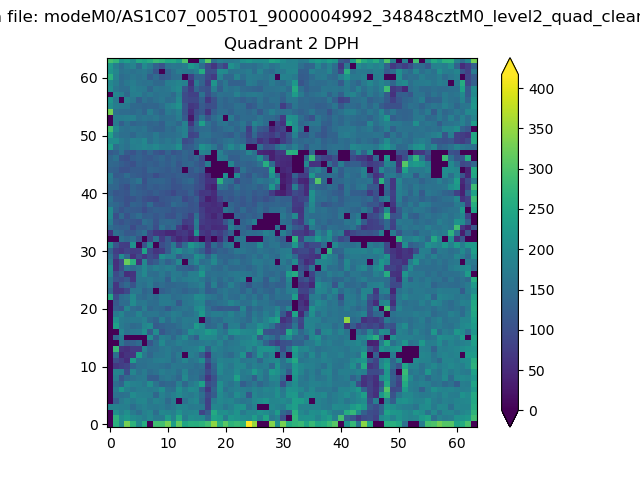
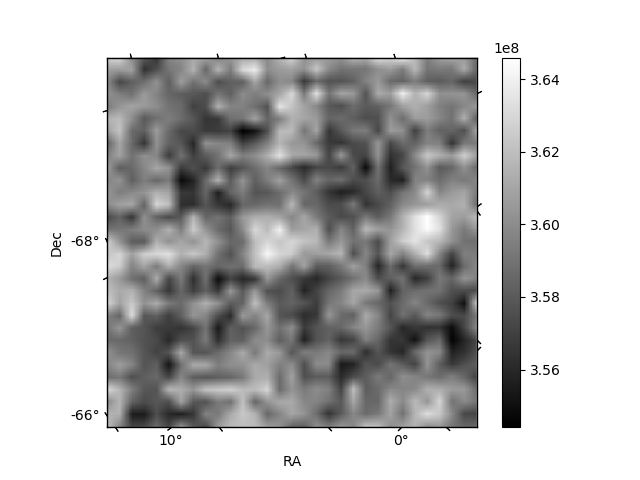
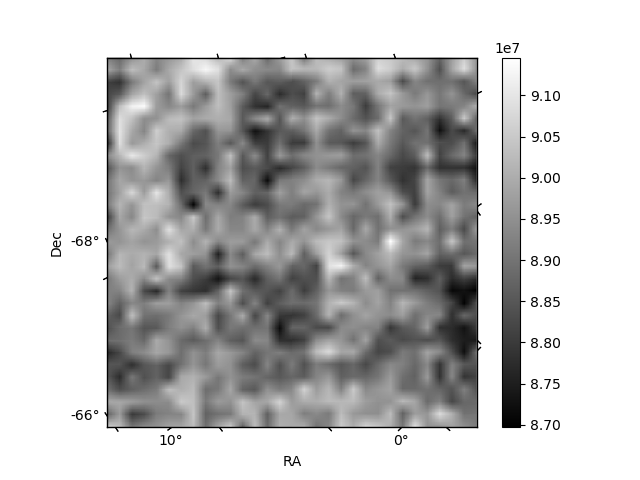
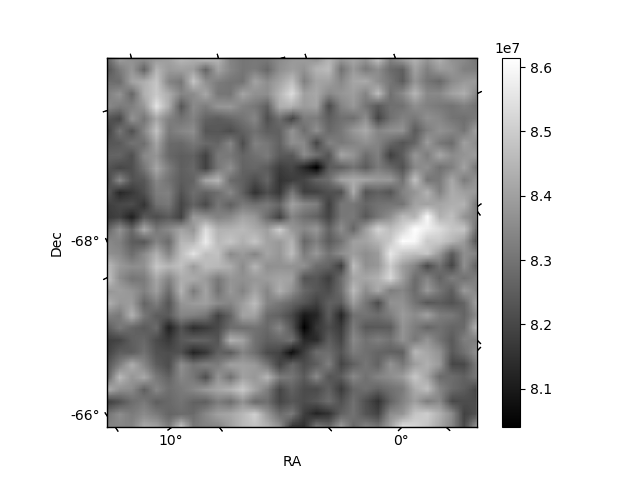
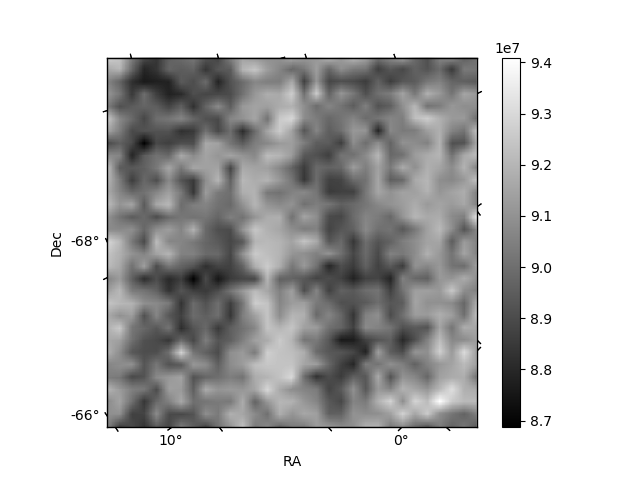
Histogram calculated using DETX and DETY for each event in the final _common_clean file
| Quadrant A | 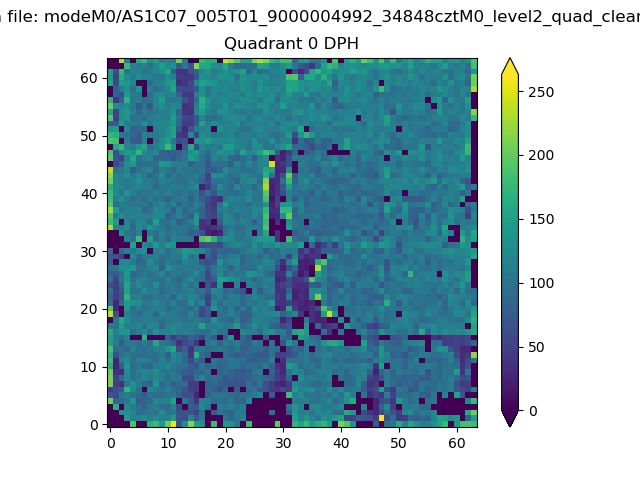 |
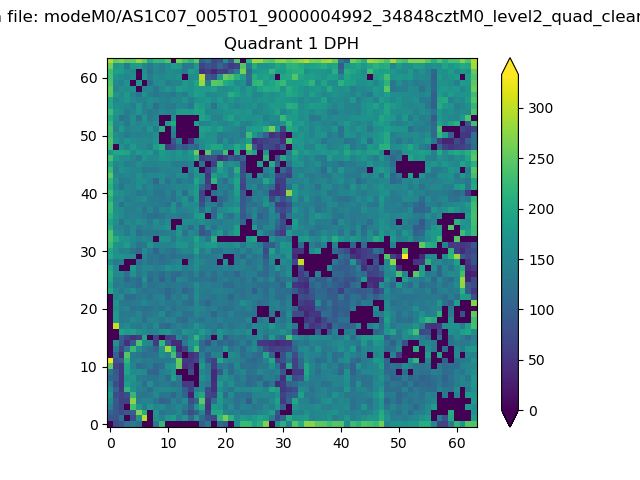 |
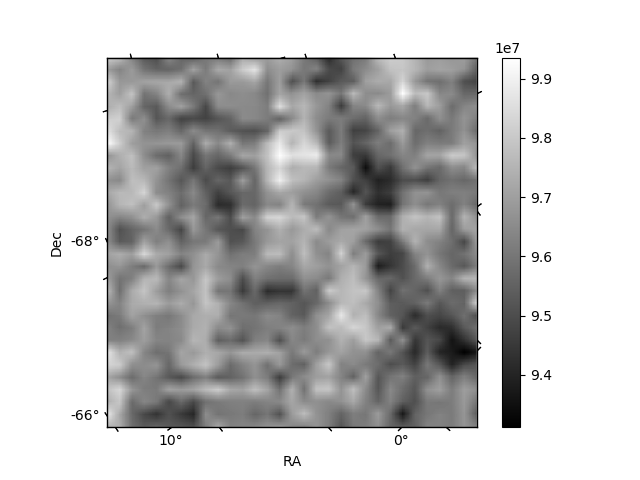
Quadrant B |
|---|---|---|---|
| Quadrant D | 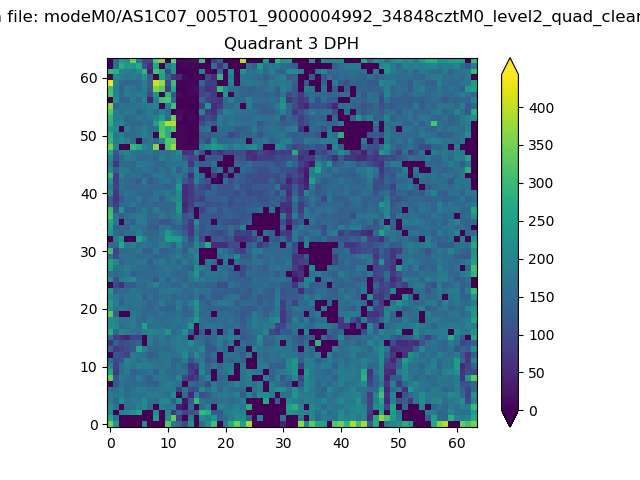 |
 |
Quadrant C |
| Plot type | Count rate plots | Images |
|---|---|---|
| Comparison with Poisson distribution Blue bars denote a histogram of data divided into 1 sec bins. Red curve is a Poisson curve with rate = median count rate of data. |
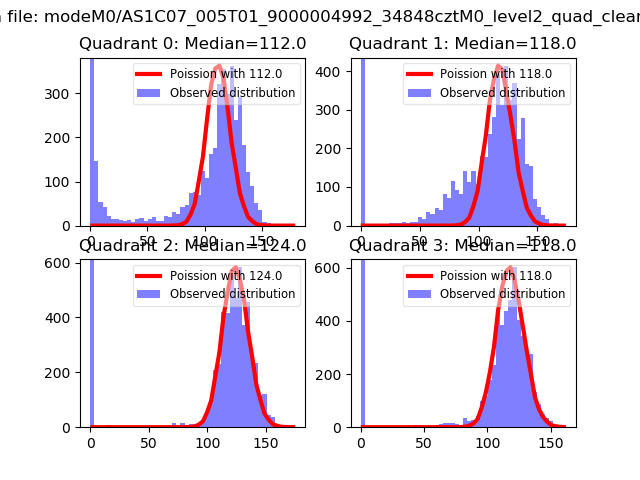 |
 |
| Quadrant-wise count rates Data is divided into 100 sec bins |
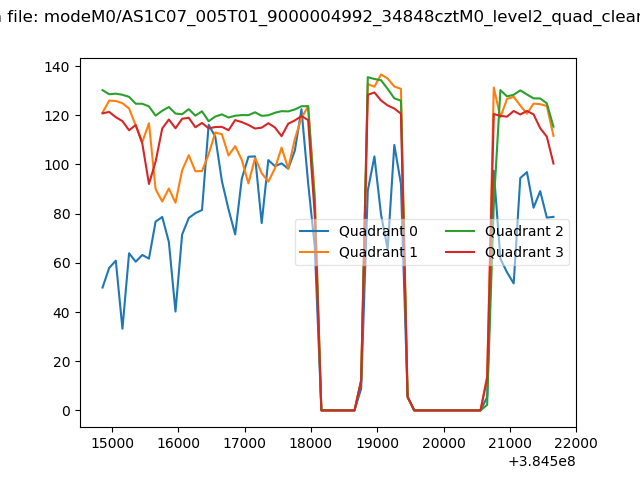 |
|
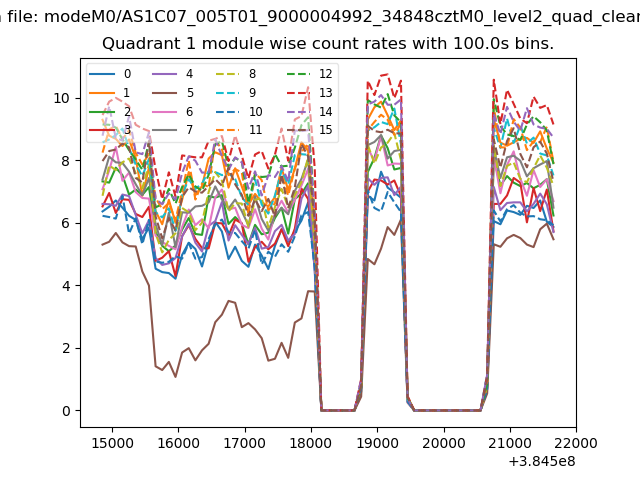
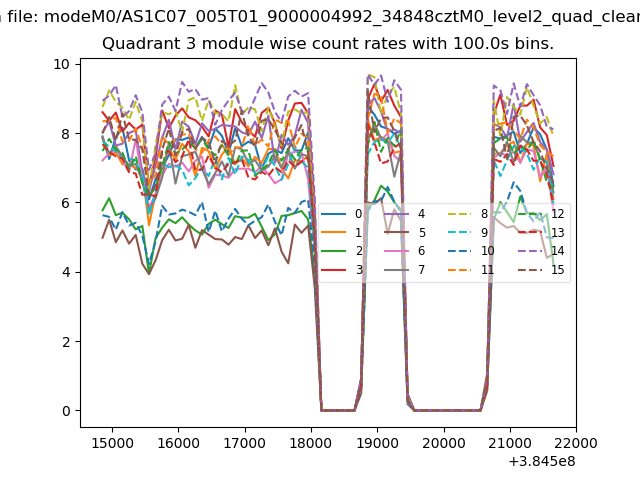
| Module-wise count rates for Quadrant A Data is divided into 100 sec bins |
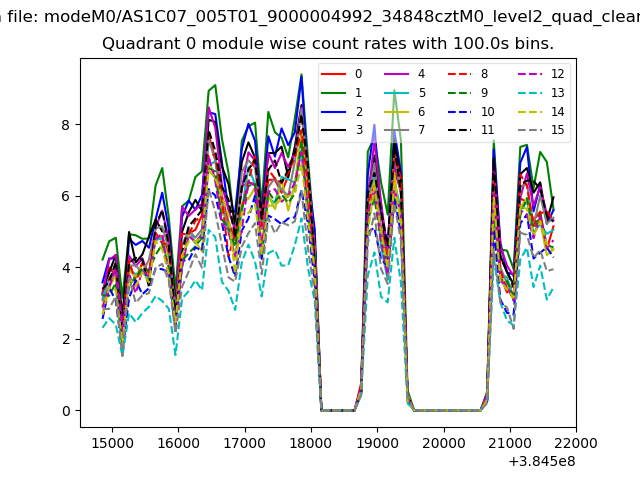 |
 |
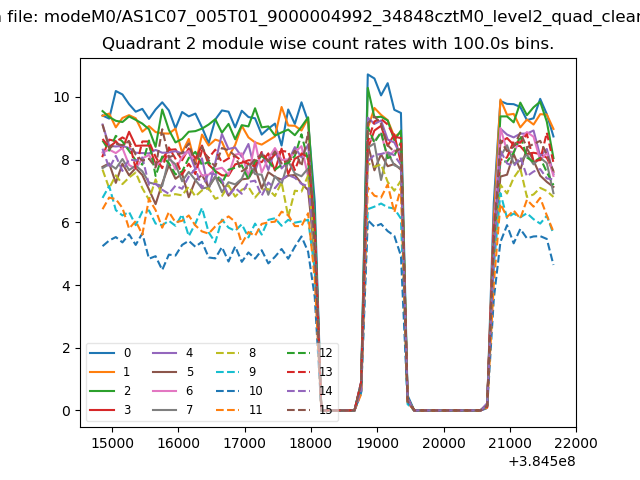
| Module-wise count rates for Quadrant B Data is divided into 100 sec bins |
 |
 |
| Module-wise count rates for Quadrant C Data is divided into 100 sec bins |
 |
 |
| Module-wise count rates for Quadrant D Data is divided into 100 sec bins |
 |
 |
| Parameter | Plot |
|---|---|
| CZT HV Monitor | 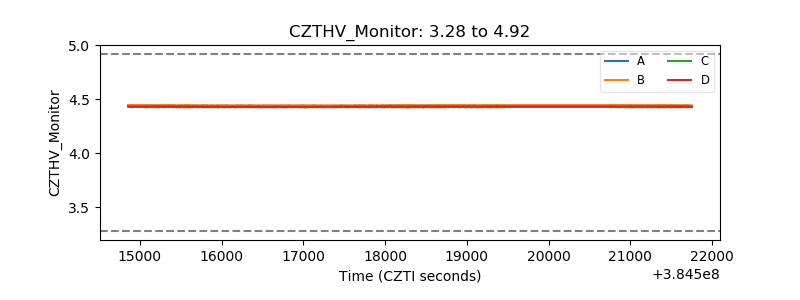 |
| D_VDD |  |
| Temperature 1 | 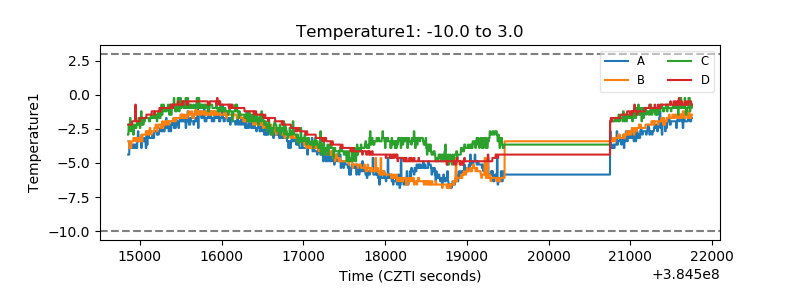 |
| Veto HV Monitor | 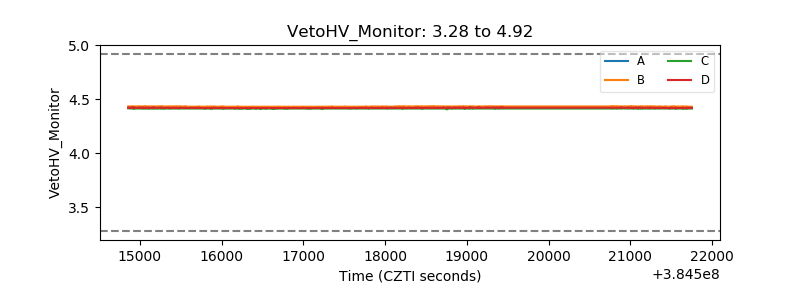 |
| Veto LLD | 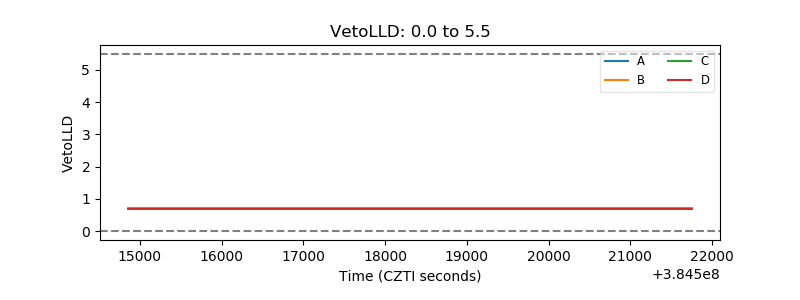 |
| Alpha Counter | 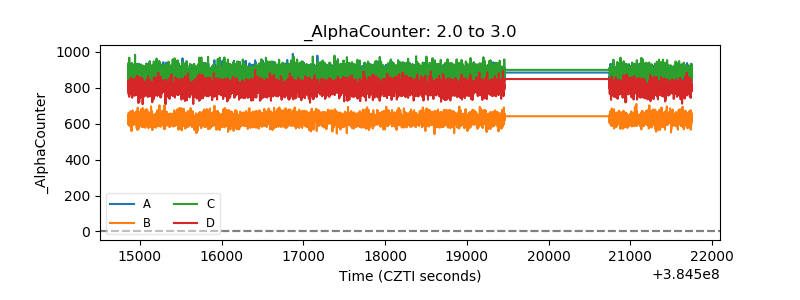 |
| _CPM_Rate | 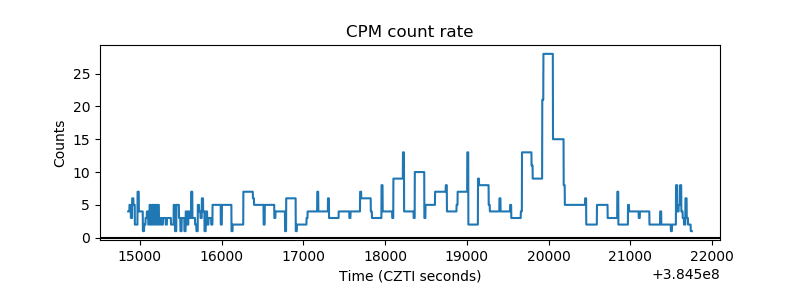 |
| CZT Counter | 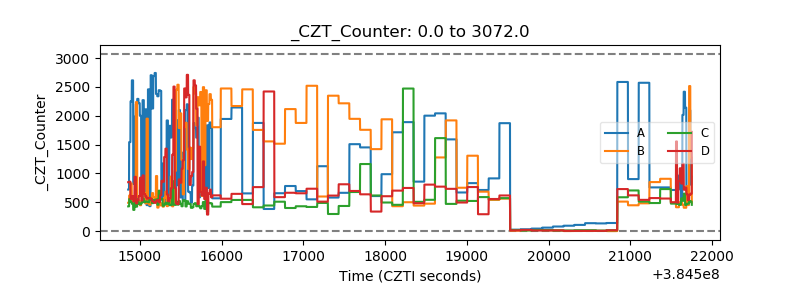 |
| +2.5 Volts monitor | 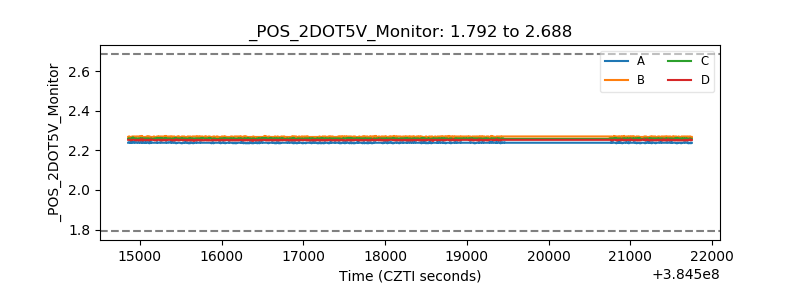 |
| +5 Volts monitor | 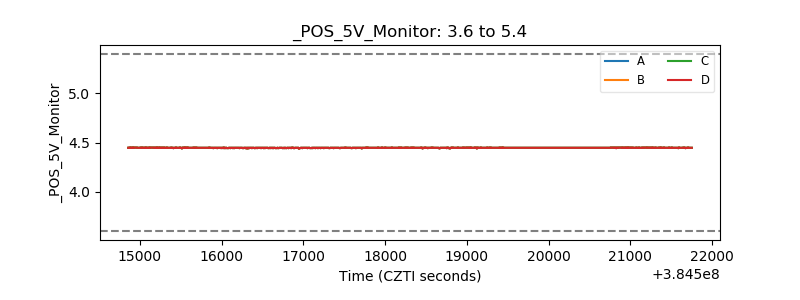 |
| _ROLL_ROT | 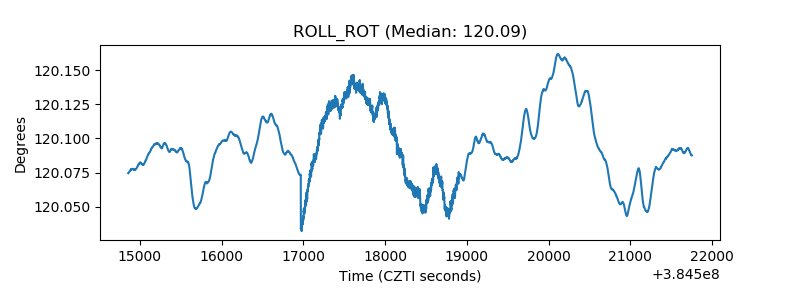 |
| _Roll_DEC | 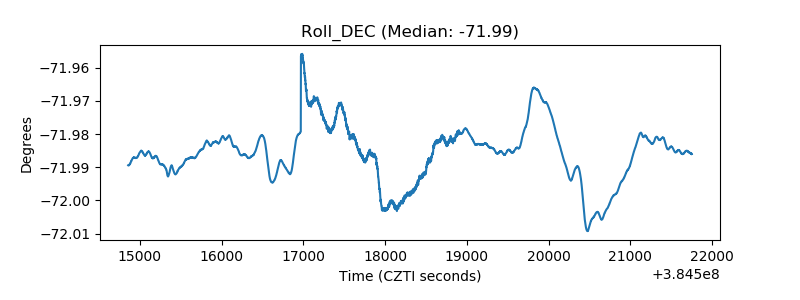 |
| _Roll_RA | 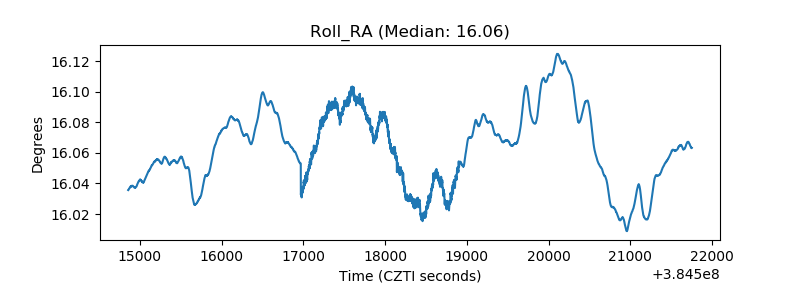 |
| Veto Counter | 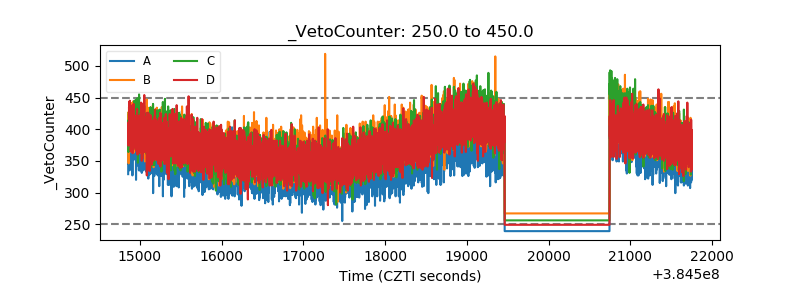 |