| Param | Original file | Final file |
|---|---|---|
| Filename | modeM0/AS1C07_005T01_9000004992_34846cztM0_level2.evt | modeM0/AS1C07_005T01_9000004992_34846cztM0_level2_quad_clean.evt |
| Size (bytes) | 576,933,120 | 99,008,640 |
| Size | 550.2 MB | 94.4 MB |
| Events in quadrant A | 6,628,567 | 604,615 |
| Events in quadrant B | 3,437,617 | 680,505 |
| Events in quadrant C | 3,045,194 | 676,992 |
| Events in quadrant D | 3,978,993 | 641,166 |
| Mode M9 | |||
|---|---|---|---|
| Quadrant | BADHDUFLAG | Total packets | Discarded packets |
| A | 0 | 21 | 0 |
| B | 0 | 21 | 0 |
| C | 0 | 21 | 0 |
| D | 0 | 22 | 0 |
| Mode M0 | |||
|---|---|---|---|
| Quadrant | BADHDUFLAG | Total packets | Discarded packets |
| A | 0 | 23415 | 3 |
| B | 0 | 13857 | 2 |
| C | 0 | 12324 | 2 |
| D | 0 | 15682 | 2 |
| Mode SS | |||
|---|---|---|---|
| Quadrant | BADHDUFLAG | Total packets | Discarded packets |
| A | 0 | 114 | 0 |
| B | 0 | 114 | 0 |
| C | 0 | 114 | 0 |
| D | 0 | 114 | 0 |
| Quadrant | Total seconds | Saturated seconds | Saturation percentage |
|---|---|---|---|
| A | 5642 | 1422 | 25.203828% |
| B | 5642 | 191 | 3.385324% |
| C | 5642 | 98 | 1.736973% |
| D | 5642 | 167 | 2.959943% |
Noise dominated data is calculated using 1-second bins in cleaned event files. If a bin has >2000 counts, and if more than 50% of those come from <1% of pixels, then it is considered to be noise-dominated and hence unusable.
| Quadrant | # 1 sec bins | Bins with >0 counts | Bins with >2000 counts | High rate bins dominated by noise | Noise dominated (total time) | Noise dominated (detector-on time) | Marked lightcurve |
|---|---|---|---|---|---|---|---|
| A | 7134 | 5642 | 1195 | 1195 | 16.75% | 21.18% | 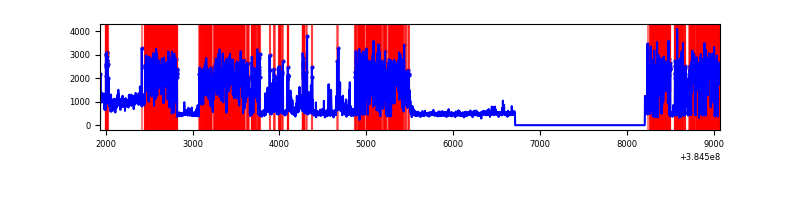 |
| B | 7135 | 5643 | 118 | 118 | 1.65% | 2.09% | 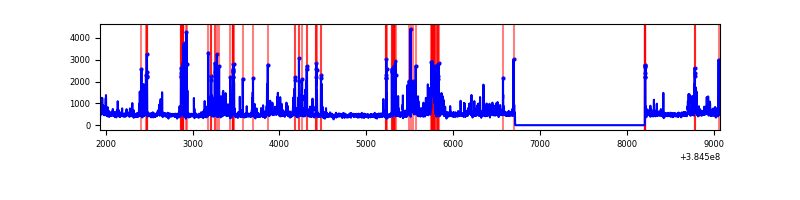 |
| C | 7135 | 5643 | 57 | 57 | 0.80% | 1.01% | 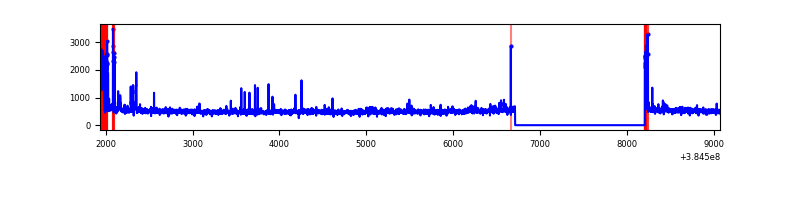 |
| D | 7135 | 5643 | 160 | 160 | 2.24% | 2.84% | 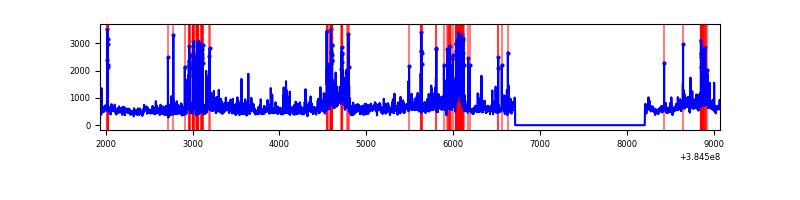 |
Top three noisy pixels from each quadrant. If the there are fewer than three noisy pixels in the level2.evt file, extra rows are filled as -1
| Pixel properties | Quadrant properties | ||||||
|---|---|---|---|---|---|---|---|
| Quadrant | DetID | PixID | Counts | Sigma | Mean | Median | Sigma |
| A | 15 | 169 | 4210871 | 35291.01 | 597 | 583 | 119.3 |
| A | 10 | 83 | 48983 | 405.69 | 597 | 583 | 119.3 |
| A | 15 | 237 | 24022 | 196.46 | 597 | 583 | 119.3 |
| B | 5 | 172 | 544403 | 4466.49 | 638 | 621 | 121.7 |
| B | 4 | 232 | 109492 | 894.24 | 638 | 621 | 121.7 |
| B | 5 | 255 | 78240 | 637.54 | 638 | 621 | 121.7 |
| C | 15 | 214 | 262574 | 1814.71 | 625 | 630 | 144.3 |
| C | 0 | 10 | 187827 | 1296.87 | 625 | 630 | 144.3 |
| C | 0 | 207 | 64806 | 444.6 | 625 | 630 | 144.3 |
| D | 8 | 195 | 601827 | 3913.06 | 627 | 609 | 153.6 |
| D | 12 | 6 | 255239 | 1657.27 | 627 | 609 | 153.6 |
| D | 12 | 233 | 122089 | 790.66 | 627 | 609 | 153.6 |
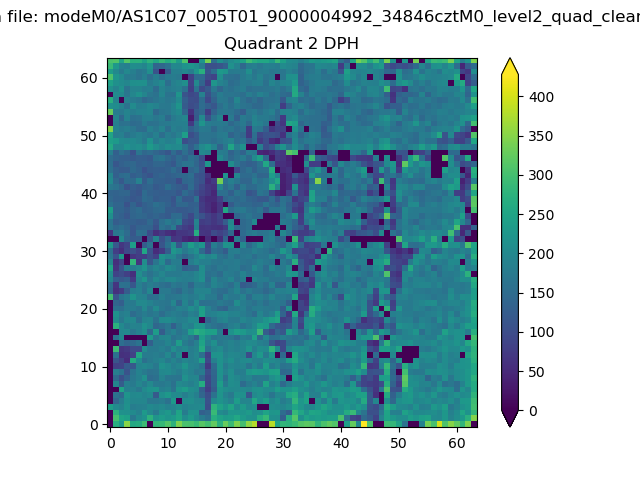
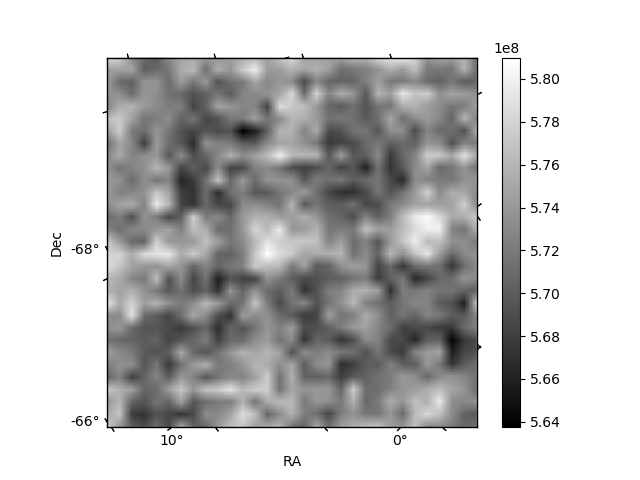
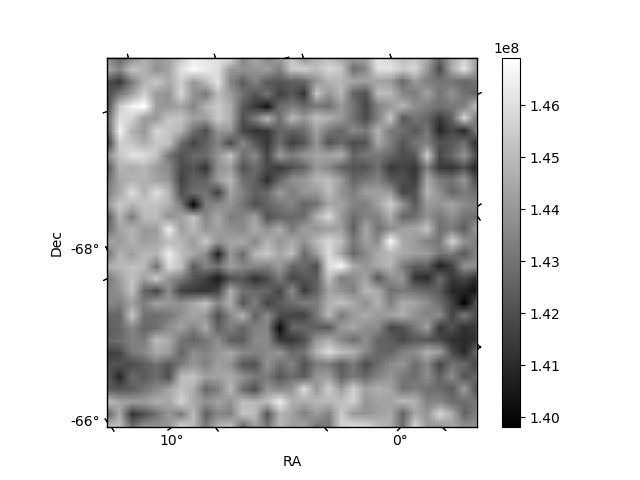
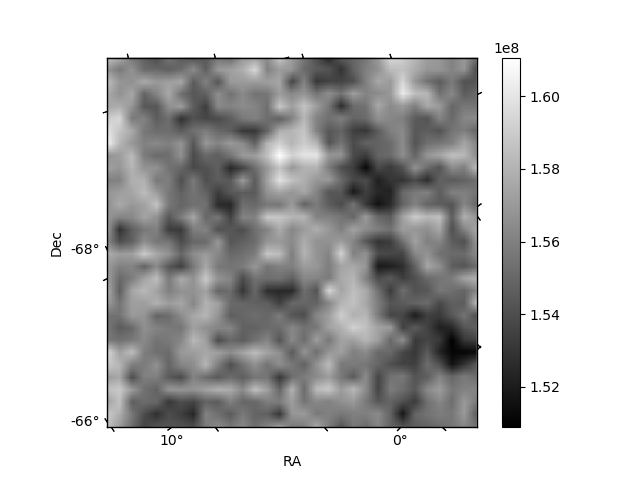
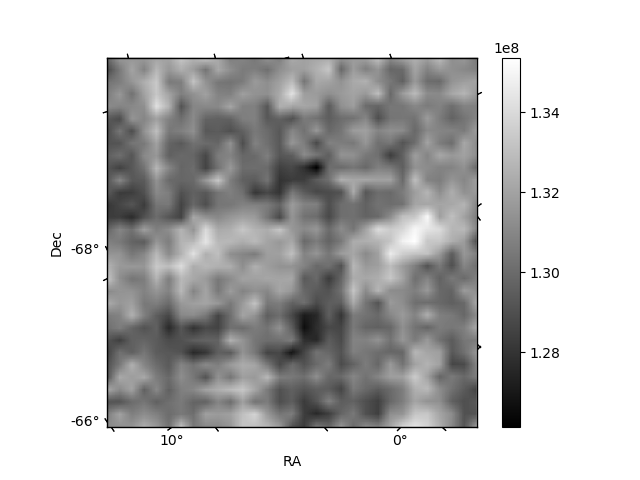
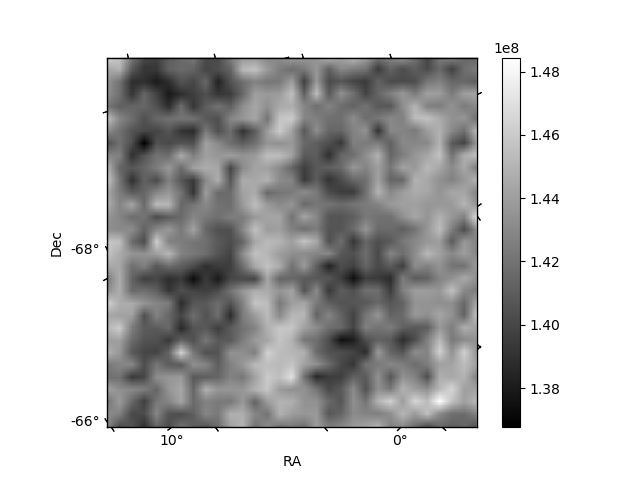
Histogram calculated using DETX and DETY for each event in the final _common_clean file
| Quadrant A | 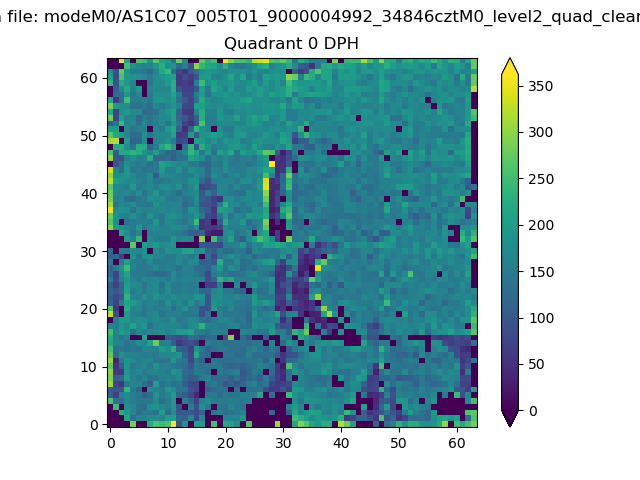 |
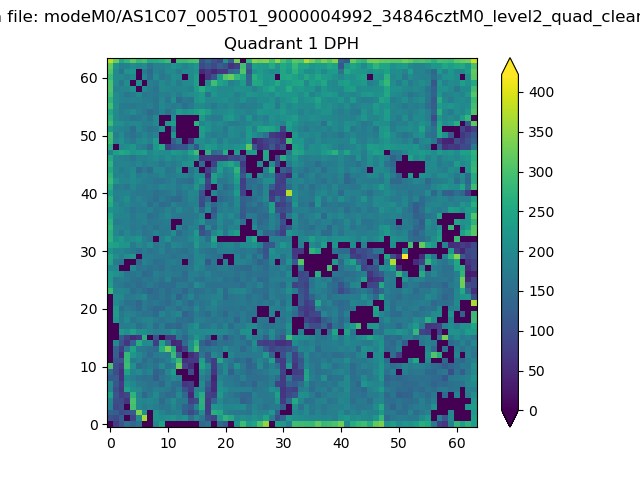 |
Quadrant B |
|---|---|---|---|
| Quadrant D | 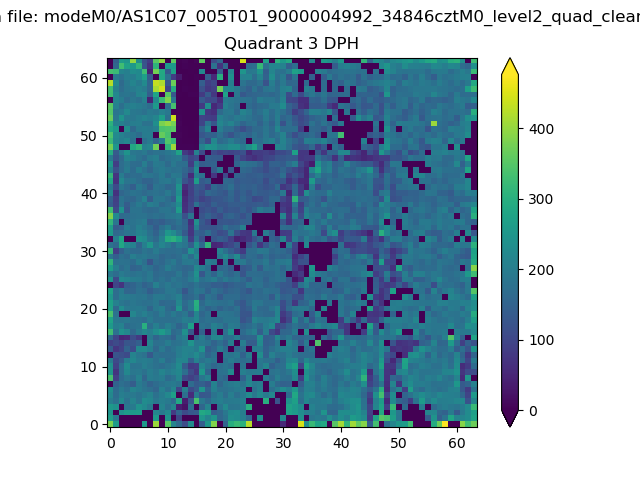 |
 |
Quadrant C |
| Plot type | Count rate plots | Images |
|---|---|---|
| Comparison with Poisson distribution Blue bars denote a histogram of data divided into 1 sec bins. Red curve is a Poisson curve with rate = median count rate of data. |
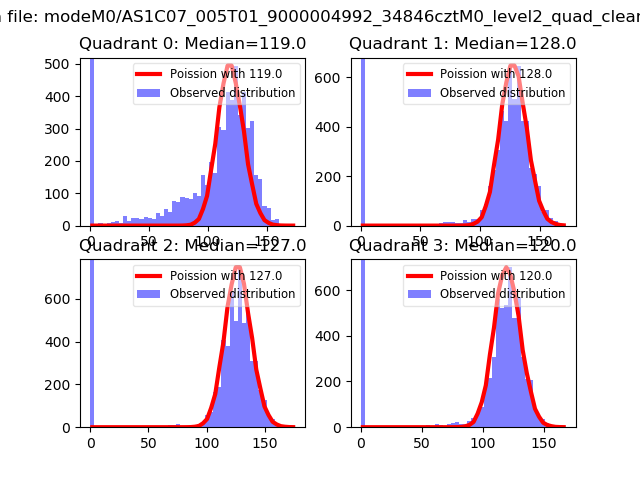 |
 |
| Quadrant-wise count rates Data is divided into 100 sec bins |
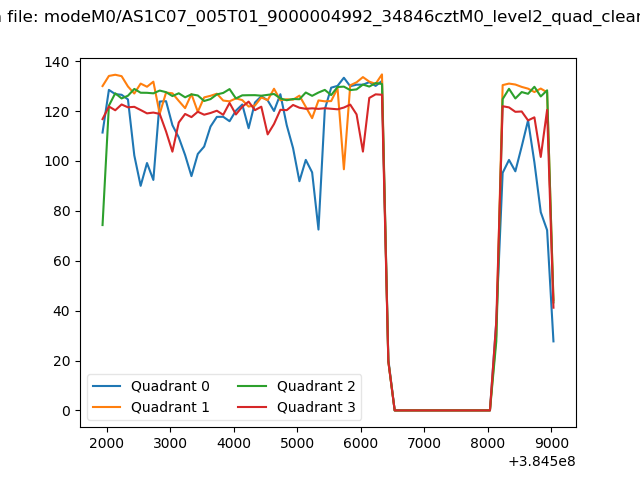 |
|
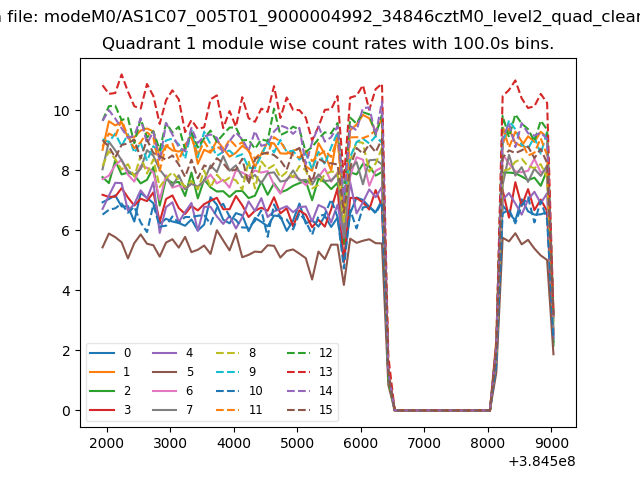
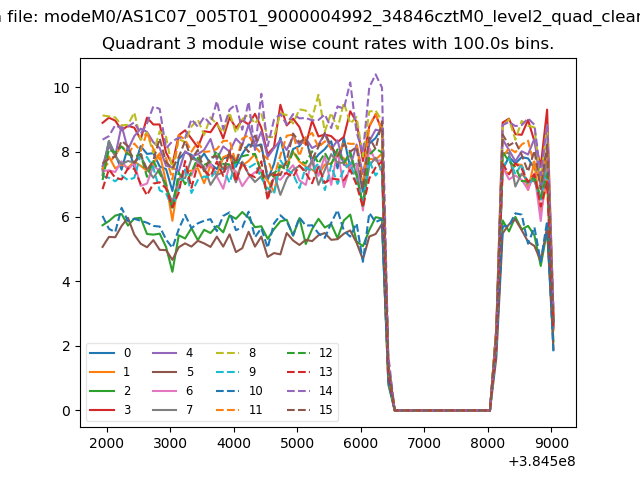
| Module-wise count rates for Quadrant A Data is divided into 100 sec bins |
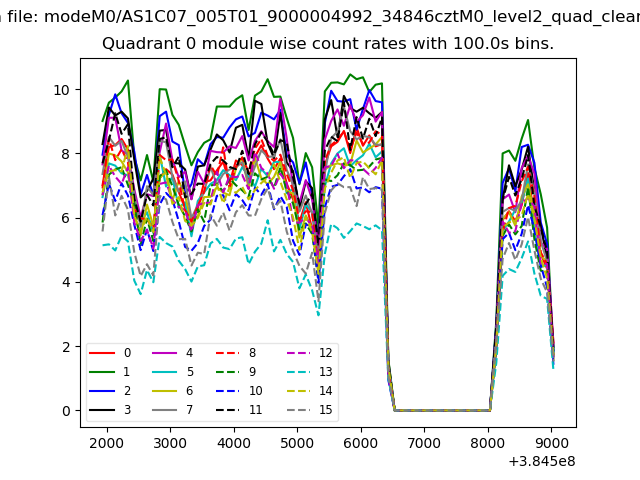 |
 |
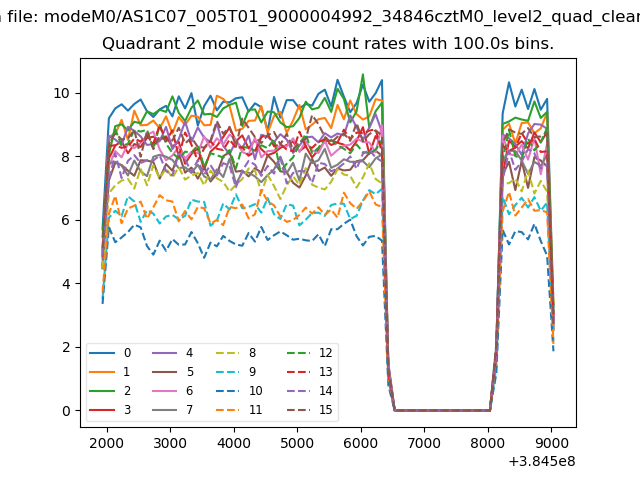
| Module-wise count rates for Quadrant B Data is divided into 100 sec bins |
 |
 |
| Module-wise count rates for Quadrant C Data is divided into 100 sec bins |
 |
 |
| Module-wise count rates for Quadrant D Data is divided into 100 sec bins |
 |
 |
| Parameter | Plot |
|---|---|
| CZT HV Monitor |  |
| D_VDD | 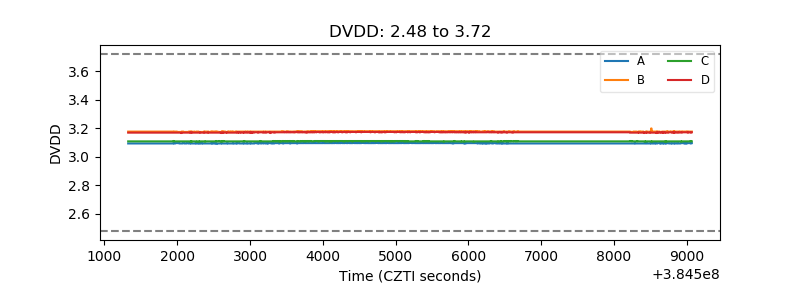 |
| Temperature 1 | 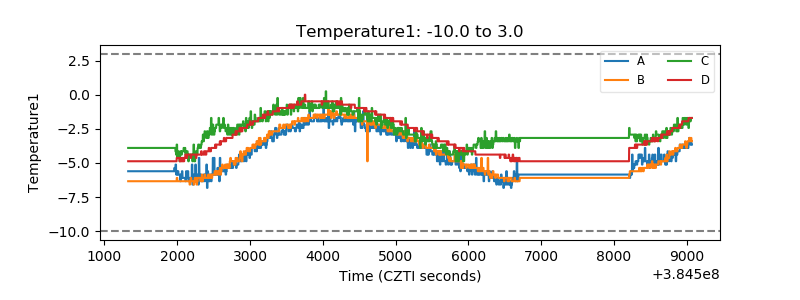 |
| Veto HV Monitor | 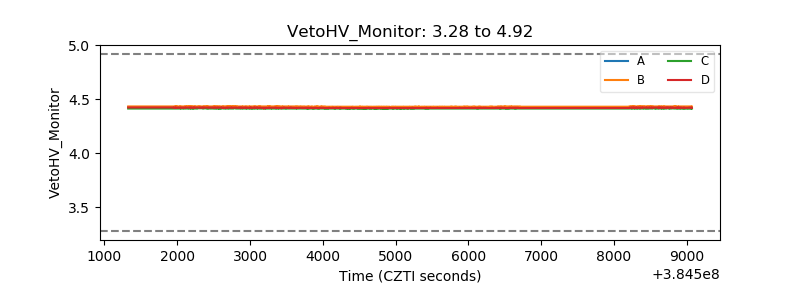 |
| Veto LLD | 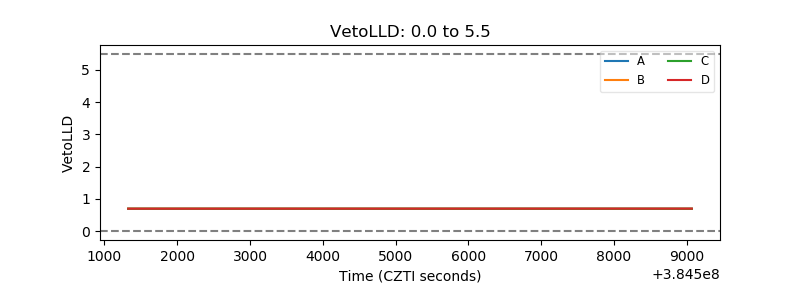 |
| Alpha Counter | 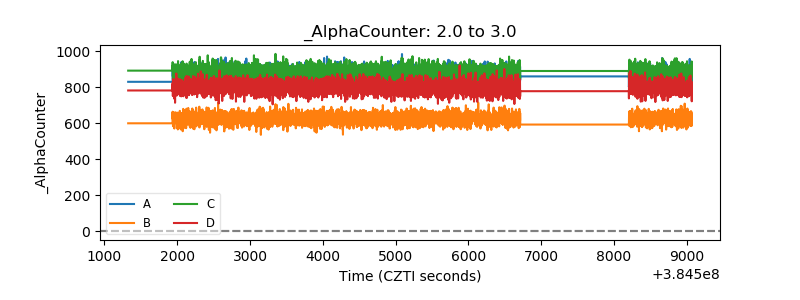 |
| _CPM_Rate | 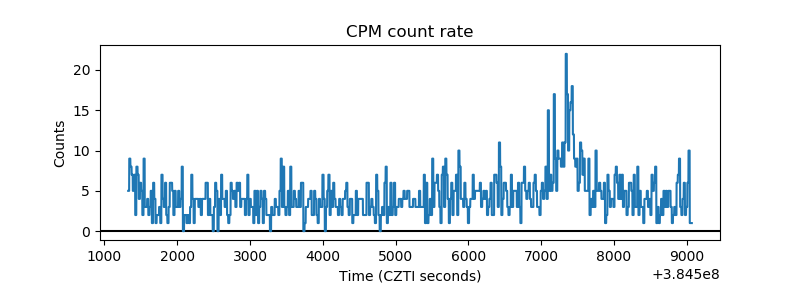 |
| CZT Counter | 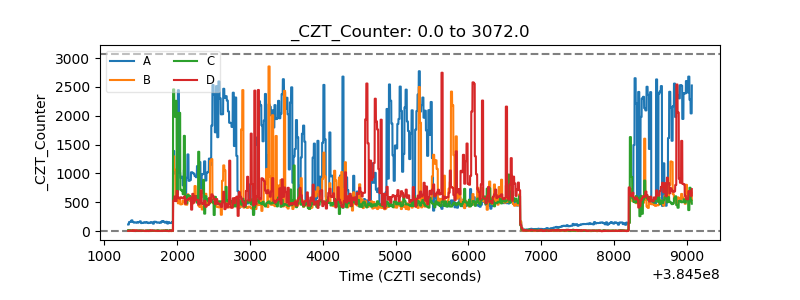 |
| +2.5 Volts monitor | 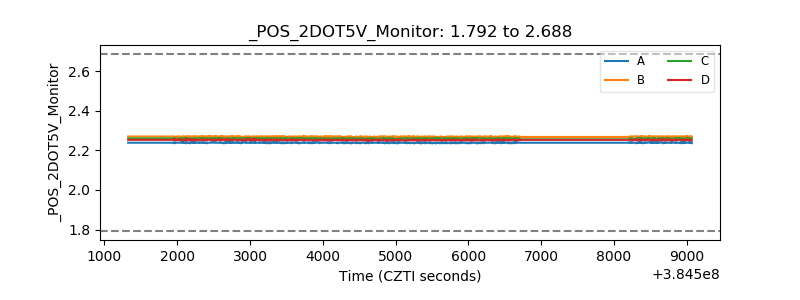 |
| +5 Volts monitor | 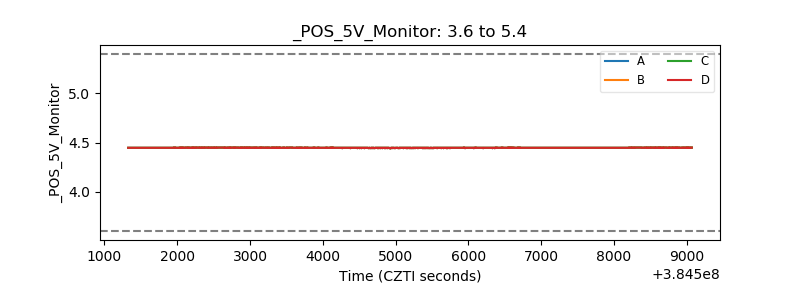 |
| _ROLL_ROT | 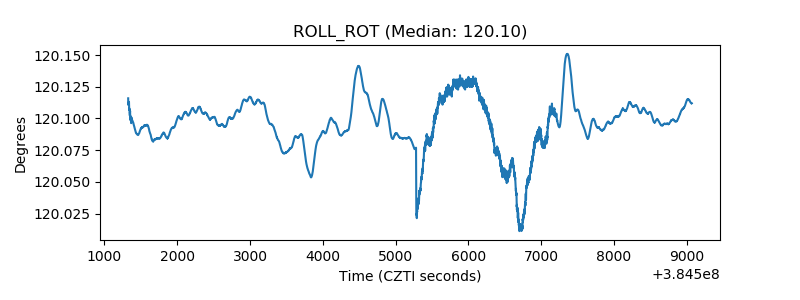 |
| _Roll_DEC | 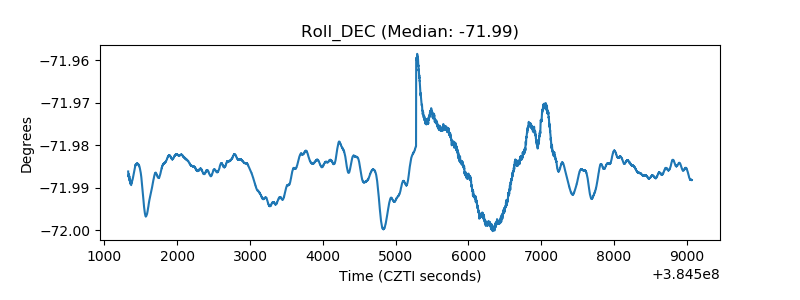 |
| _Roll_RA | 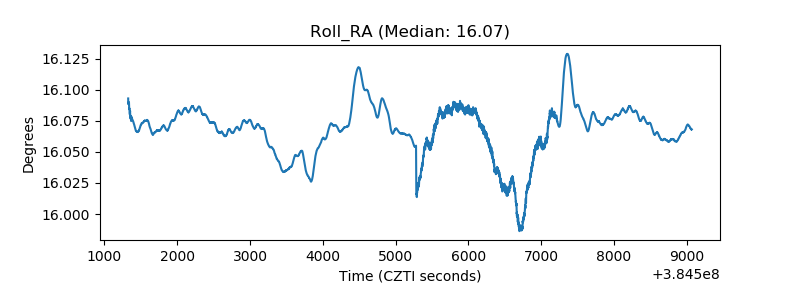 |
| Veto Counter | 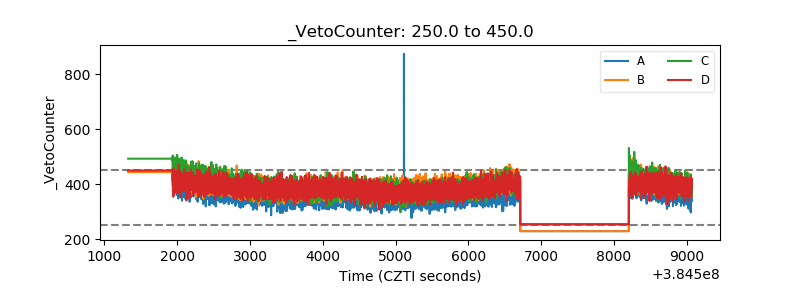 |