| Param | Original file | Final file |
|---|---|---|
| Filename | modeM0/AS1C07_005T01_9000004992_34845cztM0_level2.evt | modeM0/AS1C07_005T01_9000004992_34845cztM0_level2_quad_clean.evt |
| Size (bytes) | 675,486,720 | 95,883,840 |
| Size | 644.2 MB | 91.4 MB |
| Events in quadrant A | 10,398,108 | 512,778 |
| Events in quadrant B | 3,179,939 | 690,785 |
| Events in quadrant C | 3,054,599 | 680,092 |
| Events in quadrant D | 3,468,725 | 650,259 |
| Mode M9 | |||
|---|---|---|---|
| Quadrant | BADHDUFLAG | Total packets | Discarded packets |
| A | 0 | 32 | 0 |
| B | 0 | 32 | 0 |
| C | 0 | 32 | 0 |
| D | 0 | 33 | 0 |
| Mode M0 | |||
|---|---|---|---|
| Quadrant | BADHDUFLAG | Total packets | Discarded packets |
| A | 0 | 34497 | 3 |
| B | 0 | 12834 | 2 |
| C | 0 | 12047 | 2 |
| D | 0 | 13756 | 2 |
| Mode SS | |||
|---|---|---|---|
| Quadrant | BADHDUFLAG | Total packets | Discarded packets |
| A | 0 | 106 | 0 |
| B | 0 | 106 | 0 |
| C | 0 | 106 | 0 |
| D | 0 | 106 | 0 |
| Quadrant | Total seconds | Saturated seconds | Saturation percentage |
|---|---|---|---|
| A | 5261 | 3530 | 67.097510% |
| B | 5261 | 148 | 2.813153% |
| C | 5261 | 142 | 2.699107% |
| D | 5261 | 101 | 1.919787% |
Noise dominated data is calculated using 1-second bins in cleaned event files. If a bin has >2000 counts, and if more than 50% of those come from <1% of pixels, then it is considered to be noise-dominated and hence unusable.
| Quadrant | # 1 sec bins | Bins with >0 counts | Bins with >2000 counts | High rate bins dominated by noise | Noise dominated (total time) | Noise dominated (detector-on time) | Marked lightcurve |
|---|---|---|---|---|---|---|---|
| A | 7085 | 5261 | 2827 | 2827 | 39.90% | 53.74% | 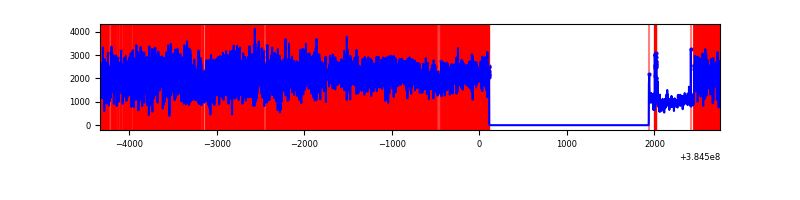 |
| B | 7085 | 5262 | 87 | 87 | 1.23% | 1.65% | 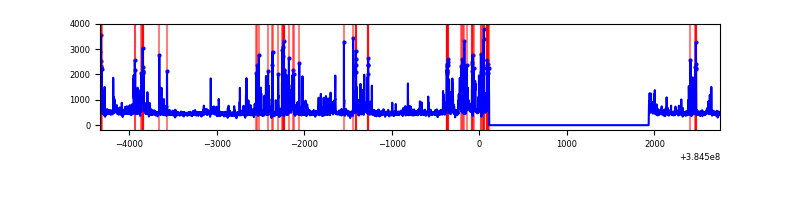 |
| C | 7085 | 5262 | 96 | 96 | 1.35% | 1.82% | 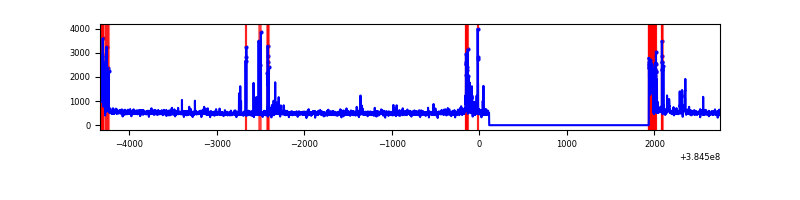 |
| D | 7085 | 5262 | 119 | 119 | 1.68% | 2.26% | 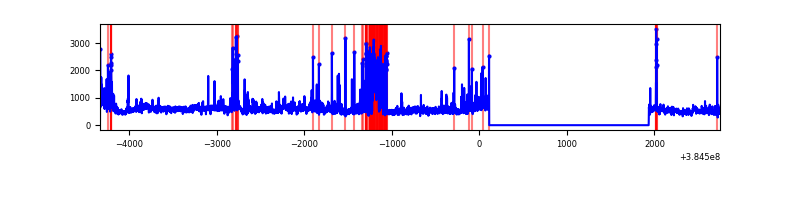 |
Top three noisy pixels from each quadrant. If the there are fewer than three noisy pixels in the level2.evt file, extra rows are filled as -1
| Pixel properties | Quadrant properties | ||||||
|---|---|---|---|---|---|---|---|
| Quadrant | DetID | PixID | Counts | Sigma | Mean | Median | Sigma |
| A | 15 | 169 | 8439586 | 85491.49 | 490 | 480 | 98.7 |
| A | 10 | 83 | 46634 | 467.56 | 490 | 480 | 98.7 |
| A | 7 | 3 | 8267 | 78.89 | 490 | 480 | 98.7 |
| B | 5 | 172 | 549548 | 4818.64 | 604 | 588 | 113.9 |
| B | 5 | 255 | 73973 | 644.16 | 604 | 588 | 113.9 |
| B | 4 | 171 | 54283 | 471.32 | 604 | 588 | 113.9 |
| C | 0 | 10 | 293646 | 2143.22 | 592 | 596 | 136.7 |
| C | 15 | 214 | 243633 | 1777.45 | 592 | 596 | 136.7 |
| C | 0 | 207 | 169656 | 1236.42 | 592 | 596 | 136.7 |
| D | 8 | 195 | 733442 | 4929.15 | 599 | 583 | 148.7 |
| D | 12 | 6 | 55198 | 367.34 | 599 | 583 | 148.7 |
| D | 2 | 250 | 54986 | 365.91 | 599 | 583 | 148.7 |
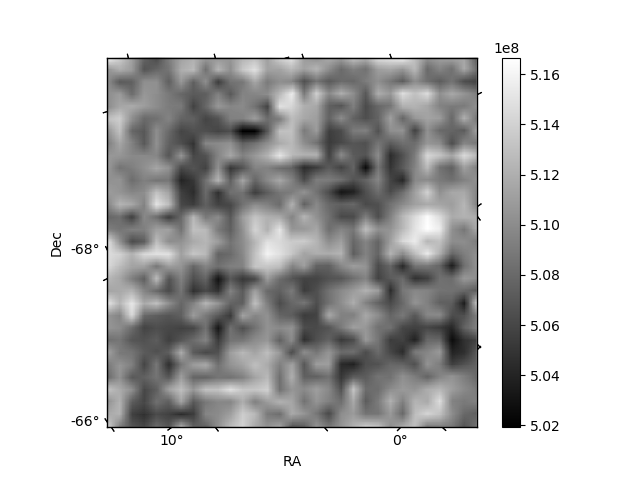
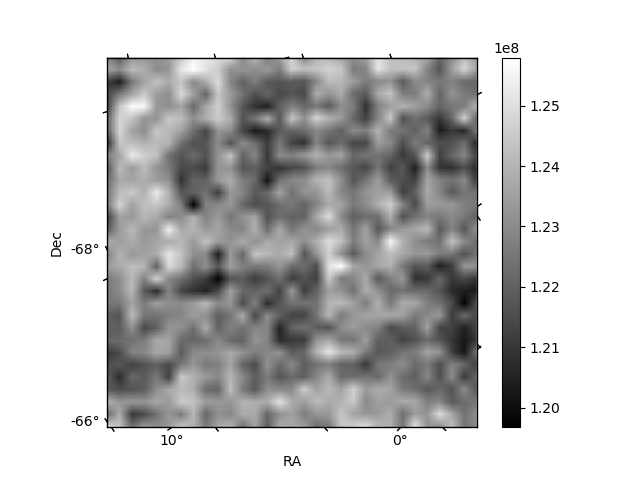
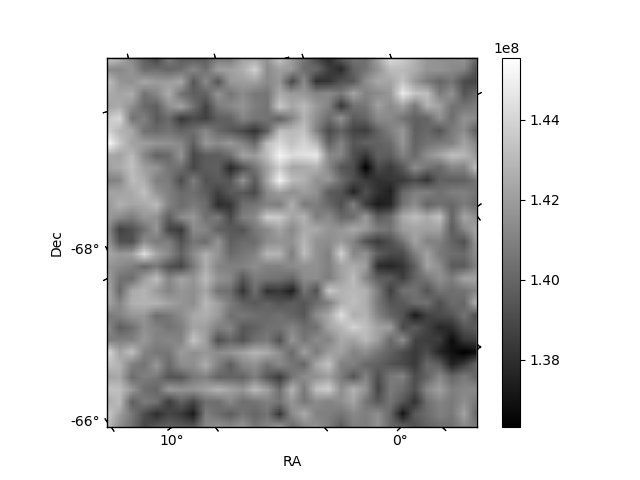
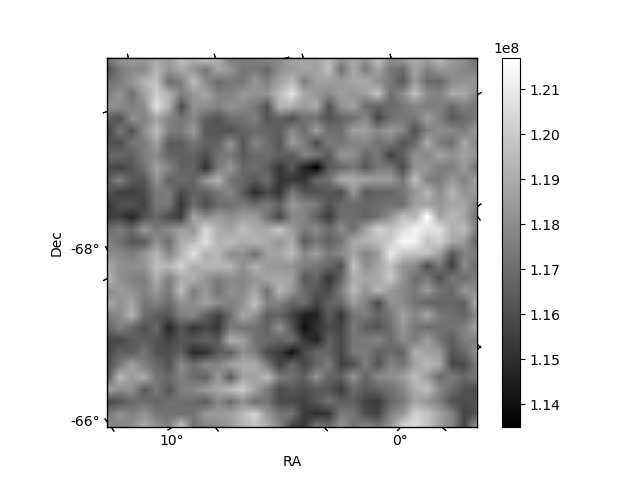
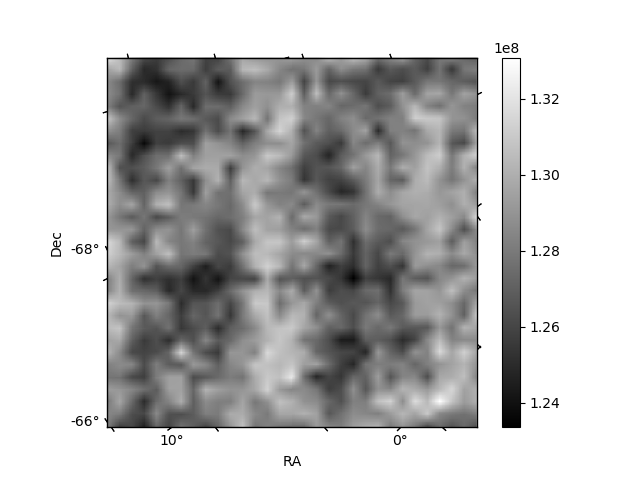
Histogram calculated using DETX and DETY for each event in the final _common_clean file
| Quadrant A | 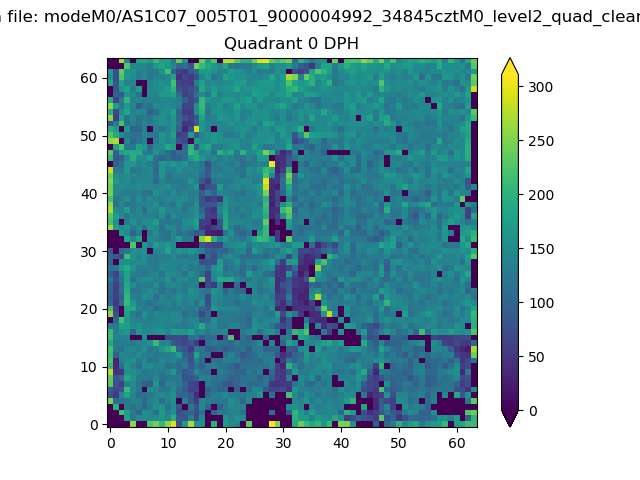 |
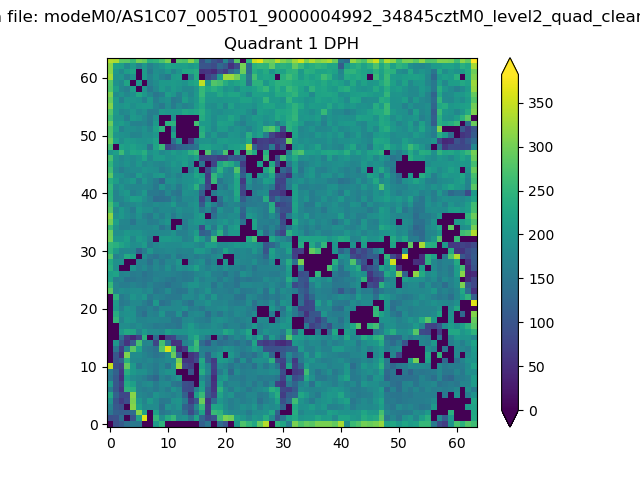 |
Quadrant B |
|---|---|---|---|
| Quadrant D | 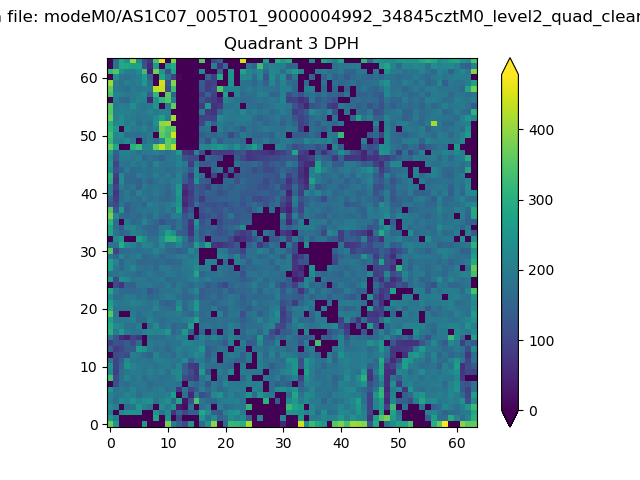 |
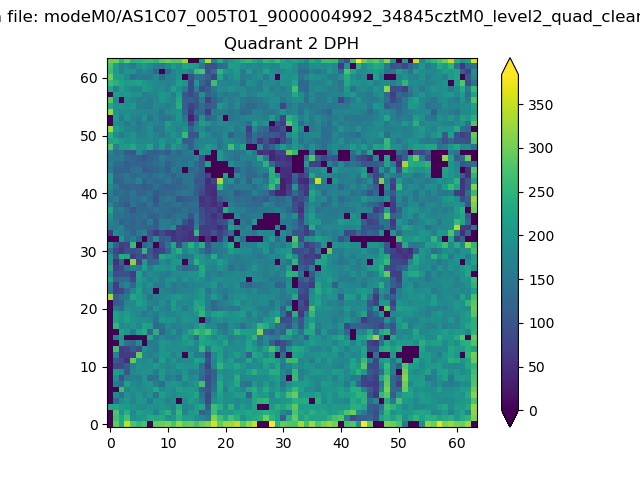 |
Quadrant C |
| Plot type | Count rate plots | Images |
|---|---|---|
| Comparison with Poisson distribution Blue bars denote a histogram of data divided into 1 sec bins. Red curve is a Poisson curve with rate = median count rate of data. |
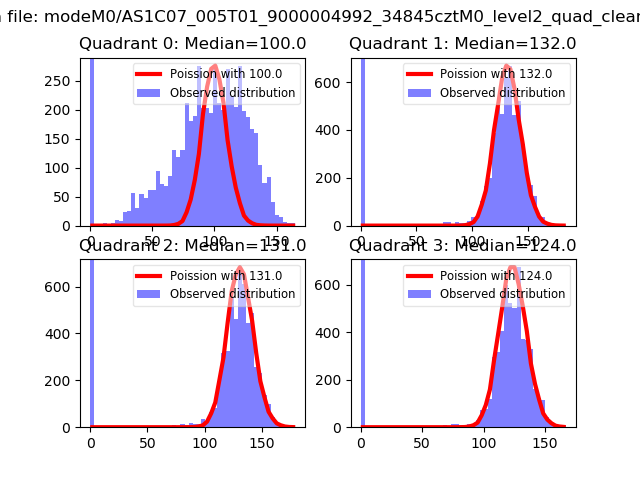 |
 |
| Quadrant-wise count rates Data is divided into 100 sec bins |
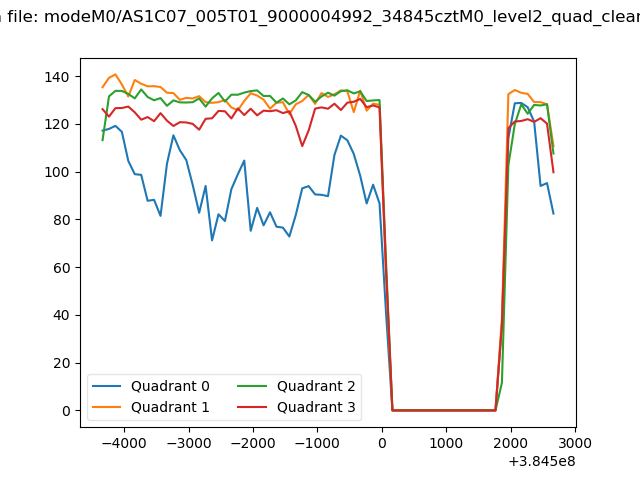 |
|
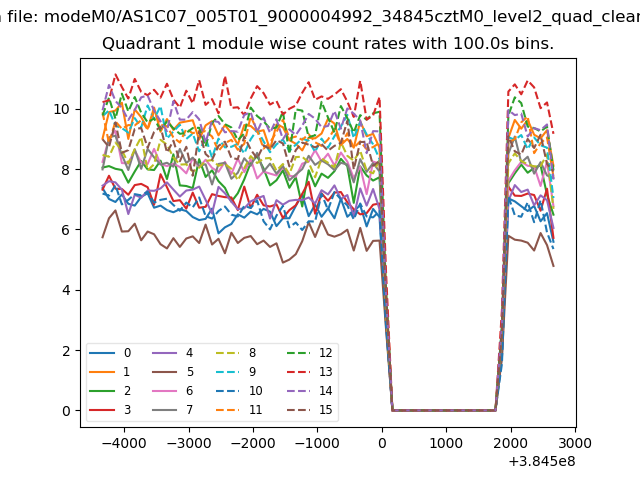
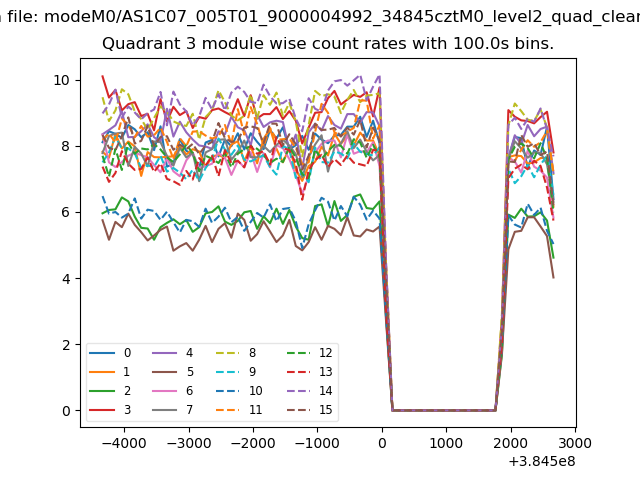
| Module-wise count rates for Quadrant A Data is divided into 100 sec bins |
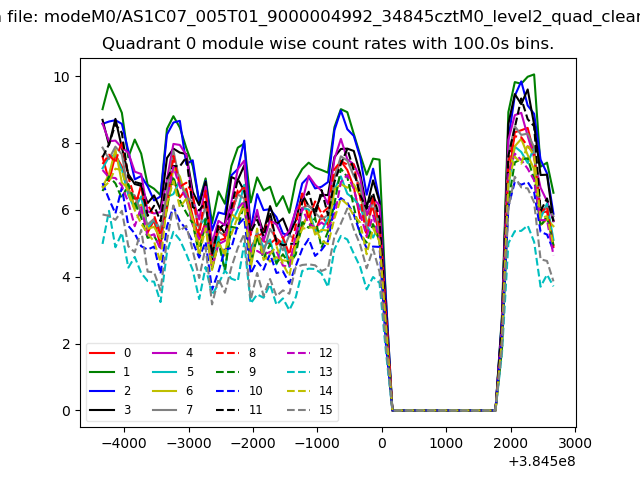 |
 |
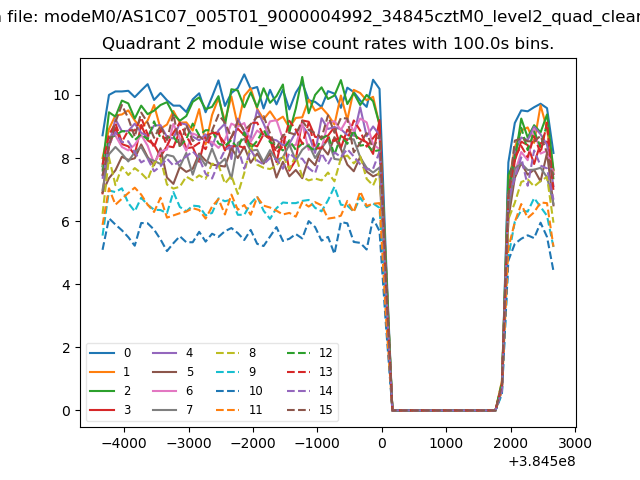
| Module-wise count rates for Quadrant B Data is divided into 100 sec bins |
 |
 |
| Module-wise count rates for Quadrant C Data is divided into 100 sec bins |
 |
 |
| Module-wise count rates for Quadrant D Data is divided into 100 sec bins |
 |
 |
| Parameter | Plot |
|---|---|
| CZT HV Monitor | 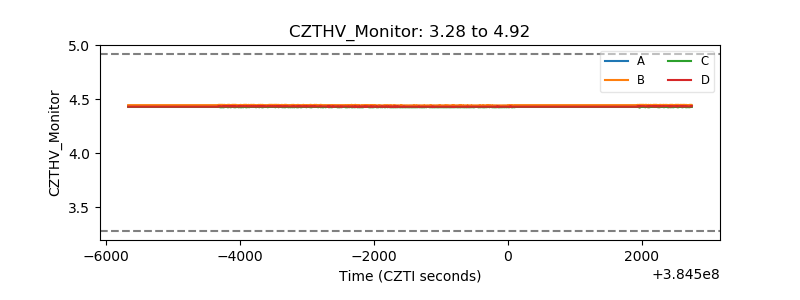 |
| D_VDD | 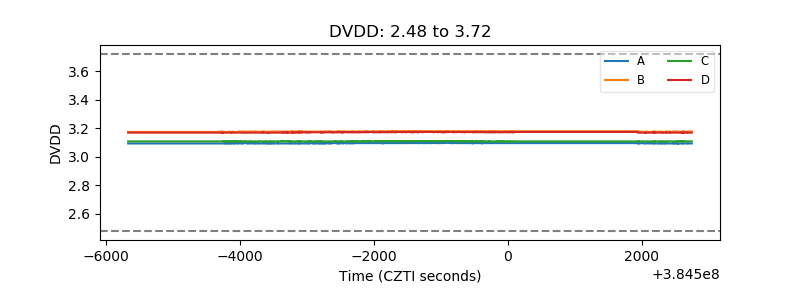 |
| Temperature 1 | 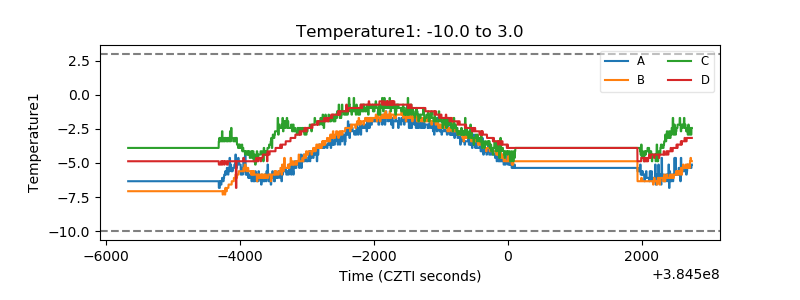 |
| Veto HV Monitor | 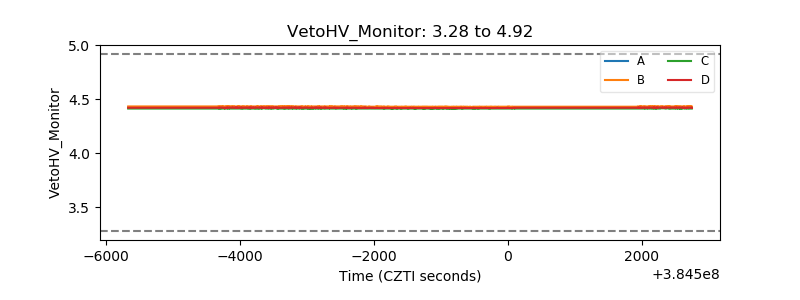 |
| Veto LLD | 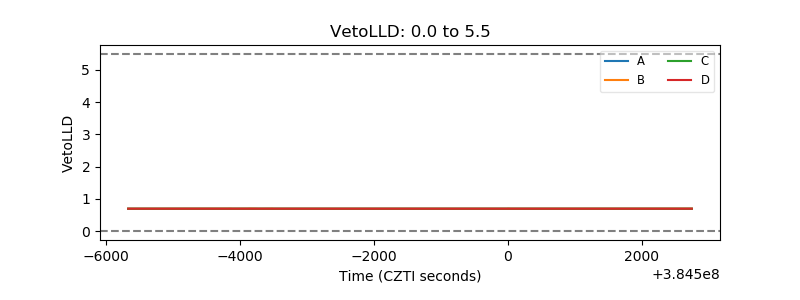 |
| Alpha Counter | 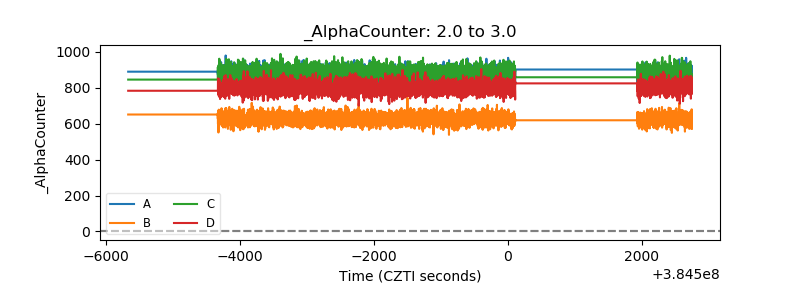 |
| _CPM_Rate | 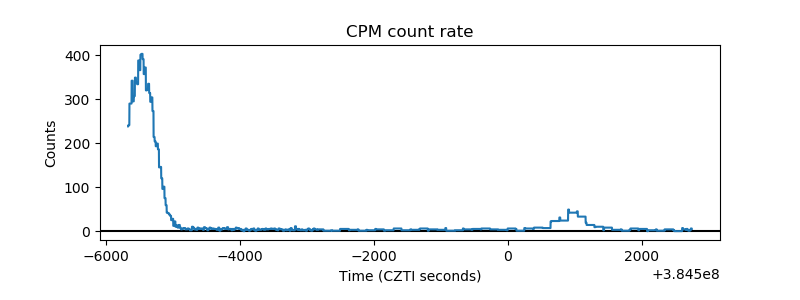 |
| CZT Counter | 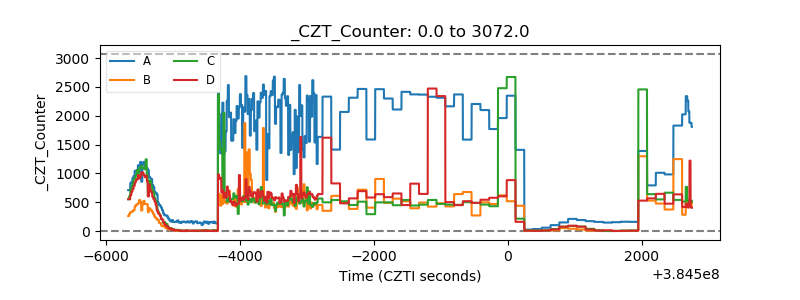 |
| +2.5 Volts monitor | 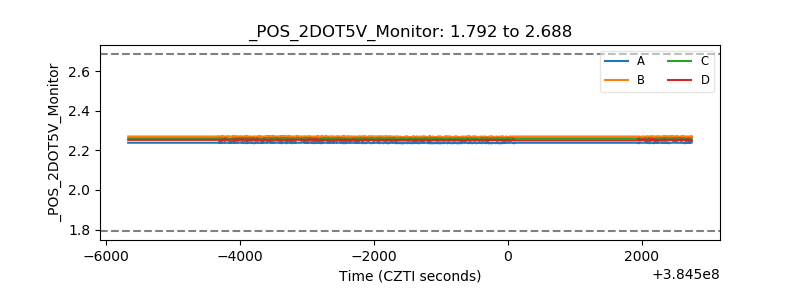 |
| +5 Volts monitor | 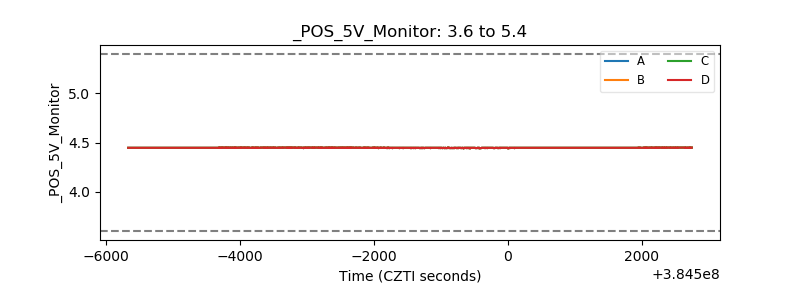 |
| _ROLL_ROT | 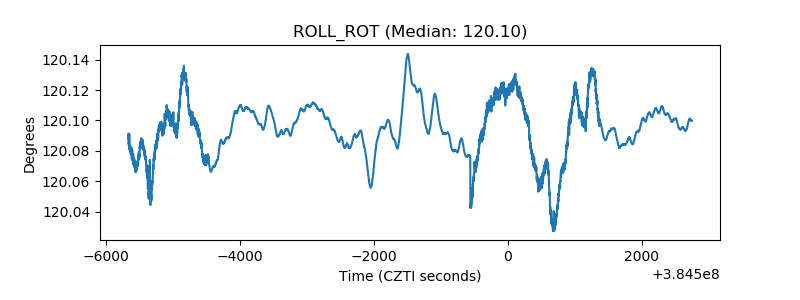 |
| _Roll_DEC | 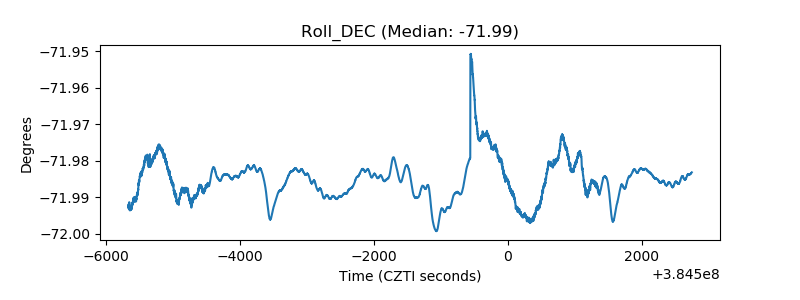 |
| _Roll_RA | 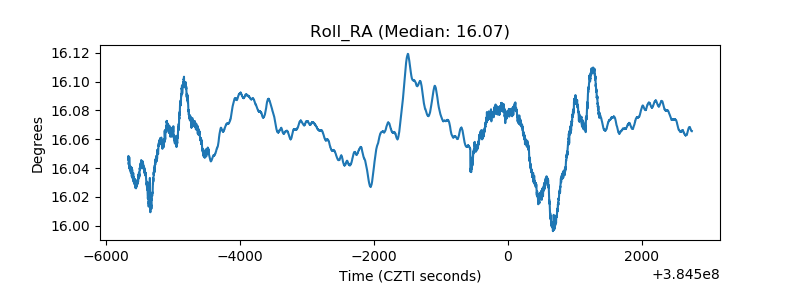 |
| Veto Counter | 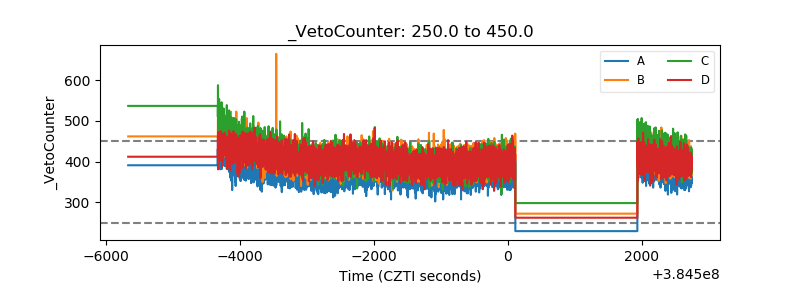 |