| Param | Original file | Final file |
|---|---|---|
| Filename | modeM0/AS1C07_005T01_9000004992_34844cztM0_level2.evt | modeM0/AS1C07_005T01_9000004992_34844cztM0_level2_quad_clean.evt |
| Size (bytes) | 670,066,560 | 84,280,320 |
| Size | 639.0 MB | 80.4 MB |
| Events in quadrant A | 10,760,031 | 282,860 |
| Events in quadrant B | 3,157,932 | 658,494 |
| Events in quadrant C | 2,700,720 | 655,418 |
| Events in quadrant D | 3,351,854 | 619,258 |
| Mode M9 | |||
|---|---|---|---|
| Quadrant | BADHDUFLAG | Total packets | Discarded packets |
| A | 0 | 21 | 0 |
| B | 0 | 21 | 0 |
| C | 0 | 21 | 0 |
| D | 0 | 21 | 0 |
| Mode M0 | |||
|---|---|---|---|
| Quadrant | BADHDUFLAG | Total packets | Discarded packets |
| A | 0 | 35190 | 3 |
| B | 0 | 12357 | 1 |
| C | 0 | 10599 | 1 |
| D | 0 | 13269 | 1 |
| Mode SS | |||
|---|---|---|---|
| Quadrant | BADHDUFLAG | Total packets | Discarded packets |
| A | 0 | 96 | 0 |
| B | 0 | 96 | 0 |
| C | 0 | 96 | 0 |
| D | 0 | 96 | 0 |
| Quadrant | Total seconds | Saturated seconds | Saturation percentage |
|---|---|---|---|
| A | 4764 | 4192 | 87.993283% |
| B | 4764 | 219 | 4.596977% |
| C | 4764 | 44 | 0.923594% |
| D | 4764 | 112 | 2.350966% |
Noise dominated data is calculated using 1-second bins in cleaned event files. If a bin has >2000 counts, and if more than 50% of those come from <1% of pixels, then it is considered to be noise-dominated and hence unusable.
| Quadrant | # 1 sec bins | Bins with >0 counts | Bins with >2000 counts | High rate bins dominated by noise | Noise dominated (total time) | Noise dominated (detector-on time) | Marked lightcurve |
|---|---|---|---|---|---|---|---|
| A | 6828 | 4763 | 3798 | 3798 | 55.62% | 79.74% | 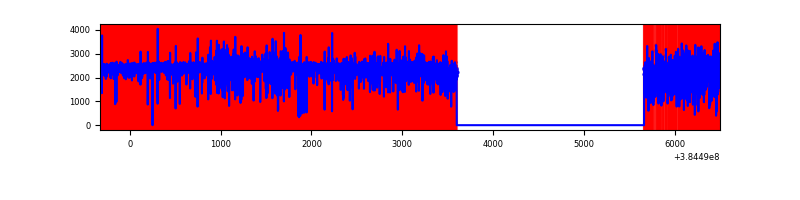 |
| B | 6829 | 4766 | 161 | 161 | 2.36% | 3.38% | 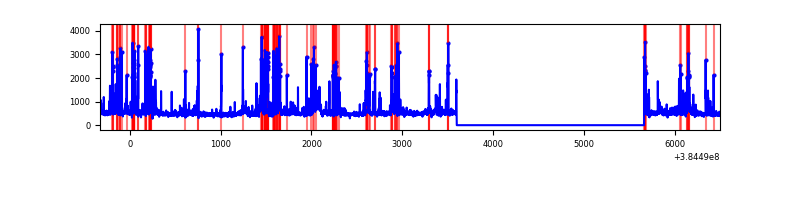 |
| C | 6829 | 4766 | 35 | 35 | 0.51% | 0.73% | 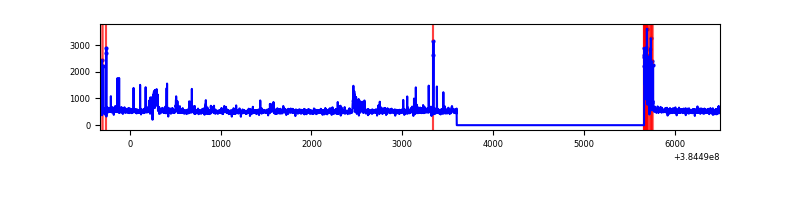 |
| D | 6829 | 4766 | 97 | 97 | 1.42% | 2.04% | 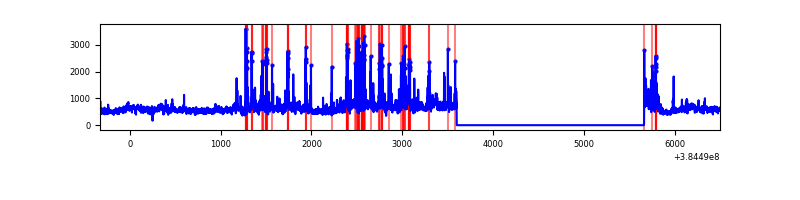 |
Top three noisy pixels from each quadrant. If the there are fewer than three noisy pixels in the level2.evt file, extra rows are filled as -1
| Pixel properties | Quadrant properties | ||||||
|---|---|---|---|---|---|---|---|
| Quadrant | DetID | PixID | Counts | Sigma | Mean | Median | Sigma |
| A | 15 | 169 | 9624348 | 167276.99 | 283 | 277 | 57.5 |
| A | 10 | 83 | 23368 | 401.35 | 283 | 277 | 57.5 |
| A | 13 | 254 | 4636 | 75.76 | 283 | 277 | 57.5 |
| B | 5 | 172 | 697559 | 6708.68 | 561 | 549 | 103.9 |
| B | 5 | 255 | 124278 | 1190.88 | 561 | 549 | 103.9 |
| B | 0 | 190 | 66769 | 637.36 | 561 | 549 | 103.9 |
| C | 15 | 214 | 217208 | 1702.31 | 562 | 567 | 127.3 |
| C | 0 | 10 | 143414 | 1122.46 | 562 | 567 | 127.3 |
| C | 8 | 111 | 56109 | 436.44 | 562 | 567 | 127.3 |
| D | 8 | 195 | 568835 | 4171.15 | 559 | 546 | 136.2 |
| D | 13 | 249 | 167015 | 1221.86 | 559 | 546 | 136.2 |
| D | 2 | 249 | 145673 | 1065.21 | 559 | 546 | 136.2 |
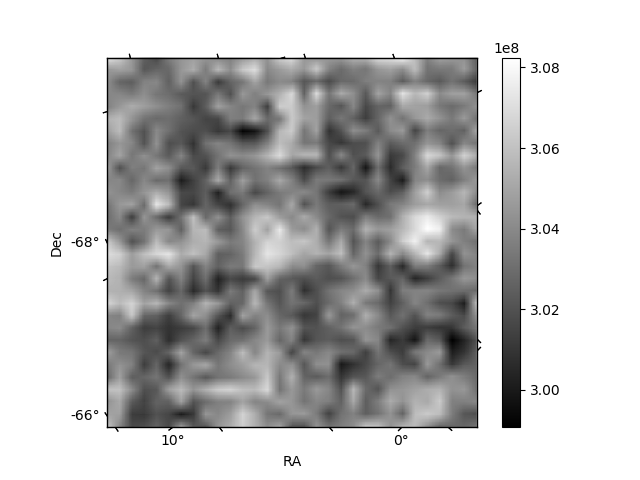
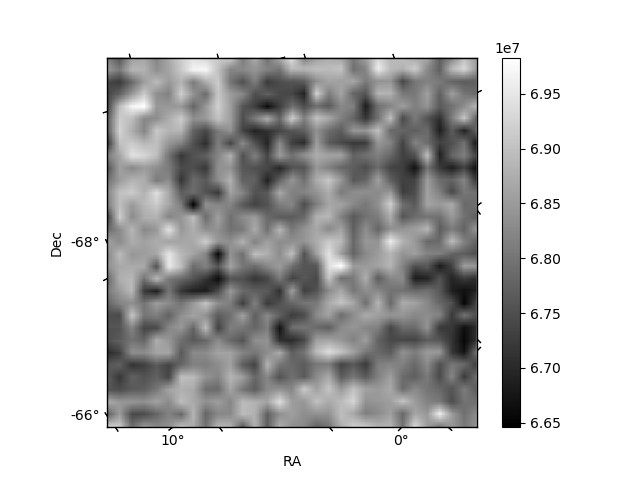
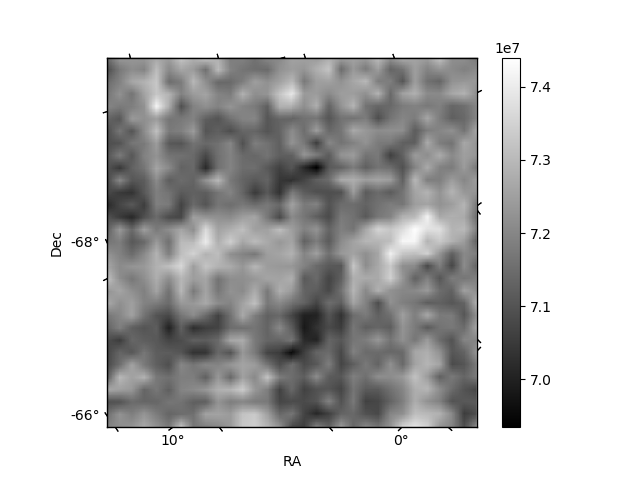
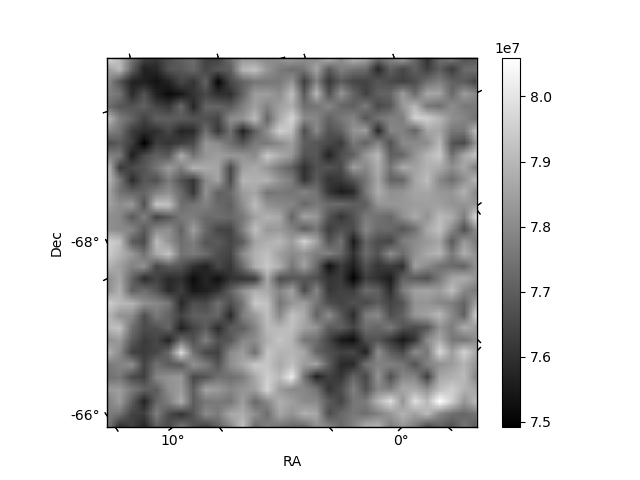
Histogram calculated using DETX and DETY for each event in the final _common_clean file
| Quadrant A | 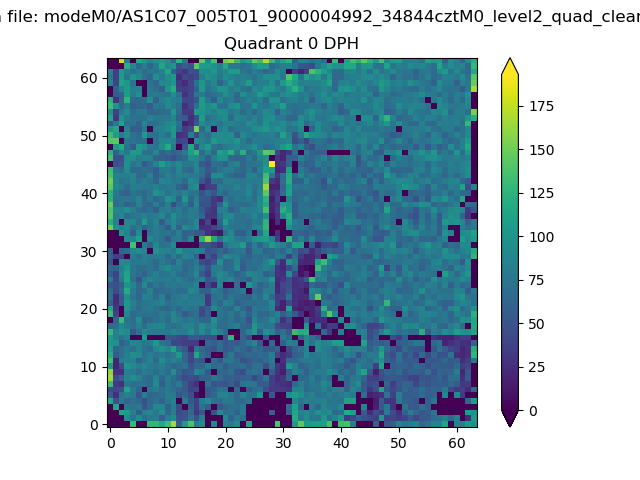 |
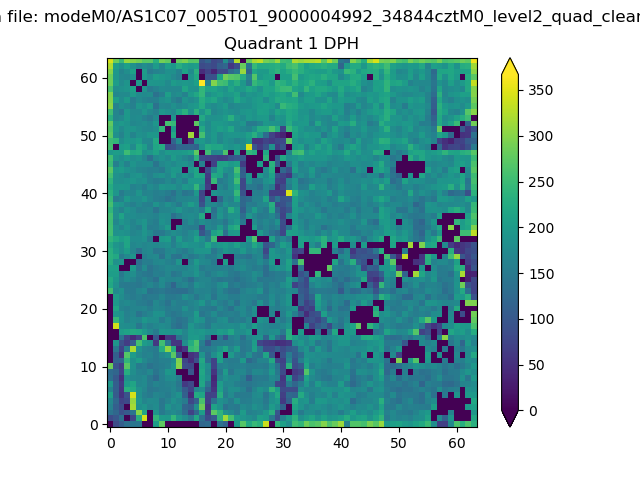 |
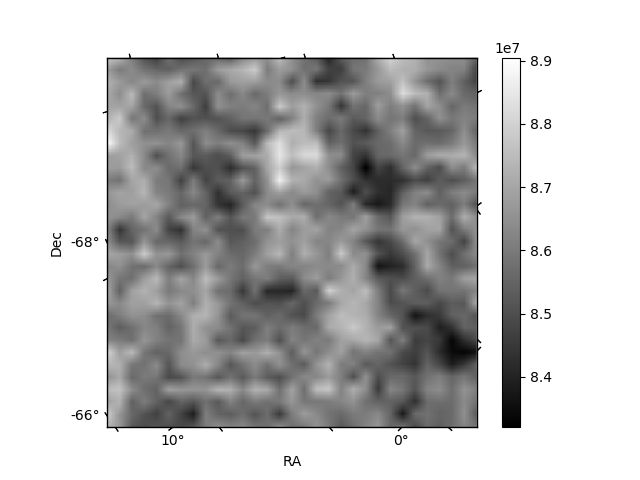
Quadrant B |
|---|---|---|---|
| Quadrant D | 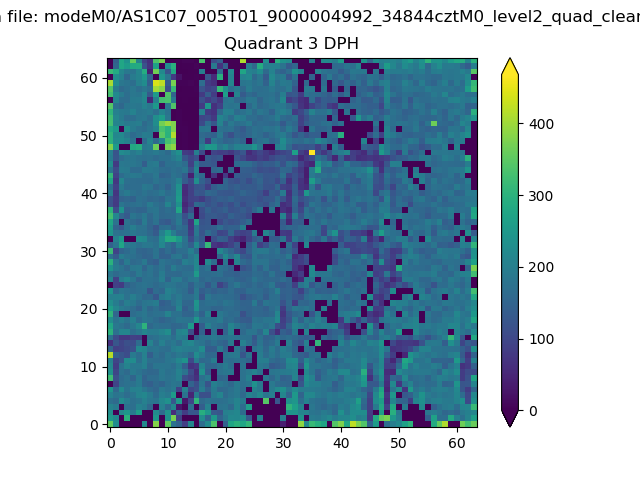 |
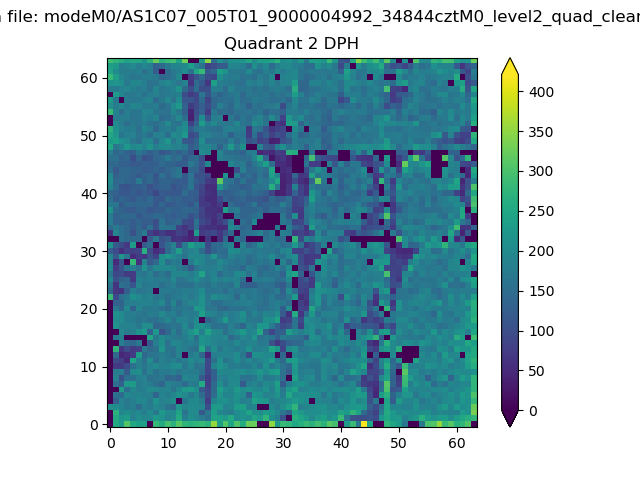 |
Quadrant C |
| Plot type | Count rate plots | Images |
|---|---|---|
| Comparison with Poisson distribution Blue bars denote a histogram of data divided into 1 sec bins. Red curve is a Poisson curve with rate = median count rate of data. |
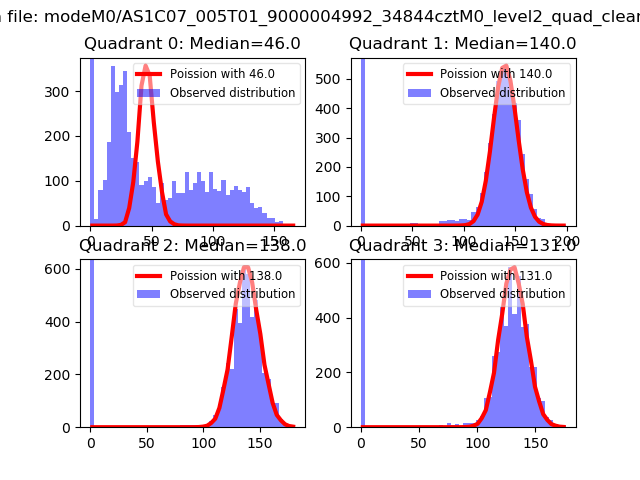 |
 |
| Quadrant-wise count rates Data is divided into 100 sec bins |
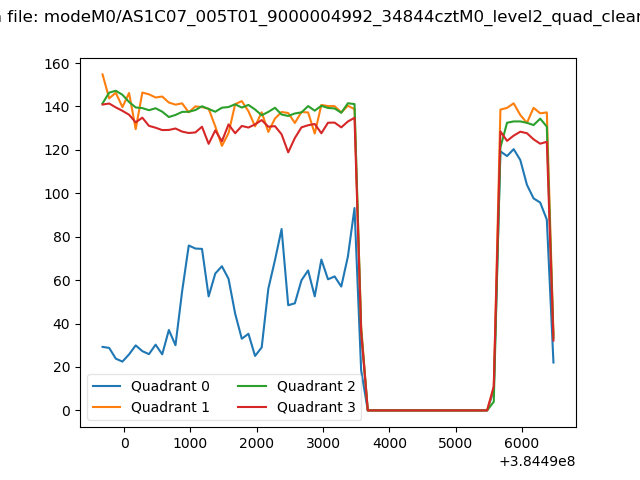 |
|
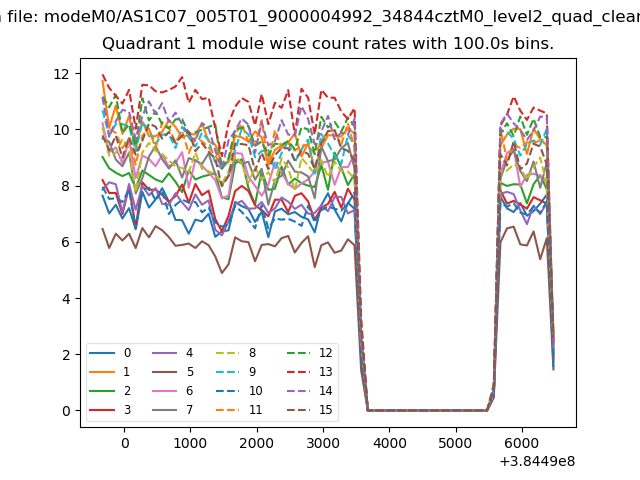
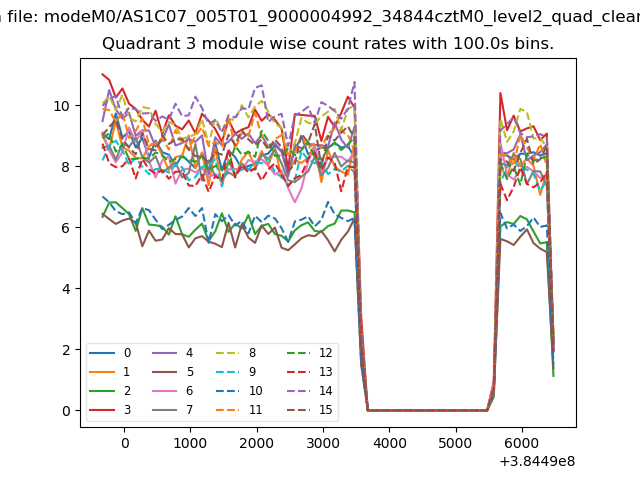
| Module-wise count rates for Quadrant A Data is divided into 100 sec bins |
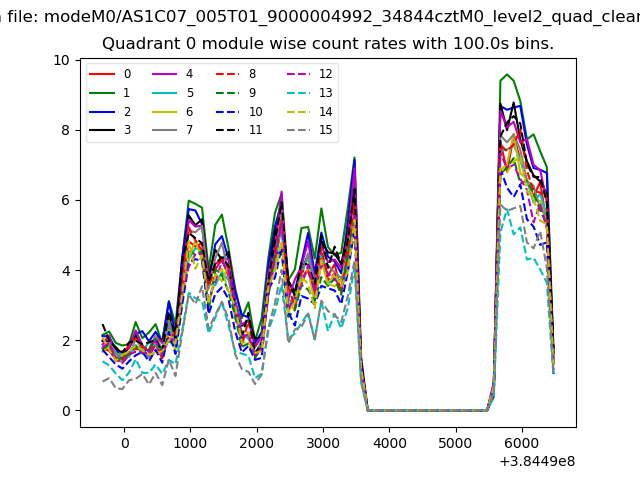 |
 |
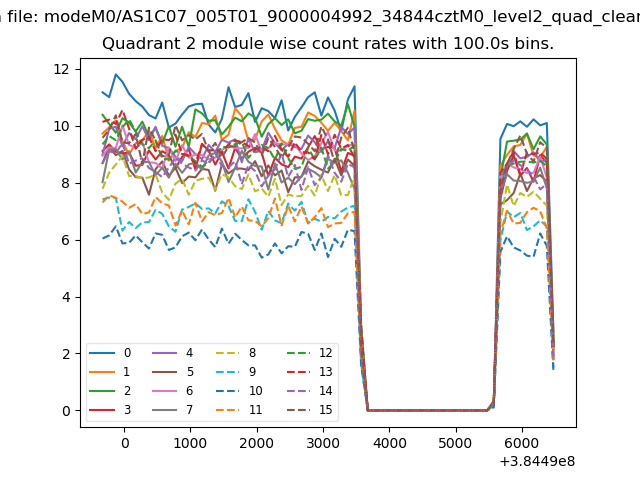
| Module-wise count rates for Quadrant B Data is divided into 100 sec bins |
 |
 |
| Module-wise count rates for Quadrant C Data is divided into 100 sec bins |
 |
 |
| Module-wise count rates for Quadrant D Data is divided into 100 sec bins |
 |
 |
| Parameter | Plot |
|---|---|
| CZT HV Monitor | 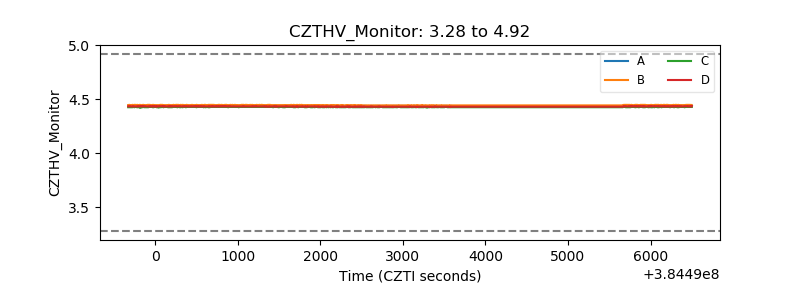 |
| D_VDD | 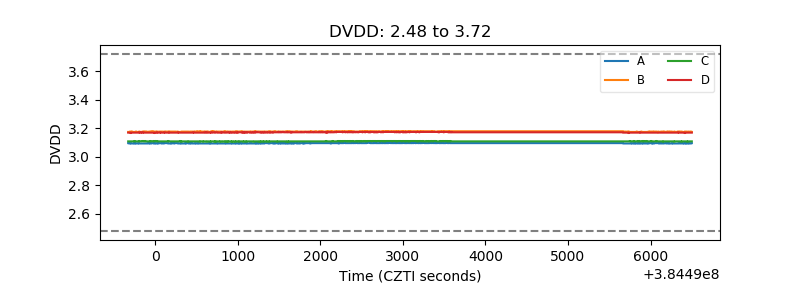 |
| Temperature 1 | 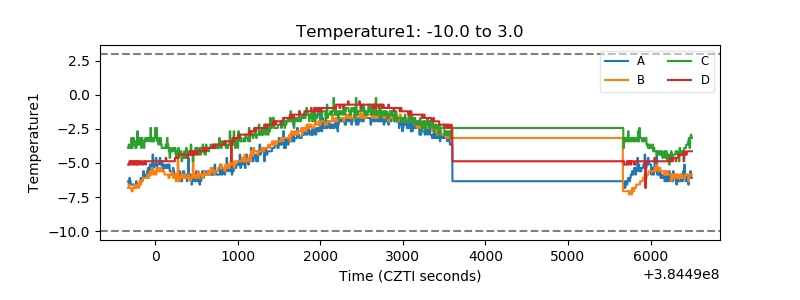 |
| Veto HV Monitor | 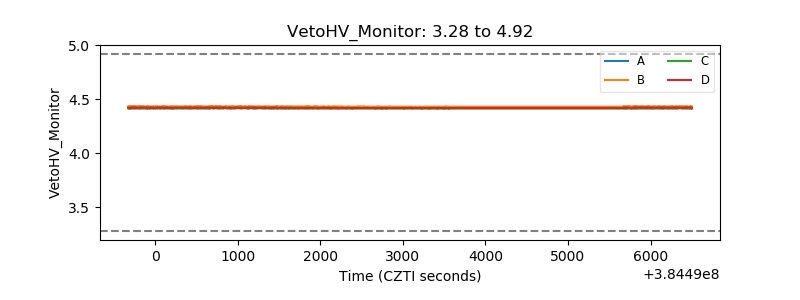 |
| Veto LLD | 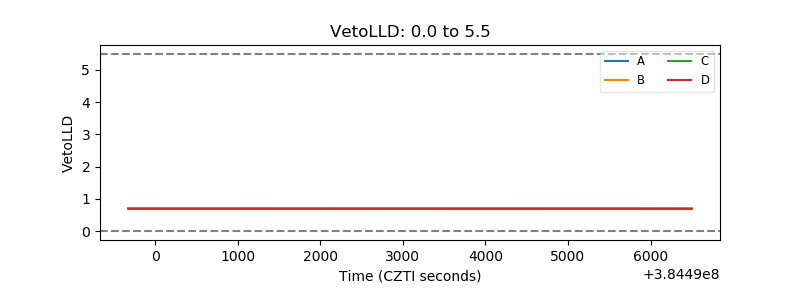 |
| Alpha Counter | 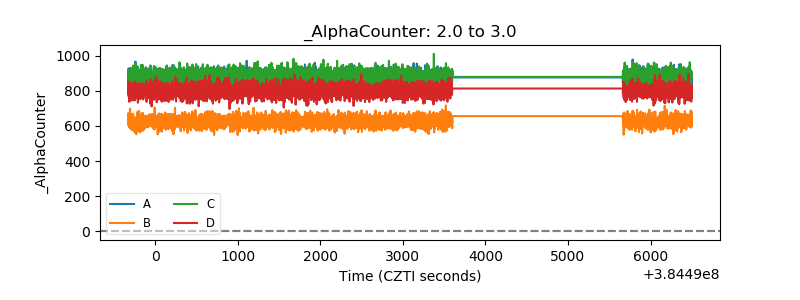 |
| _CPM_Rate | 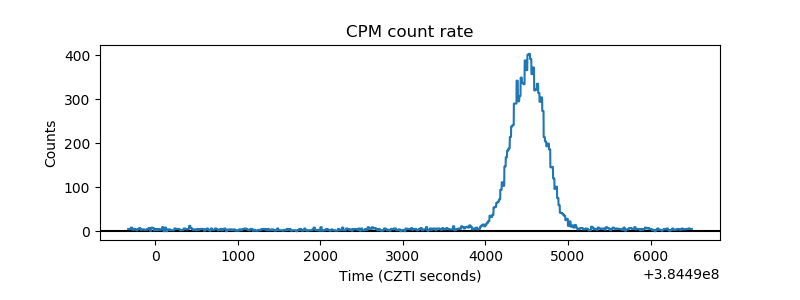 |
| CZT Counter | 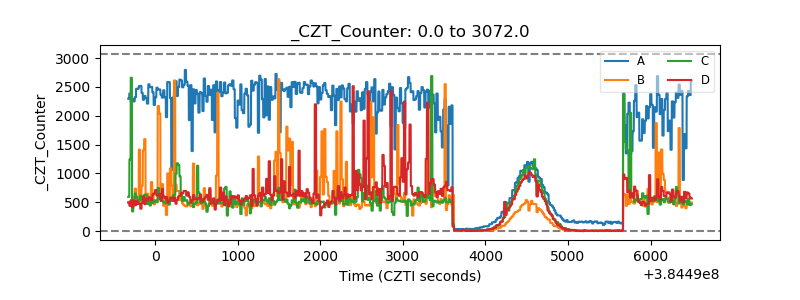 |
| +2.5 Volts monitor | 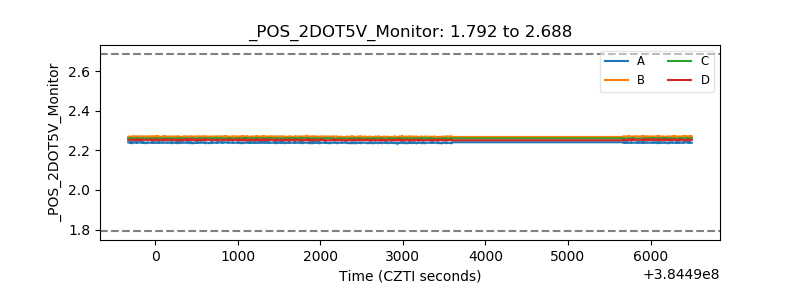 |
| +5 Volts monitor | 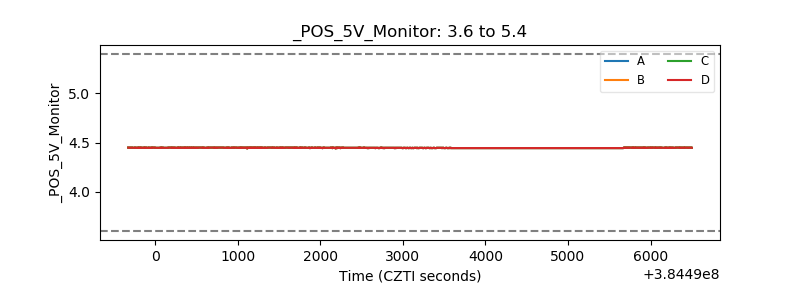 |
| _ROLL_ROT | 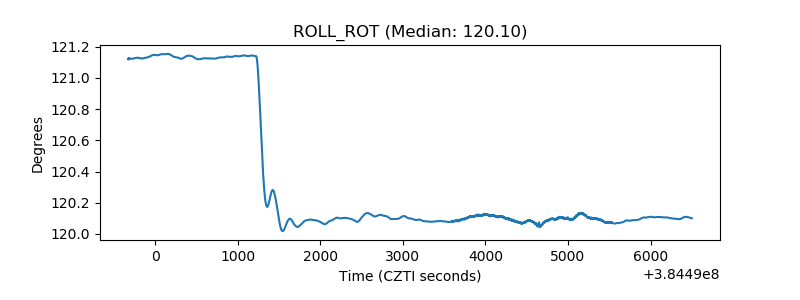 |
| _Roll_DEC | 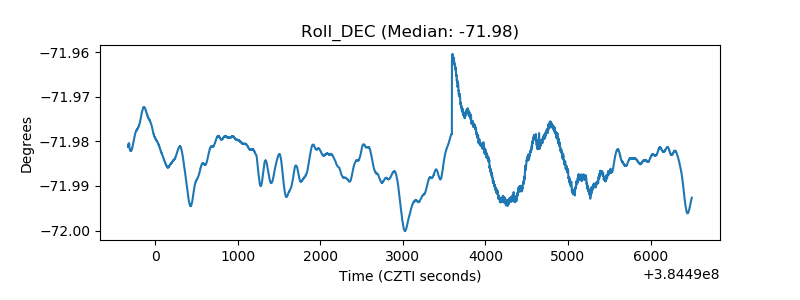 |
| _Roll_RA | 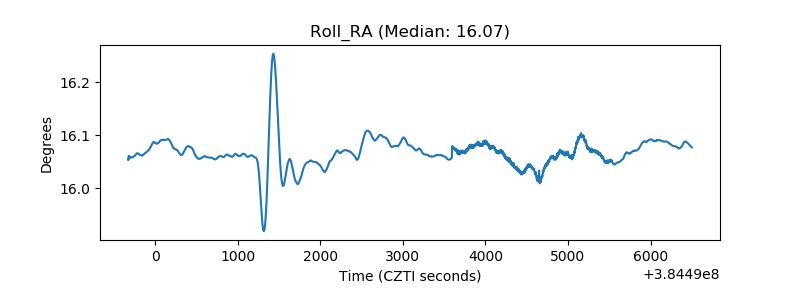 |
| Veto Counter | 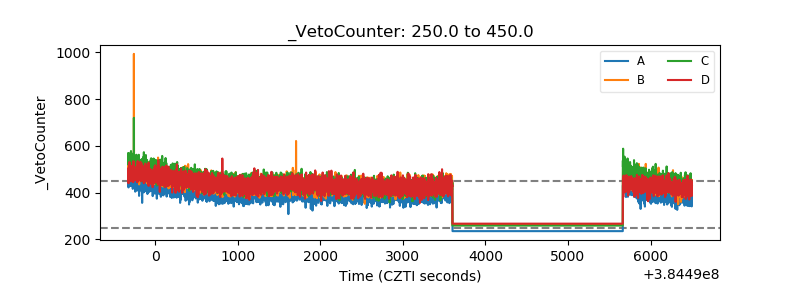 |