| Param | Original file | Final file |
|---|---|---|
| Filename | modeM0/AS1C07_005T01_9000004992_34841cztM0_level2.evt | modeM0/AS1C07_005T01_9000004992_34841cztM0_level2_quad_clean.evt |
| Size (bytes) | 738,437,760 | 81,129,600 |
| Size | 704.2 MB | 77.4 MB |
| Events in quadrant A | 8,945,733 | 456,867 |
| Events in quadrant B | 6,684,531 | 534,476 |
| Events in quadrant C | 3,110,810 | 564,975 |
| Events in quadrant D | 3,283,095 | 546,215 |
| Mode M9 | |||
|---|---|---|---|
| Quadrant | BADHDUFLAG | Total packets | Discarded packets |
| A | 0 | 30 | 0 |
| B | 0 | 30 | 0 |
| C | 0 | 30 | 0 |
| D | 0 | 31 | 0 |
| Mode M0 | |||
|---|---|---|---|
| Quadrant | BADHDUFLAG | Total packets | Discarded packets |
| A | 0 | 30071 | 3 |
| B | 0 | 23262 | 2 |
| C | 0 | 12086 | 2 |
| D | 0 | 12972 | 2 |
| Mode SS | |||
|---|---|---|---|
| Quadrant | BADHDUFLAG | Total packets | Discarded packets |
| A | 0 | 102 | 0 |
| B | 0 | 102 | 0 |
| C | 0 | 102 | 0 |
| D | 0 | 102 | 0 |
| Quadrant | Total seconds | Saturated seconds | Saturation percentage |
|---|---|---|---|
| A | 5034 | 2520 | 50.059595% |
| B | 5034 | 1613 | 32.042114% |
| C | 5034 | 152 | 3.019468% |
| D | 5034 | 83 | 1.648788% |
Noise dominated data is calculated using 1-second bins in cleaned event files. If a bin has >2000 counts, and if more than 50% of those come from <1% of pixels, then it is considered to be noise-dominated and hence unusable.
| Quadrant | # 1 sec bins | Bins with >0 counts | Bins with >2000 counts | High rate bins dominated by noise | Noise dominated (total time) | Noise dominated (detector-on time) | Marked lightcurve |
|---|---|---|---|---|---|---|---|
| A | 7037 | 5034 | 2220 | 2220 | 31.55% | 44.10% | 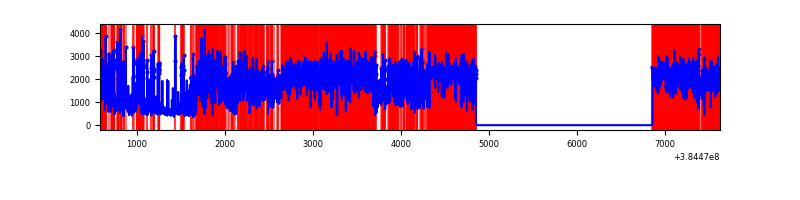 |
| B | 7037 | 5035 | 1370 | 1370 | 19.47% | 27.21% | 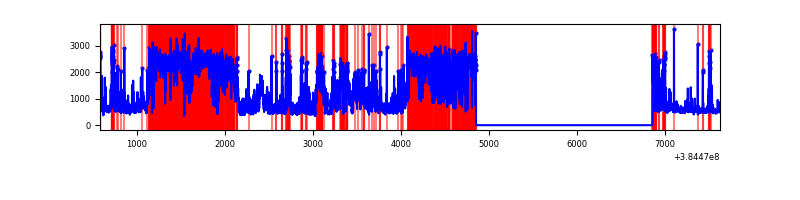 |
| C | 7037 | 5035 | 114 | 114 | 1.62% | 2.26% | 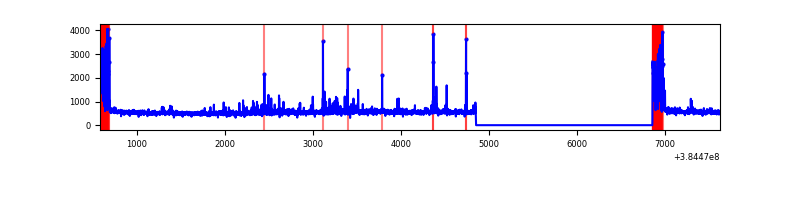 |
| D | 7037 | 5035 | 72 | 72 | 1.02% | 1.43% | 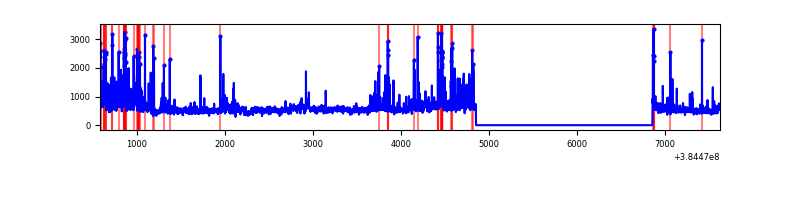 |
Top three noisy pixels from each quadrant. If the there are fewer than three noisy pixels in the level2.evt file, extra rows are filled as -1
| Pixel properties | Quadrant properties | ||||||
|---|---|---|---|---|---|---|---|
| Quadrant | DetID | PixID | Counts | Sigma | Mean | Median | Sigma |
| A | 15 | 169 | 6865874 | 65970.89 | 523 | 515 | 104.1 |
| A | 10 | 83 | 42380 | 402.29 | 523 | 515 | 104.1 |
| A | 13 | 6 | 11002 | 100.77 | 523 | 515 | 104.1 |
| B | 5 | 31 | 1215949 | 11730.59 | 560 | 548 | 103.6 |
| B | 5 | 15 | 1212091 | 11693.35 | 560 | 548 | 103.6 |
| B | 5 | 14 | 1202777 | 11603.45 | 560 | 548 | 103.6 |
| C | 0 | 10 | 346416 | 2525.52 | 600 | 605 | 136.9 |
| C | 15 | 214 | 228594 | 1665.04 | 600 | 605 | 136.9 |
| C | 0 | 207 | 141504 | 1029.01 | 600 | 605 | 136.9 |
| D | 8 | 195 | 487659 | 3204.16 | 599 | 586 | 152.0 |
| D | 12 | 233 | 132511 | 867.85 | 599 | 586 | 152.0 |
| D | 13 | 249 | 76628 | 500.23 | 599 | 586 | 152.0 |
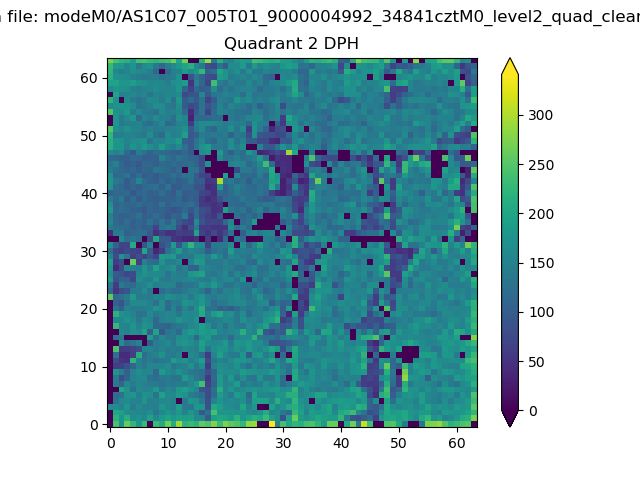
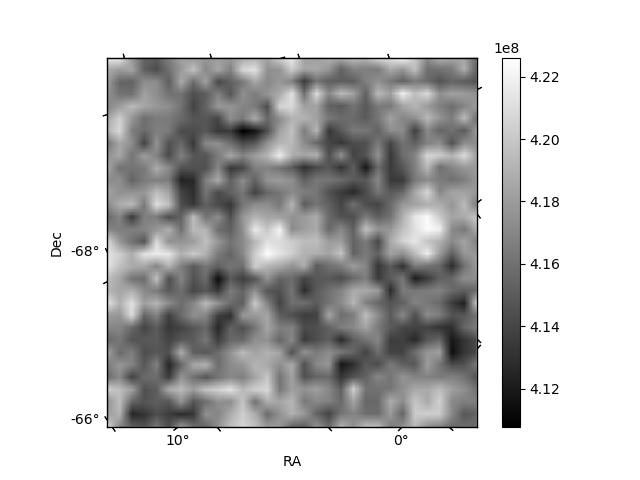
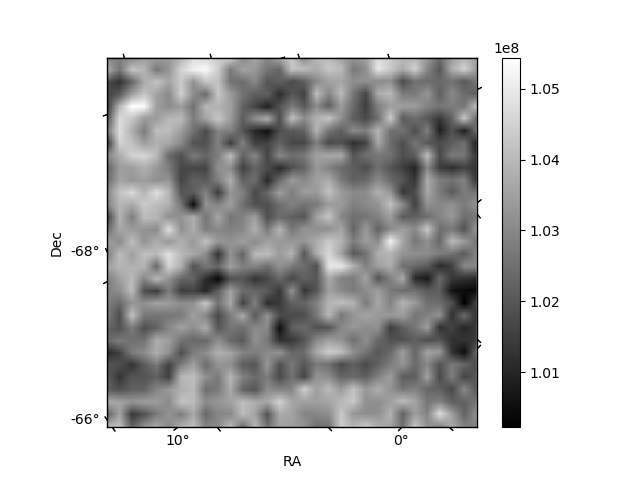
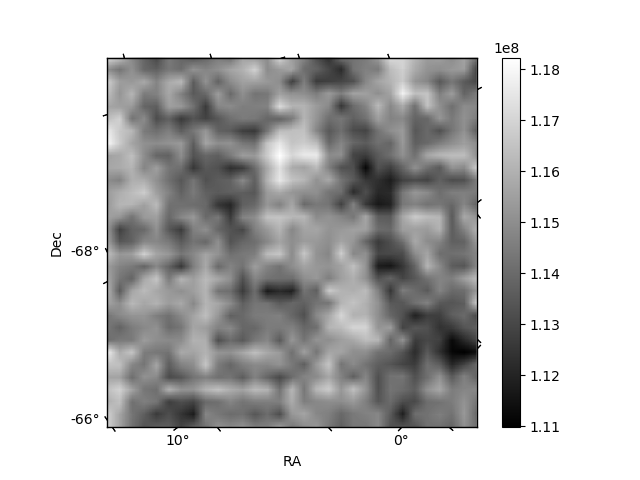
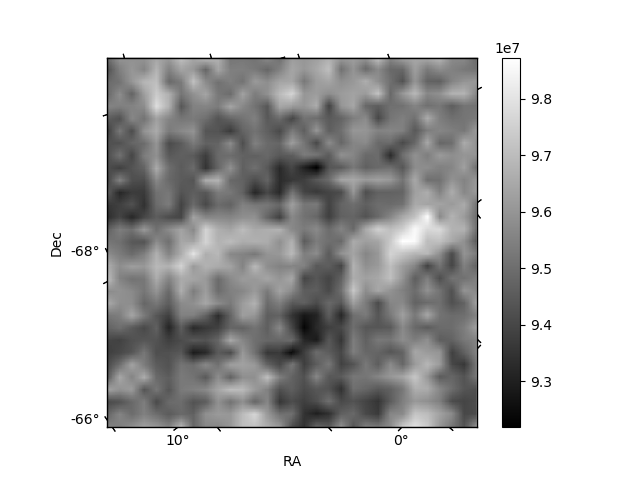
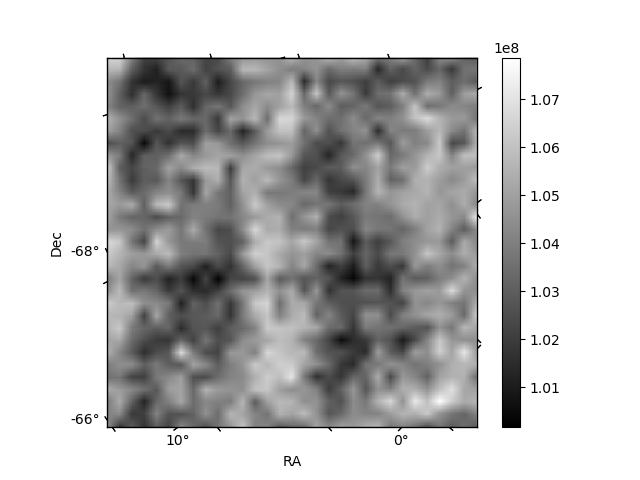
Histogram calculated using DETX and DETY for each event in the final _common_clean file
| Quadrant A | 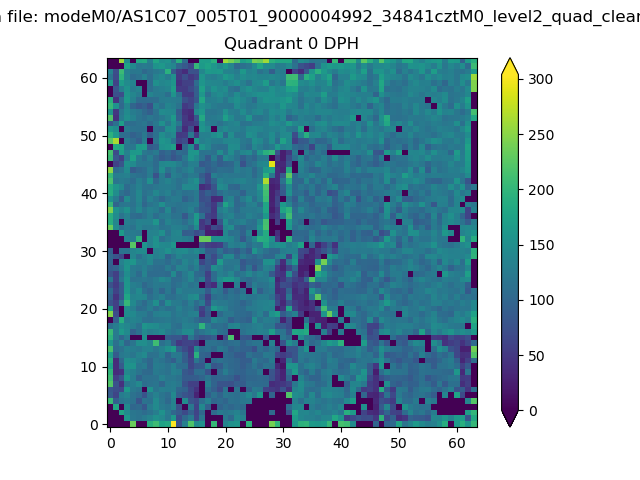 |
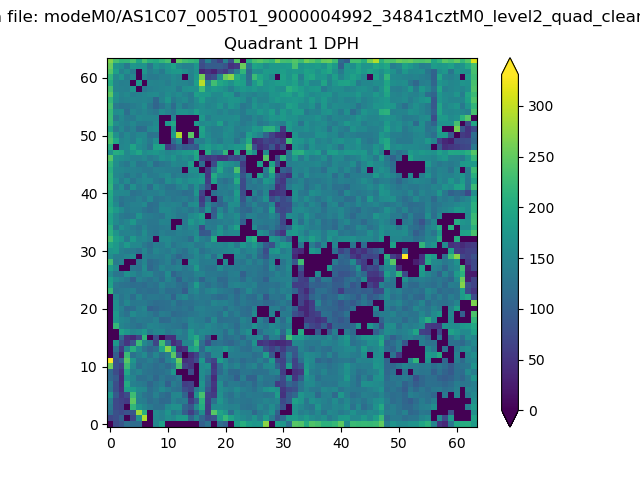 |
Quadrant B |
|---|---|---|---|
| Quadrant D | 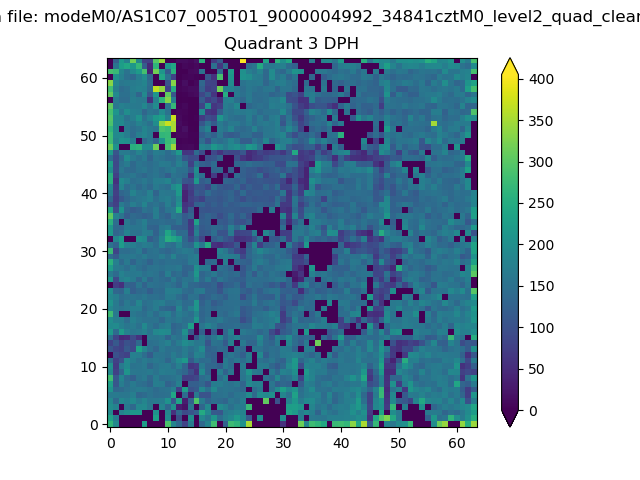 |
 |
Quadrant C |
| Plot type | Count rate plots | Images |
|---|---|---|
| Comparison with Poisson distribution Blue bars denote a histogram of data divided into 1 sec bins. Red curve is a Poisson curve with rate = median count rate of data. |
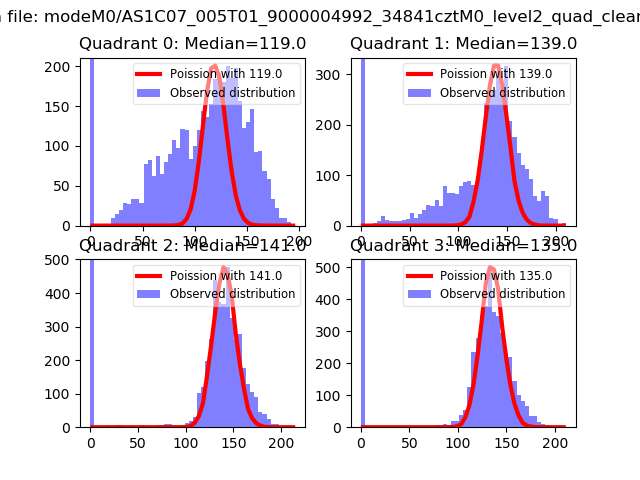 |
 |
| Quadrant-wise count rates Data is divided into 100 sec bins |
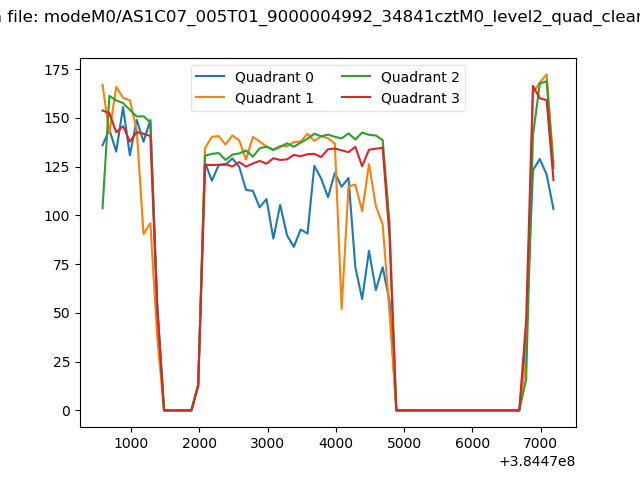 |
|
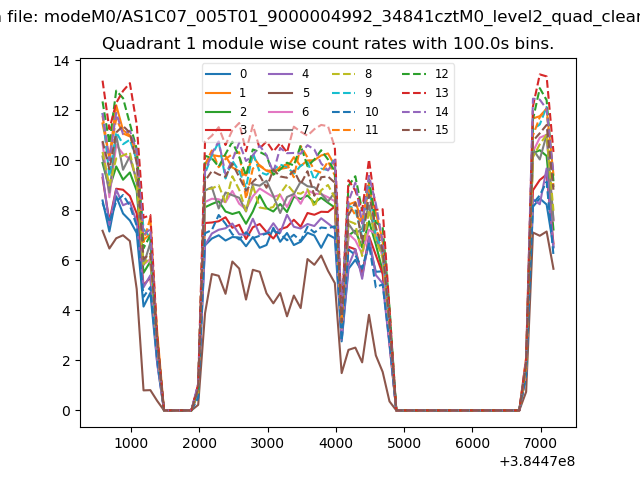
| Module-wise count rates for Quadrant A Data is divided into 100 sec bins |
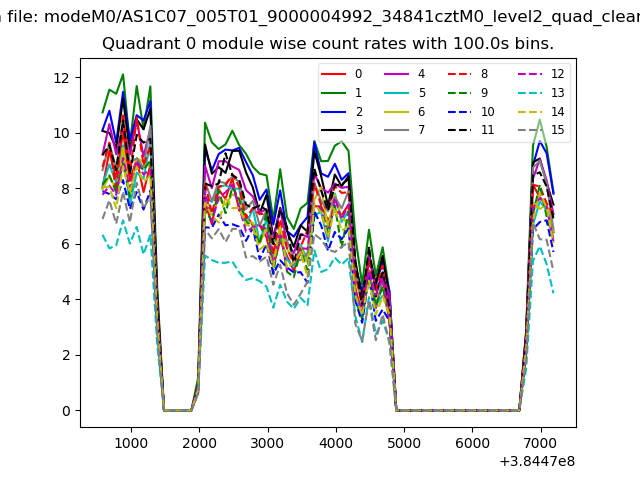 |
 |
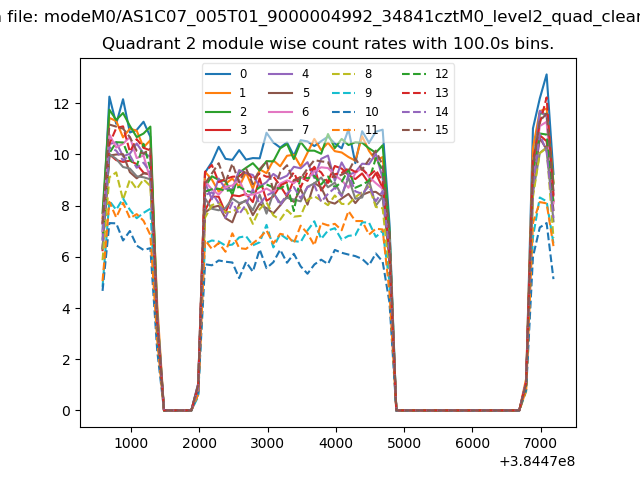
| Module-wise count rates for Quadrant B Data is divided into 100 sec bins |
 |
 |
| Module-wise count rates for Quadrant C Data is divided into 100 sec bins |
 |
 |
| Module-wise count rates for Quadrant D Data is divided into 100 sec bins |
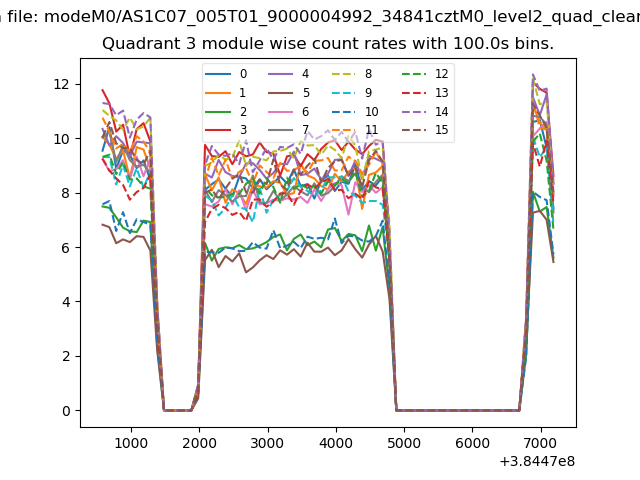 |
 |
| Parameter | Plot |
|---|---|
| CZT HV Monitor | 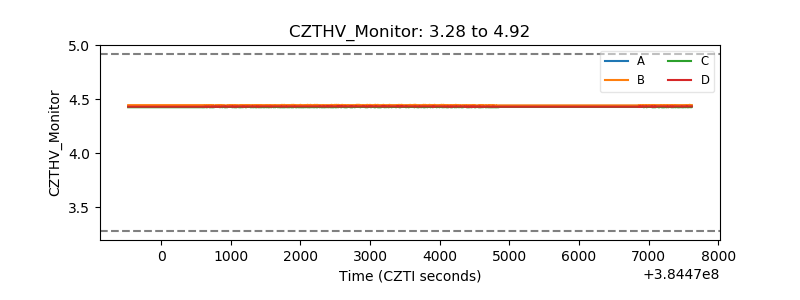 |
| D_VDD | 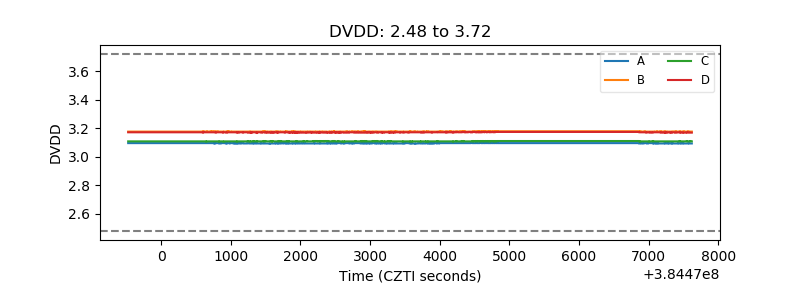 |
| Temperature 1 | 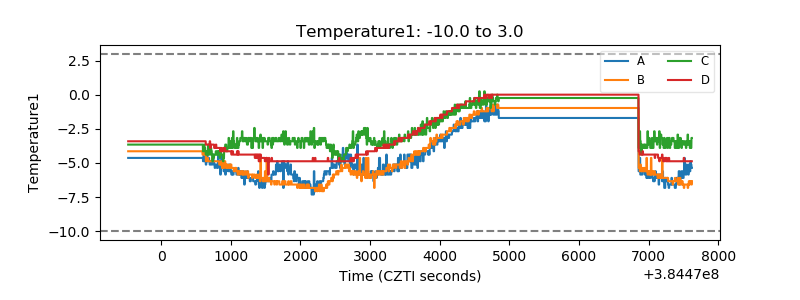 |
| Veto HV Monitor | 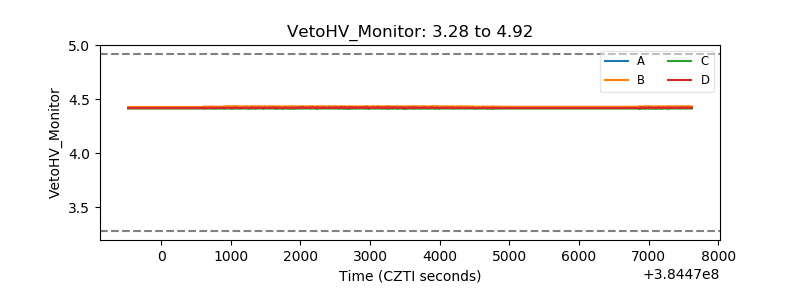 |
| Veto LLD | 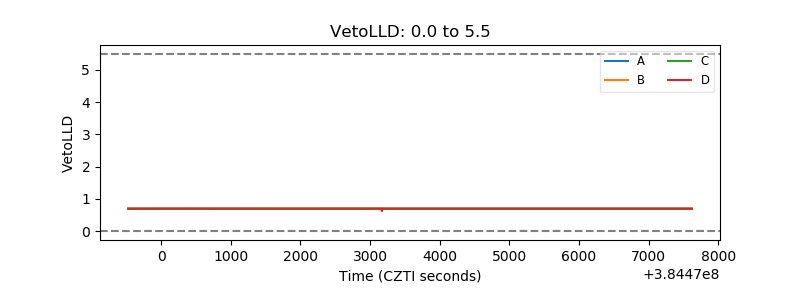 |
| Alpha Counter | 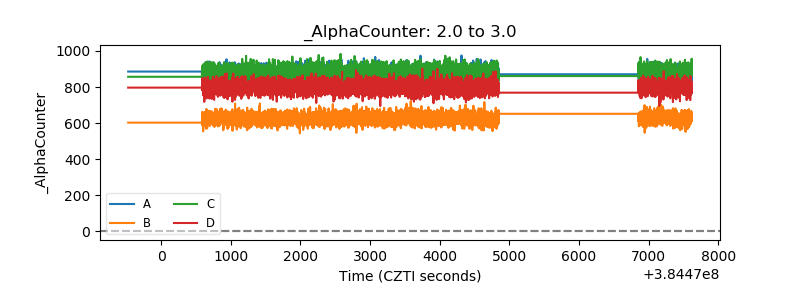 |
| _CPM_Rate | 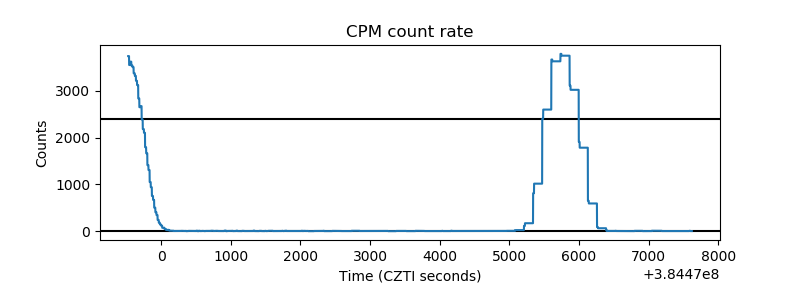 |
| CZT Counter | 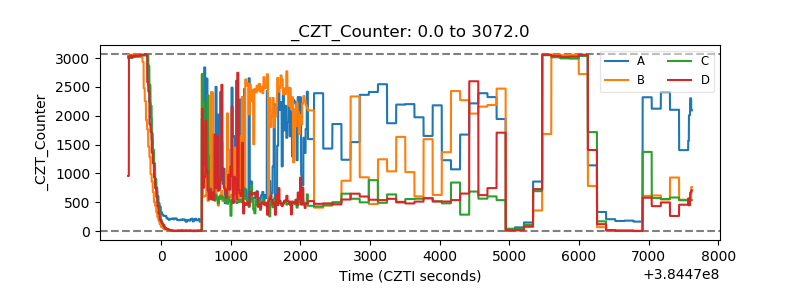 |
| +2.5 Volts monitor | 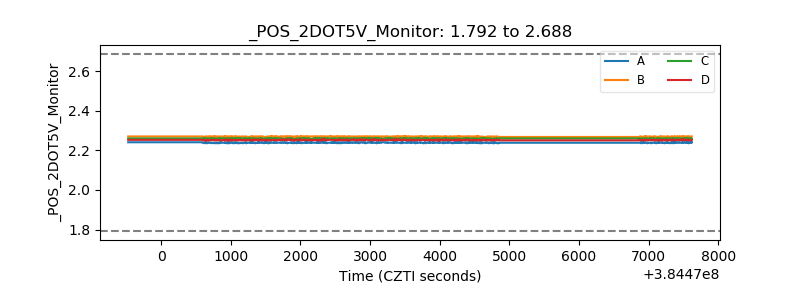 |
| +5 Volts monitor | 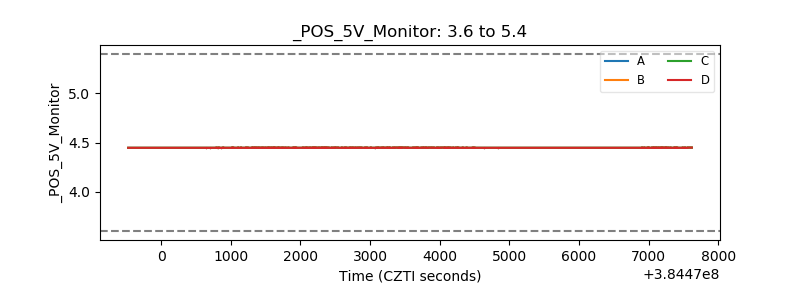 |
| _ROLL_ROT | 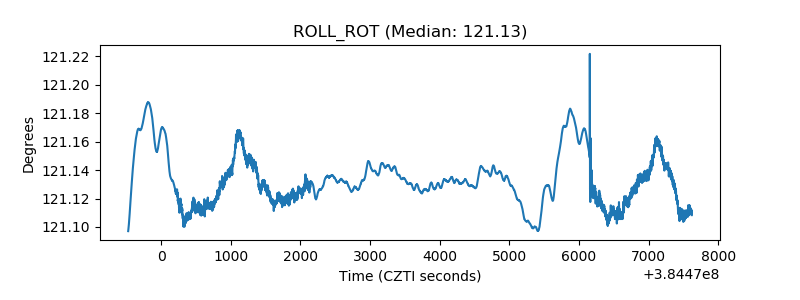 |
| _Roll_DEC | 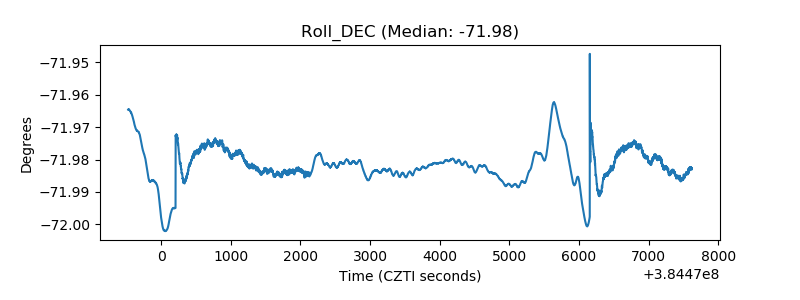 |
| _Roll_RA | 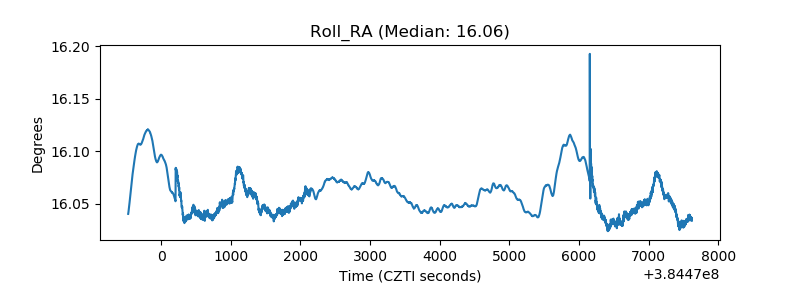 |
| Veto Counter | 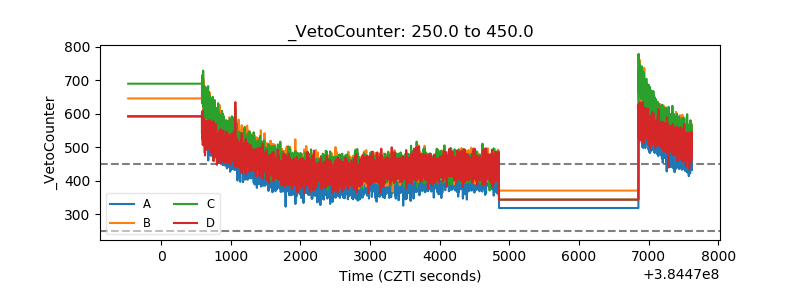 |