| Param | Original file | Final file |
|---|---|---|
| Filename | modeM0/AS1C07_005T01_9000004992_34840cztM0_level2.evt | modeM0/AS1C07_005T01_9000004992_34840cztM0_level2_quad_clean.evt |
| Size (bytes) | 569,603,520 | 92,589,120 |
| Size | 543.2 MB | 88.3 MB |
| Events in quadrant A | 5,662,555 | 608,891 |
| Events in quadrant B | 4,555,494 | 620,735 |
| Events in quadrant C | 3,061,289 | 615,809 |
| Events in quadrant D | 3,615,446 | 589,647 |
| Mode M9 | |||
|---|---|---|---|
| Quadrant | BADHDUFLAG | Total packets | Discarded packets |
| A | 0 | 23 | 0 |
| B | 0 | 23 | 0 |
| C | 0 | 23 | 0 |
| D | 0 | 24 | 0 |
| Mode M0 | |||
|---|---|---|---|
| Quadrant | BADHDUFLAG | Total packets | Discarded packets |
| A | 0 | 20541 | 3 |
| B | 0 | 16946 | 2 |
| C | 0 | 12052 | 2 |
| D | 0 | 14247 | 2 |
| Mode SS | |||
|---|---|---|---|
| Quadrant | BADHDUFLAG | Total packets | Discarded packets |
| A | 0 | 108 | 0 |
| B | 0 | 108 | 0 |
| C | 0 | 108 | 0 |
| D | 0 | 108 | 0 |
| Quadrant | Total seconds | Saturated seconds | Saturation percentage |
|---|---|---|---|
| A | 5257 | 483 | 9.187750% |
| B | 5257 | 677 | 12.878067% |
| C | 5257 | 154 | 2.929427% |
| D | 5257 | 169 | 3.214761% |
Noise dominated data is calculated using 1-second bins in cleaned event files. If a bin has >2000 counts, and if more than 50% of those come from <1% of pixels, then it is considered to be noise-dominated and hence unusable.
| Quadrant | # 1 sec bins | Bins with >0 counts | Bins with >2000 counts | High rate bins dominated by noise | Noise dominated (total time) | Noise dominated (detector-on time) | Marked lightcurve |
|---|---|---|---|---|---|---|---|
| A | 7140 | 5258 | 441 | 441 | 6.18% | 8.39% | 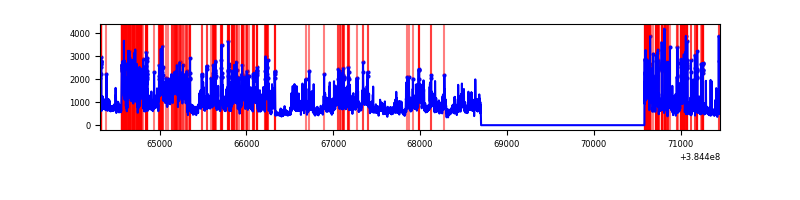 |
| B | 7140 | 5258 | 568 | 568 | 7.96% | 10.80% | 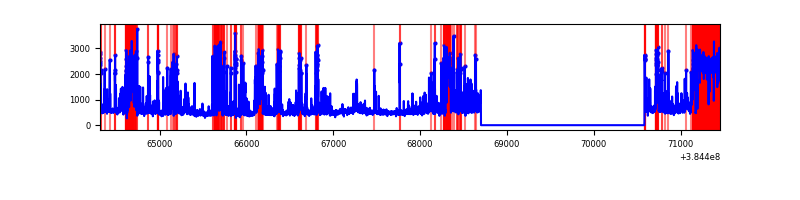 |
| C | 7140 | 5258 | 120 | 120 | 1.68% | 2.28% |  |
| D | 7140 | 5258 | 160 | 160 | 2.24% | 3.04% | 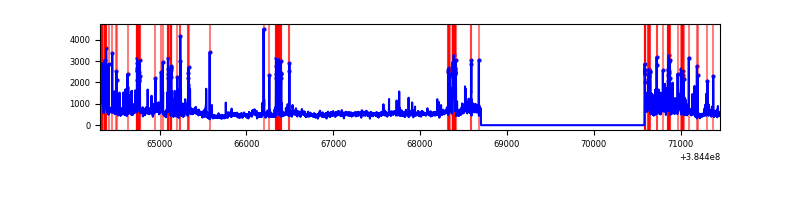 |
Top three noisy pixels from each quadrant. If the there are fewer than three noisy pixels in the level2.evt file, extra rows are filled as -1
| Pixel properties | Quadrant properties | ||||||
|---|---|---|---|---|---|---|---|
| Quadrant | DetID | PixID | Counts | Sigma | Mean | Median | Sigma |
| A | 15 | 169 | 3209939 | 26678.18 | 610 | 600 | 120.3 |
| A | 10 | 83 | 47771 | 392.12 | 610 | 600 | 120.3 |
| A | 15 | 237 | 28583 | 232.61 | 610 | 600 | 120.3 |
| B | 5 | 172 | 1120157 | 10012.89 | 601 | 587 | 111.8 |
| B | 5 | 31 | 262537 | 2342.75 | 601 | 587 | 111.8 |
| B | 5 | 15 | 260849 | 2327.66 | 601 | 587 | 111.8 |
| C | 0 | 10 | 365380 | 2660.21 | 599 | 604 | 137.1 |
| C | 15 | 214 | 238928 | 1738.03 | 599 | 604 | 137.1 |
| C | 0 | 207 | 47980 | 345.5 | 599 | 604 | 137.1 |
| D | 8 | 195 | 571215 | 3716.65 | 593 | 579 | 153.5 |
| D | 13 | 249 | 292087 | 1898.64 | 593 | 579 | 153.5 |
| D | 10 | 118 | 113832 | 737.63 | 593 | 579 | 153.5 |
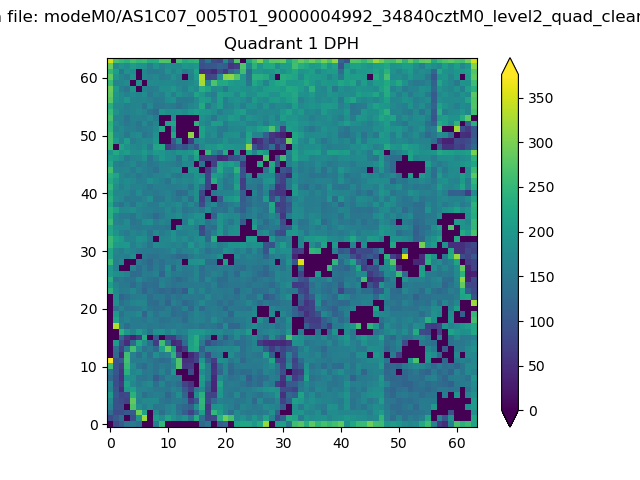
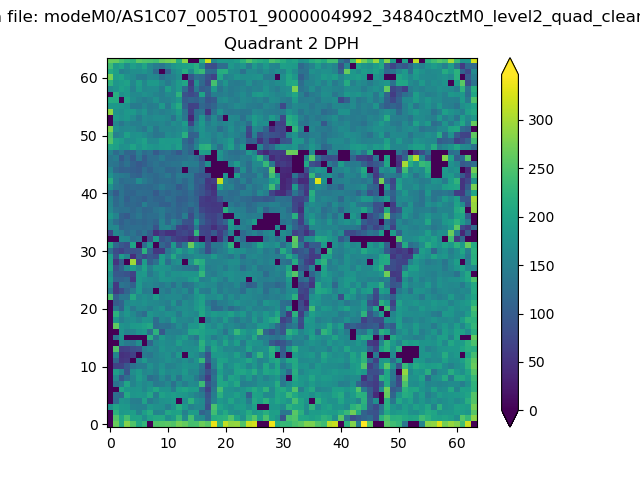
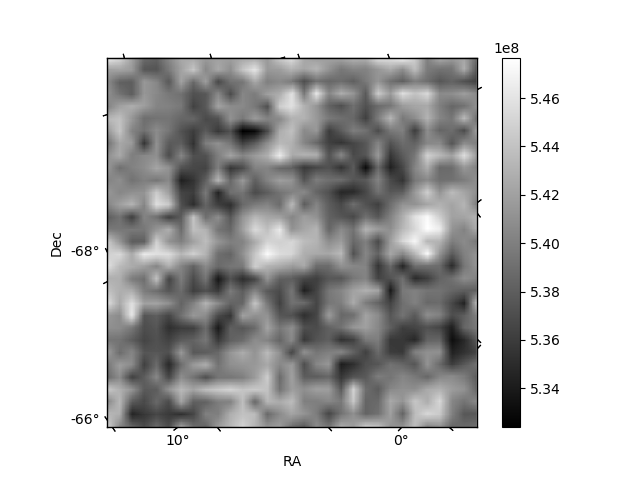
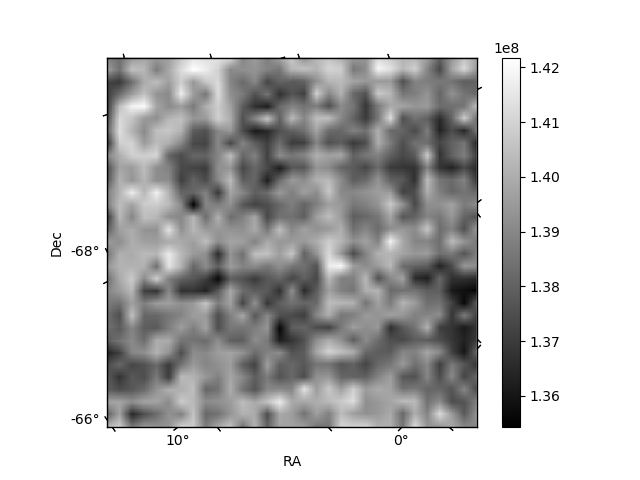
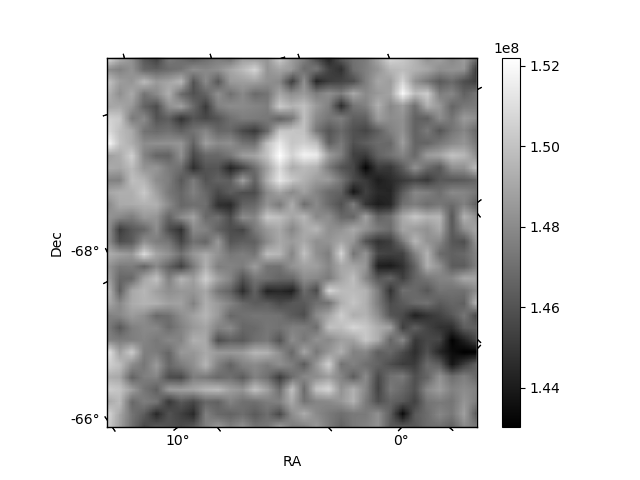
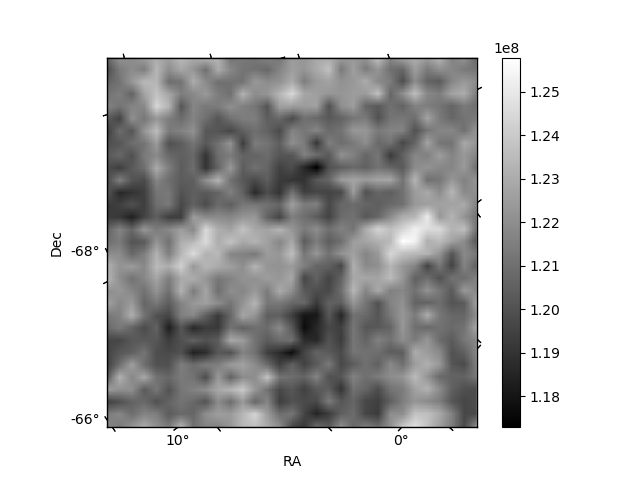
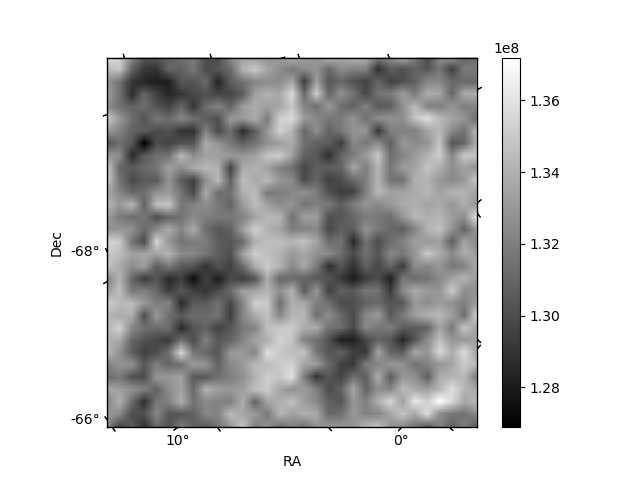
Histogram calculated using DETX and DETY for each event in the final _common_clean file
| Quadrant A | 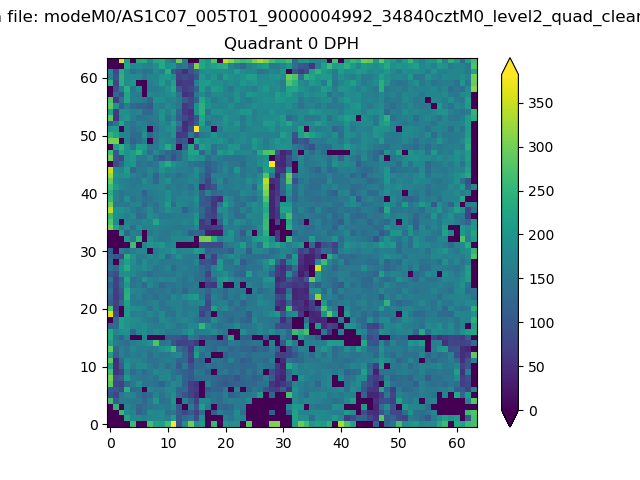 |
 |
Quadrant B |
|---|---|---|---|
| Quadrant D | 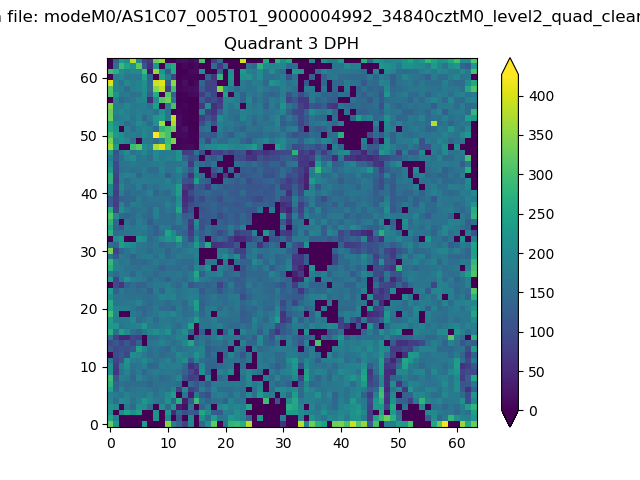 |
 |
Quadrant C |
| Plot type | Count rate plots | Images |
|---|---|---|
| Comparison with Poisson distribution Blue bars denote a histogram of data divided into 1 sec bins. Red curve is a Poisson curve with rate = median count rate of data. |
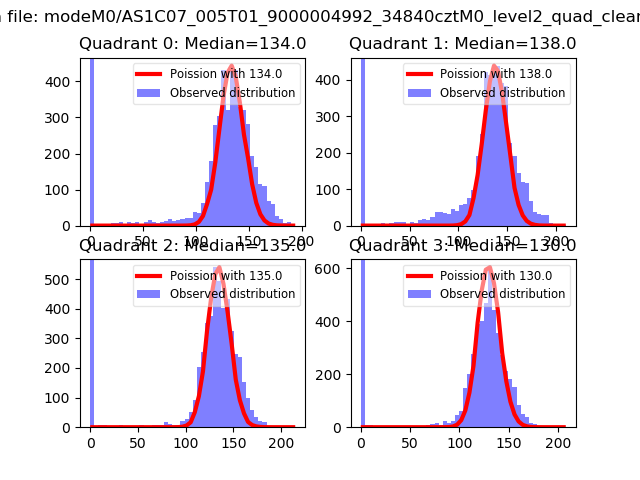 |
 |
| Quadrant-wise count rates Data is divided into 100 sec bins |
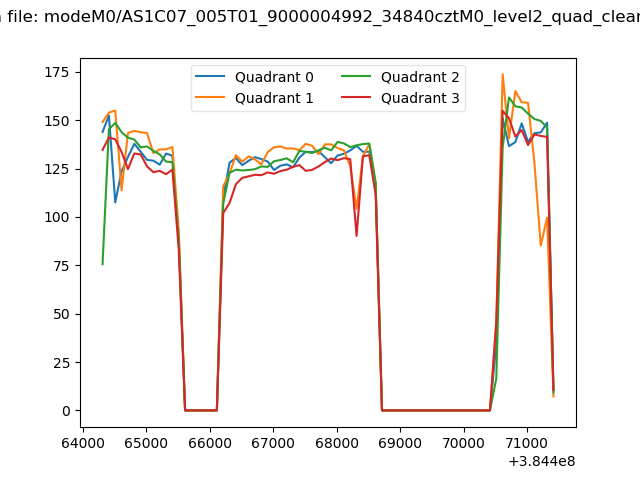 |
|
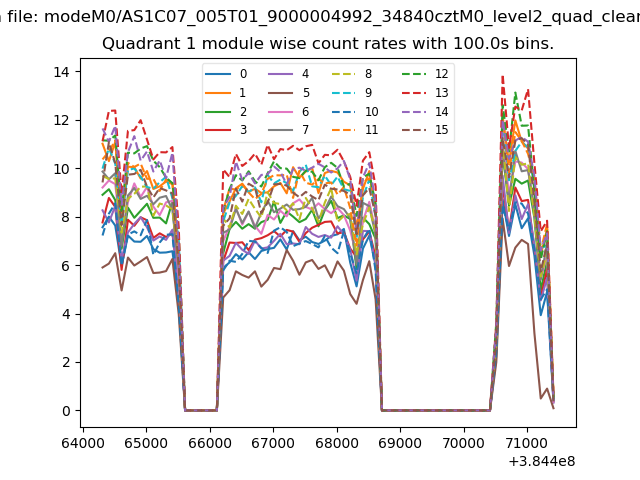
| Module-wise count rates for Quadrant A Data is divided into 100 sec bins |
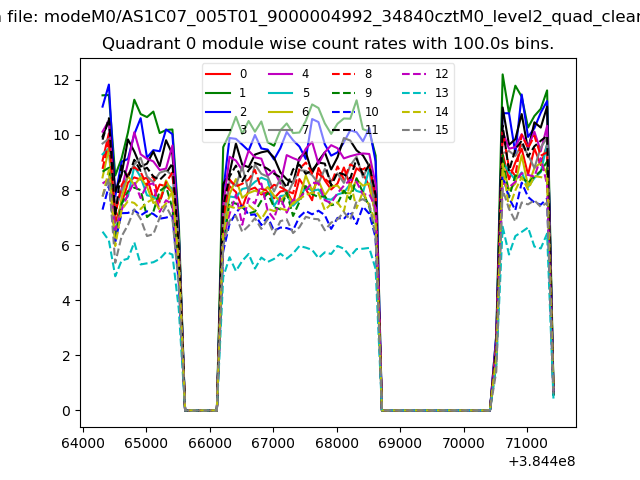 |
 |
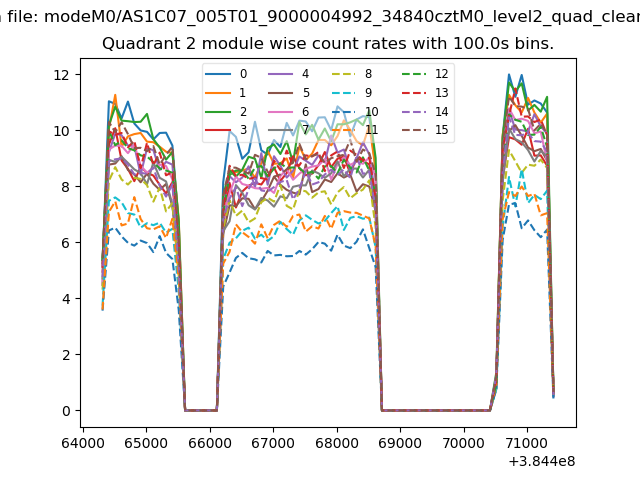
| Module-wise count rates for Quadrant B Data is divided into 100 sec bins |
 |
 |
| Module-wise count rates for Quadrant C Data is divided into 100 sec bins |
 |
 |
| Module-wise count rates for Quadrant D Data is divided into 100 sec bins |
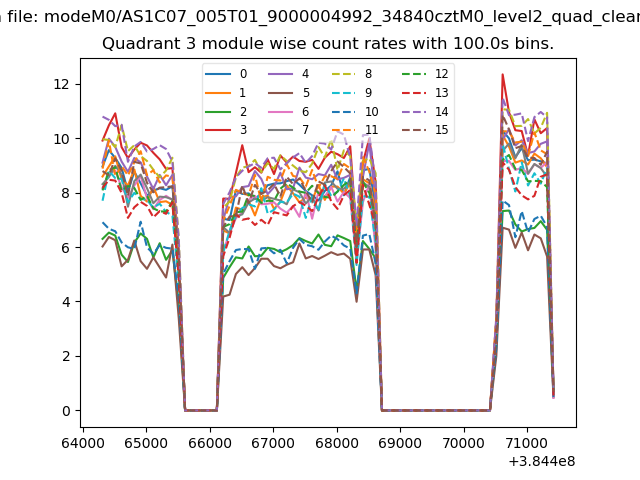 |
 |
| Parameter | Plot |
|---|---|
| CZT HV Monitor | 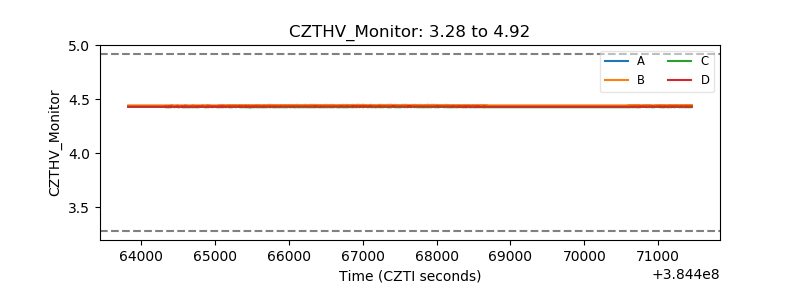 |
| D_VDD | 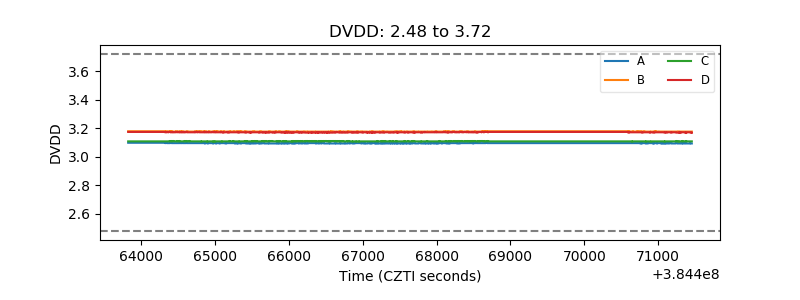 |
| Temperature 1 | 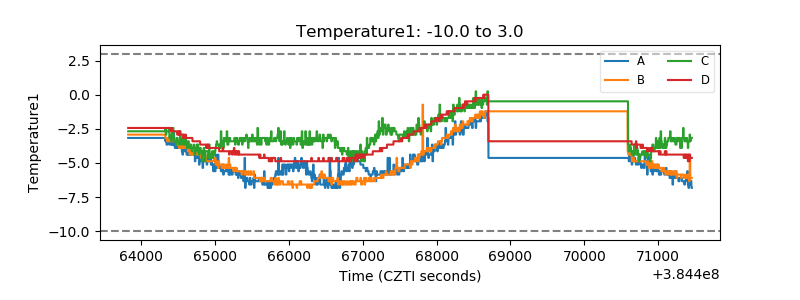 |
| Veto HV Monitor | 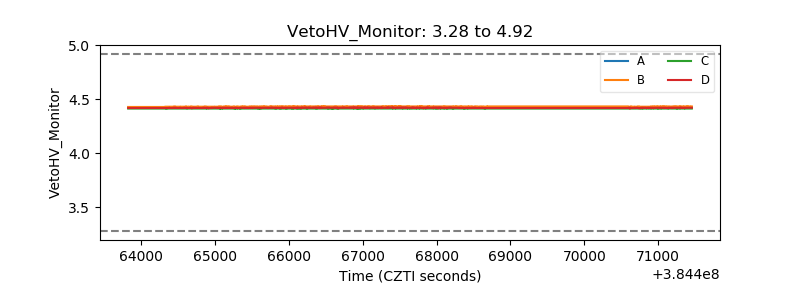 |
| Veto LLD | 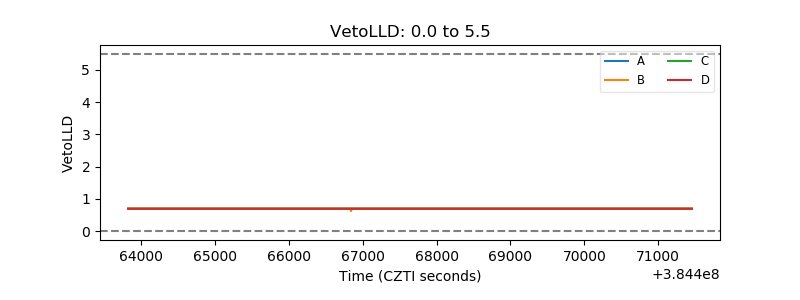 |
| Alpha Counter | 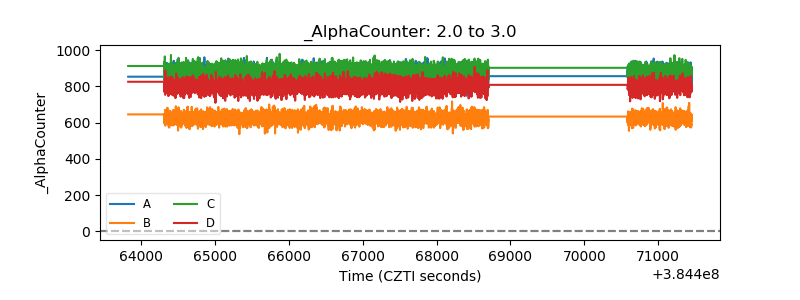 |
| _CPM_Rate | 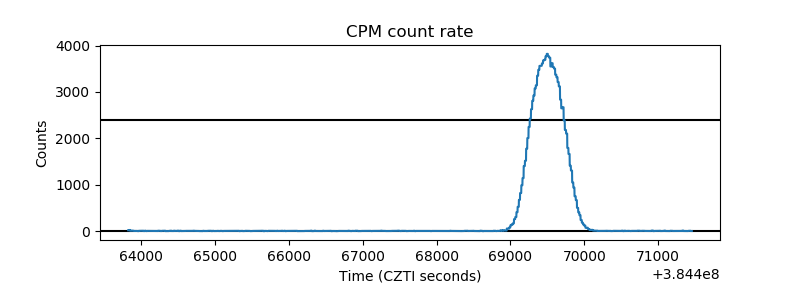 |
| CZT Counter | 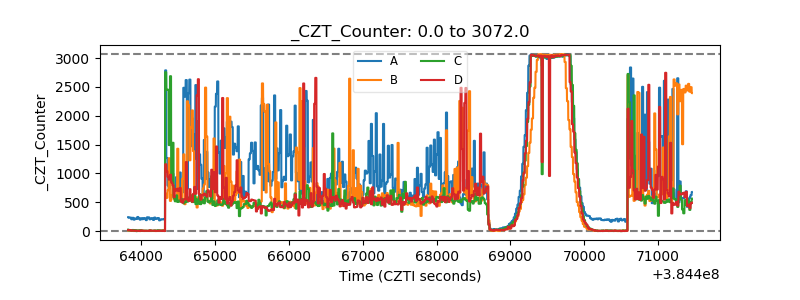 |
| +2.5 Volts monitor | 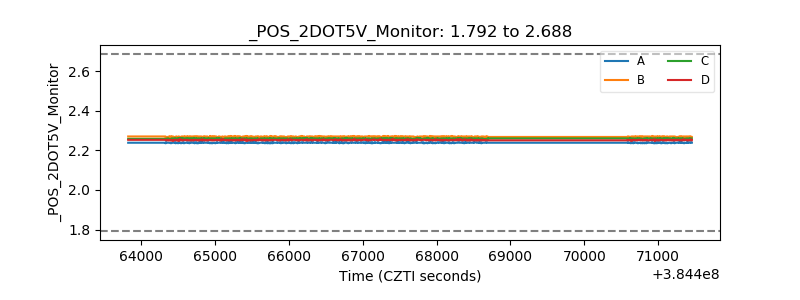 |
| +5 Volts monitor | 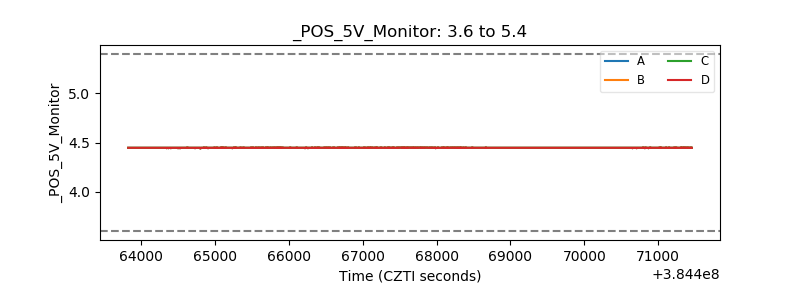 |
| _ROLL_ROT | 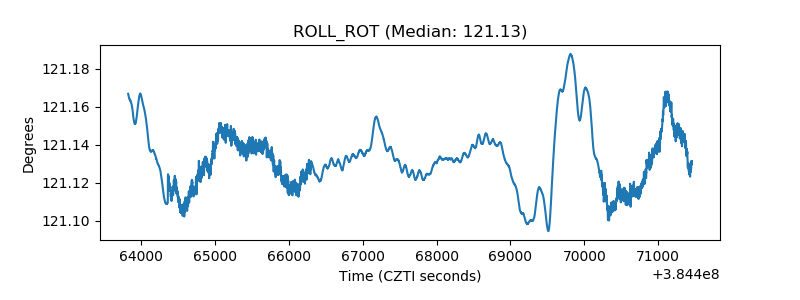 |
| _Roll_DEC | 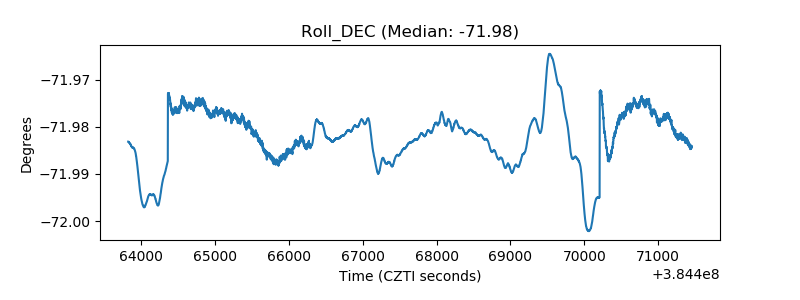 |
| _Roll_RA | 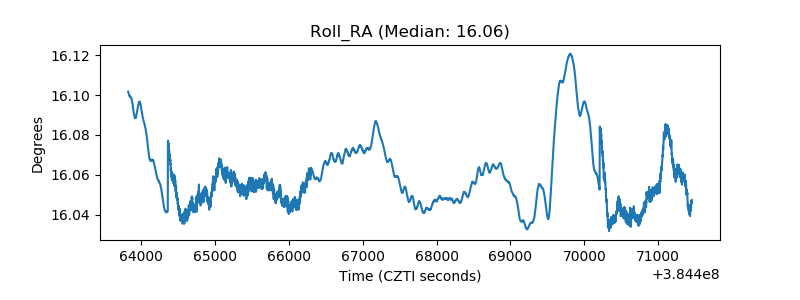 |
| Veto Counter | 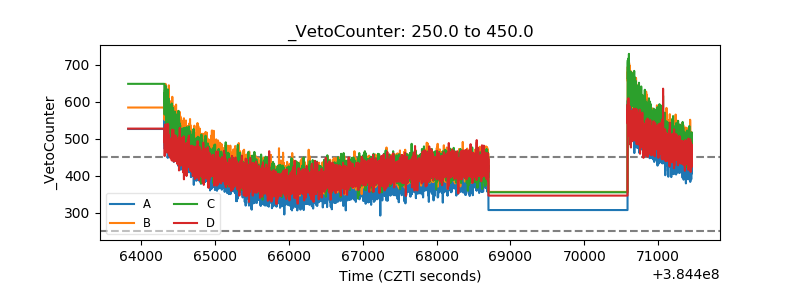 |