| Param | Original file | Final file |
|---|---|---|
| Filename | modeM0/AS1C07_005T01_9000004992_34837cztM0_level2.evt | modeM0/AS1C07_005T01_9000004992_34837cztM0_level2_quad_clean.evt |
| Size (bytes) | 730,319,040 | 85,959,360 |
| Size | 696.5 MB | 82.0 MB |
| Events in quadrant A | 3,547,584 | 611,567 |
| Events in quadrant B | 11,391,553 | 411,237 |
| Events in quadrant C | 3,006,013 | 604,585 |
| Events in quadrant D | 3,797,003 | 585,868 |
| Mode M9 | |||
|---|---|---|---|
| Quadrant | BADHDUFLAG | Total packets | Discarded packets |
| A | 0 | 21 | 0 |
| B | 0 | 21 | 0 |
| C | 0 | 21 | 0 |
| D | 0 | 22 | 0 |
| Mode M0 | |||
|---|---|---|---|
| Quadrant | BADHDUFLAG | Total packets | Discarded packets |
| A | 0 | 14357 | 3 |
| B | 0 | 37545 | 2 |
| C | 0 | 12340 | 2 |
| D | 0 | 15016 | 2 |
| Mode SS | |||
|---|---|---|---|
| Quadrant | BADHDUFLAG | Total packets | Discarded packets |
| A | 0 | 114 | 0 |
| B | 0 | 114 | 0 |
| C | 0 | 114 | 0 |
| D | 0 | 114 | 0 |
| Quadrant | Total seconds | Saturated seconds | Saturation percentage |
|---|---|---|---|
| A | 5541 | 258 | 4.656199% |
| B | 5541 | 4345 | 78.415448% |
| C | 5541 | 127 | 2.292005% |
| D | 5541 | 92 | 1.660350% |
Noise dominated data is calculated using 1-second bins in cleaned event files. If a bin has >2000 counts, and if more than 50% of those come from <1% of pixels, then it is considered to be noise-dominated and hence unusable.
| Quadrant | # 1 sec bins | Bins with >0 counts | Bins with >2000 counts | High rate bins dominated by noise | Noise dominated (total time) | Noise dominated (detector-on time) | Marked lightcurve |
|---|---|---|---|---|---|---|---|
| A | 7183 | 5542 | 202 | 202 | 2.81% | 3.64% | 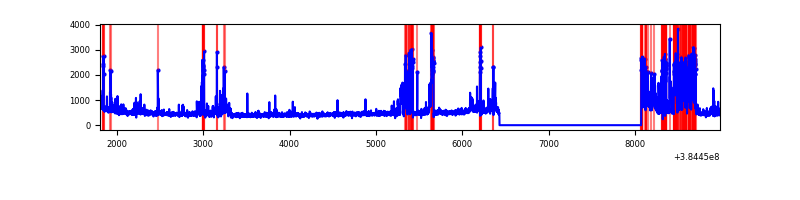 |
| B | 7182 | 5541 | 3997 | 3997 | 55.65% | 72.13% | 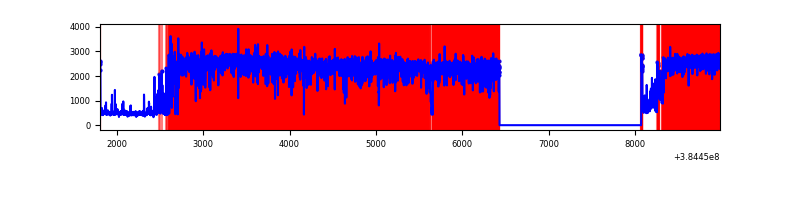 |
| C | 7183 | 5542 | 100 | 100 | 1.39% | 1.80% | 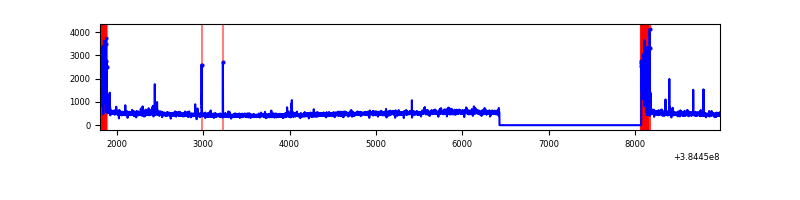 |
| D | 7183 | 5542 | 102 | 102 | 1.42% | 1.84% | 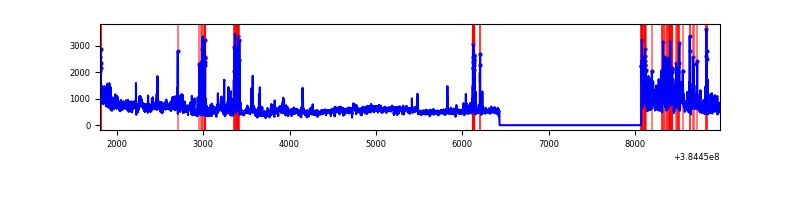 |
Top three noisy pixels from each quadrant. If the there are fewer than three noisy pixels in the level2.evt file, extra rows are filled as -1
| Pixel properties | Quadrant properties | ||||||
|---|---|---|---|---|---|---|---|
| Quadrant | DetID | PixID | Counts | Sigma | Mean | Median | Sigma |
| A | 15 | 169 | 753820 | 6001.23 | 623 | 611 | 125.5 |
| A | 15 | 174 | 281608 | 2238.86 | 623 | 611 | 125.5 |
| A | 10 | 83 | 52528 | 413.65 | 623 | 611 | 125.5 |
| B | 5 | 31 | 3041454 | 36981.53 | 427 | 417 | 82.2 |
| B | 5 | 15 | 3033778 | 36888.19 | 427 | 417 | 82.2 |
| B | 5 | 14 | 2979184 | 36224.28 | 427 | 417 | 82.2 |
| C | 0 | 10 | 337679 | 2411.72 | 602 | 604 | 139.8 |
| C | 15 | 214 | 250366 | 1787.01 | 602 | 604 | 139.8 |
| C | 15 | 159 | 15323 | 105.31 | 602 | 604 | 139.8 |
| D | 8 | 195 | 625677 | 4182.95 | 605 | 585 | 149.4 |
| D | 12 | 227 | 347517 | 2321.58 | 605 | 585 | 149.4 |
| D | 1 | 52 | 110458 | 735.24 | 605 | 585 | 149.4 |
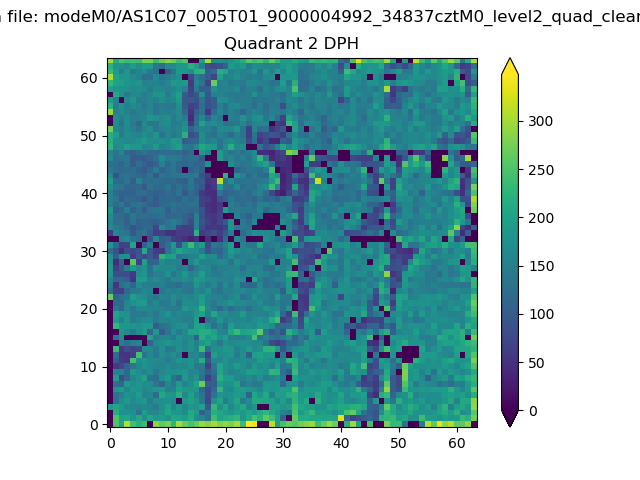
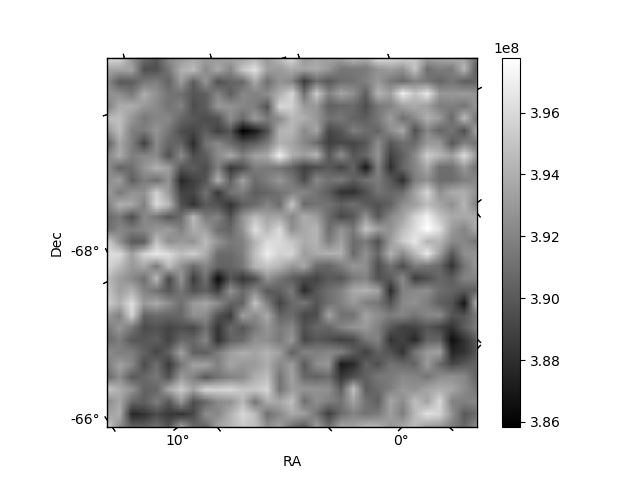
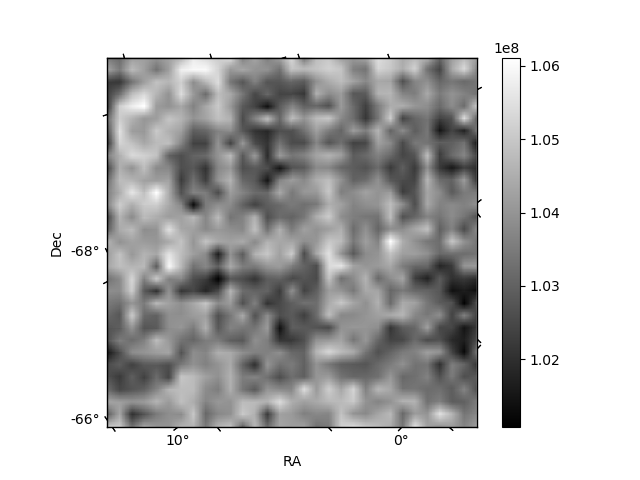
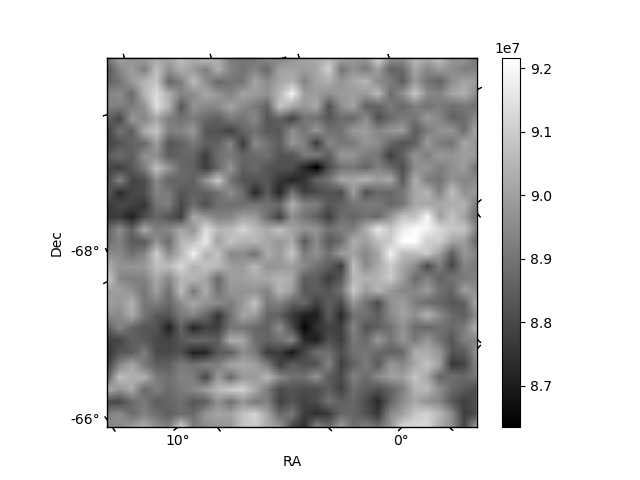
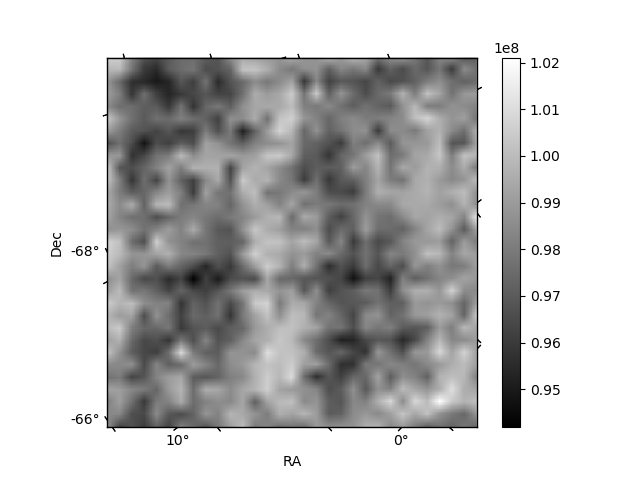
Histogram calculated using DETX and DETY for each event in the final _common_clean file
| Quadrant A | 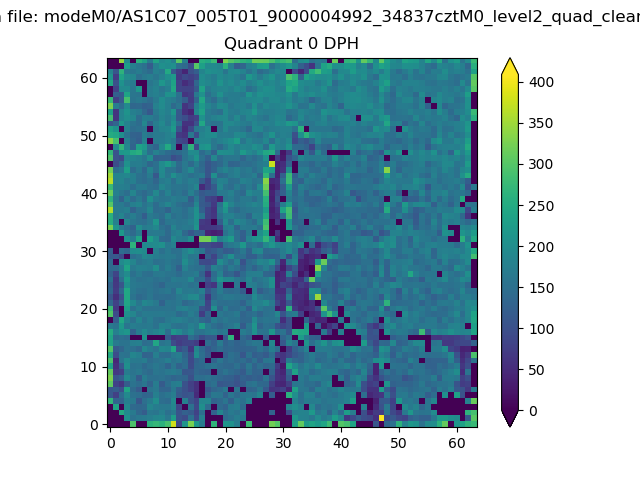 |
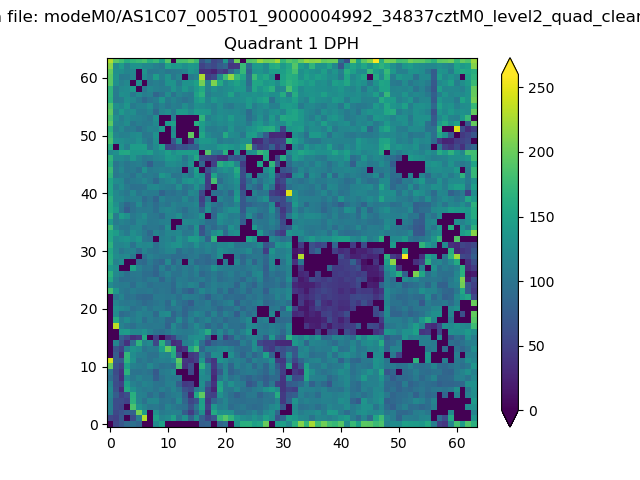 |
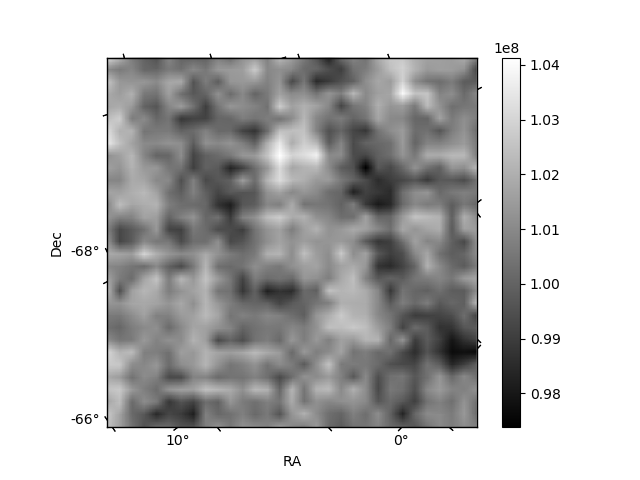
Quadrant B |
|---|---|---|---|
| Quadrant D | 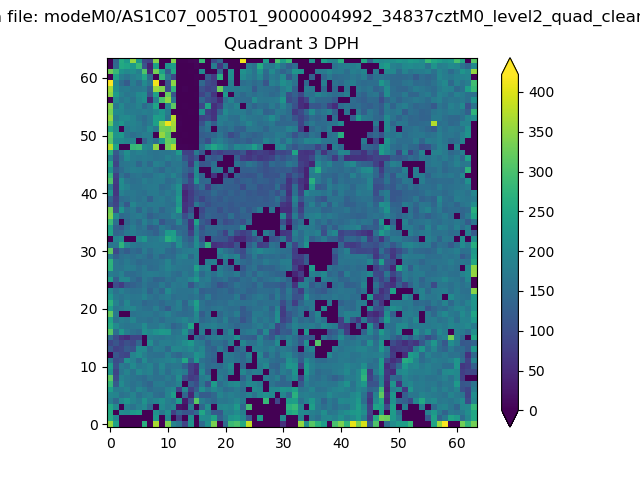 |
 |
Quadrant C |
| Plot type | Count rate plots | Images |
|---|---|---|
| Comparison with Poisson distribution Blue bars denote a histogram of data divided into 1 sec bins. Red curve is a Poisson curve with rate = median count rate of data. |
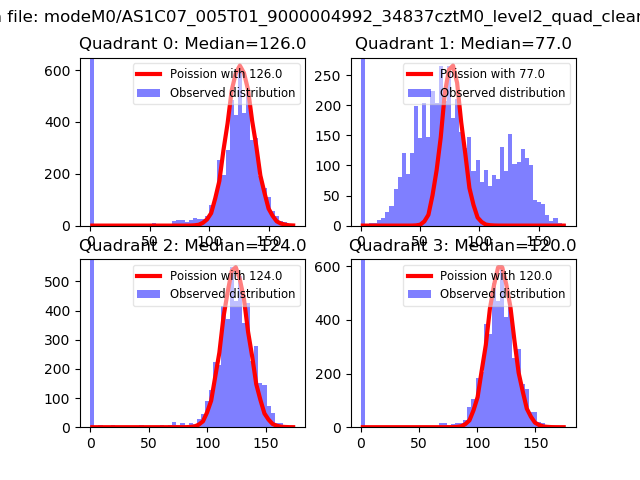 |
 |
| Quadrant-wise count rates Data is divided into 100 sec bins |
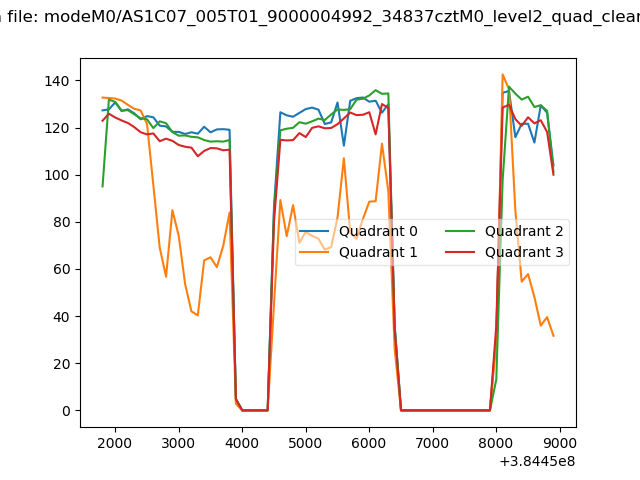 |
|
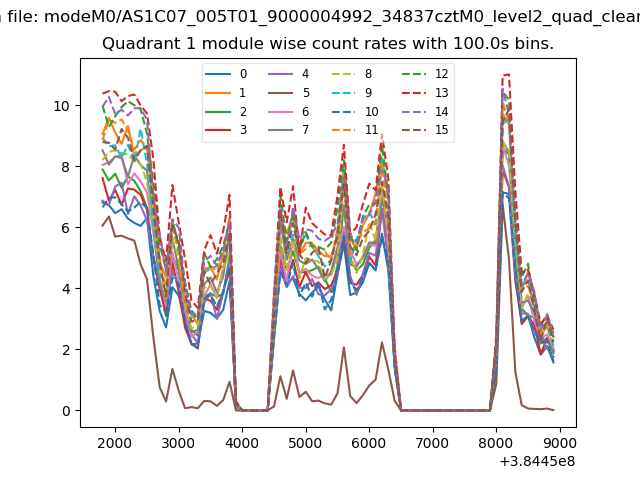
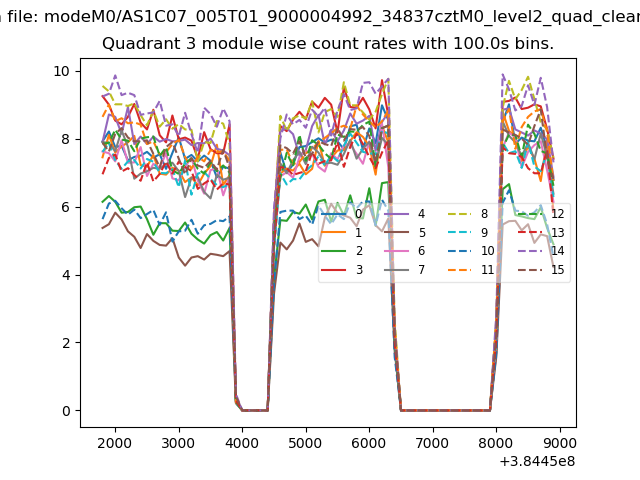
| Module-wise count rates for Quadrant A Data is divided into 100 sec bins |
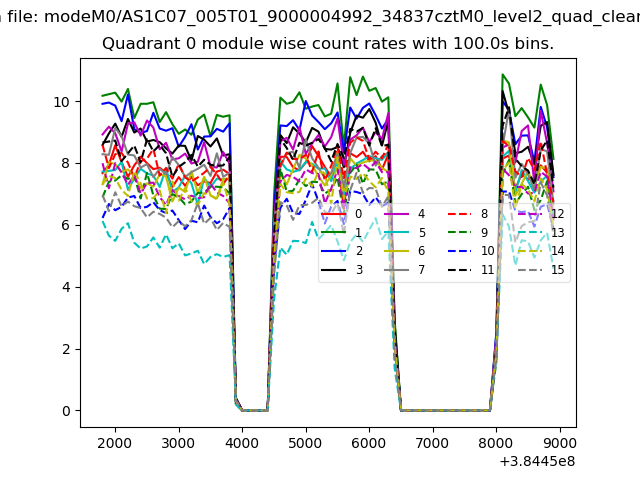 |
 |
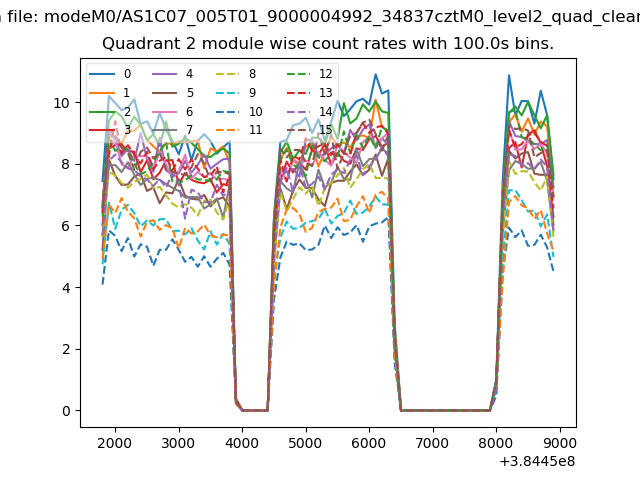
| Module-wise count rates for Quadrant B Data is divided into 100 sec bins |
 |
 |
| Module-wise count rates for Quadrant C Data is divided into 100 sec bins |
 |
 |
| Module-wise count rates for Quadrant D Data is divided into 100 sec bins |
 |
 |
| Parameter | Plot |
|---|---|
| CZT HV Monitor | 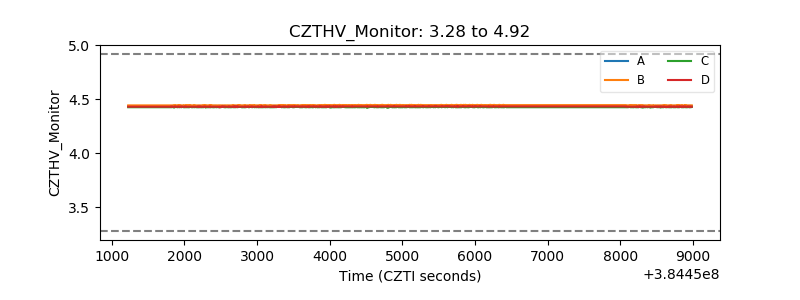 |
| D_VDD | 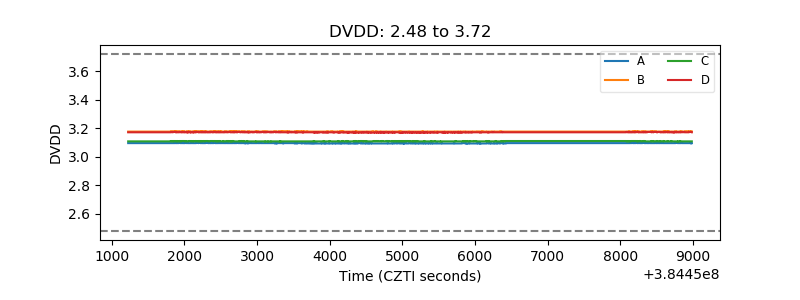 |
| Temperature 1 | 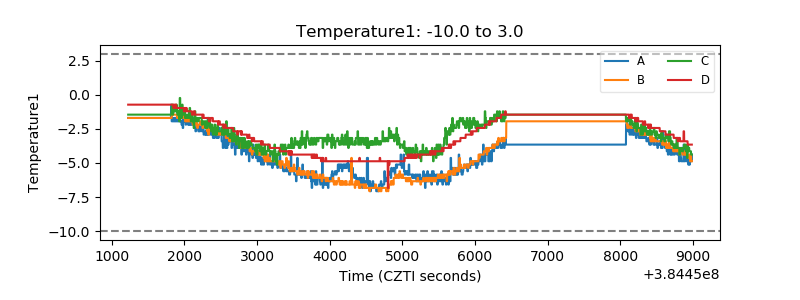 |
| Veto HV Monitor | 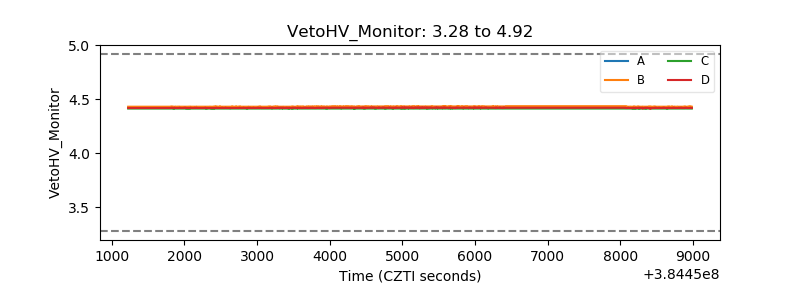 |
| Veto LLD | 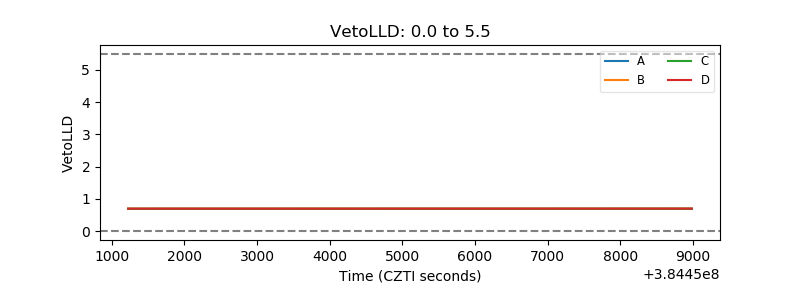 |
| Alpha Counter | 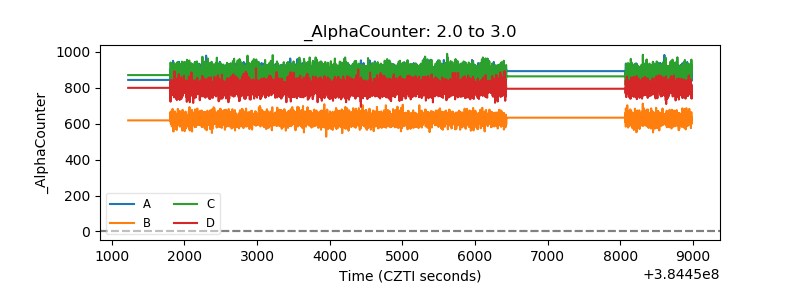 |
| _CPM_Rate | 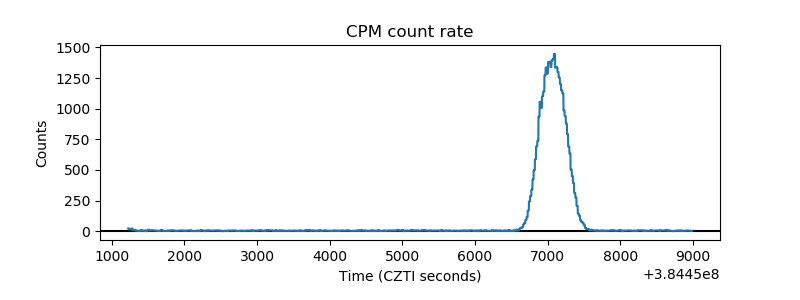 |
| CZT Counter | 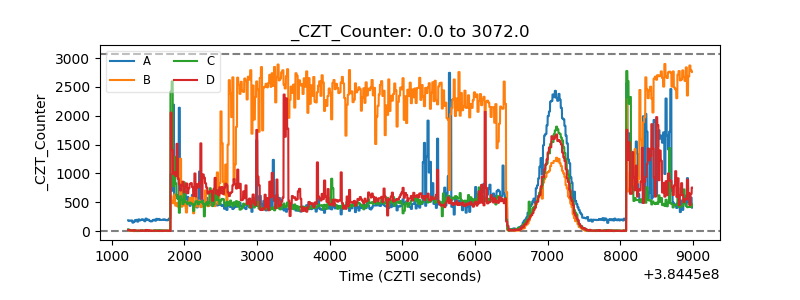 |
| +2.5 Volts monitor | 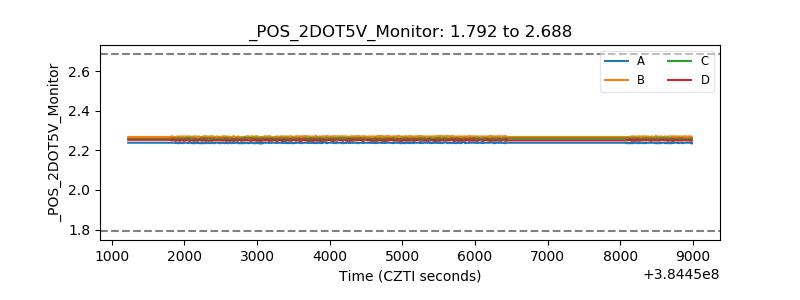 |
| +5 Volts monitor | 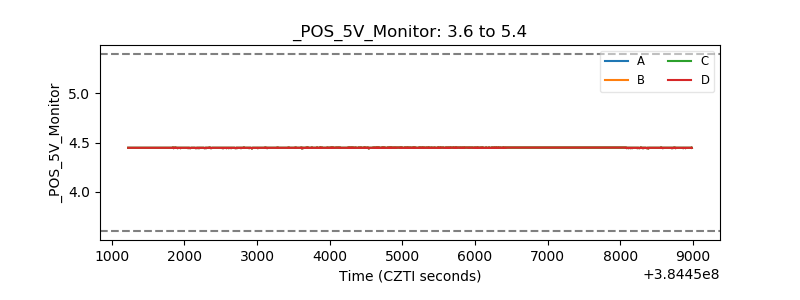 |
| _ROLL_ROT | 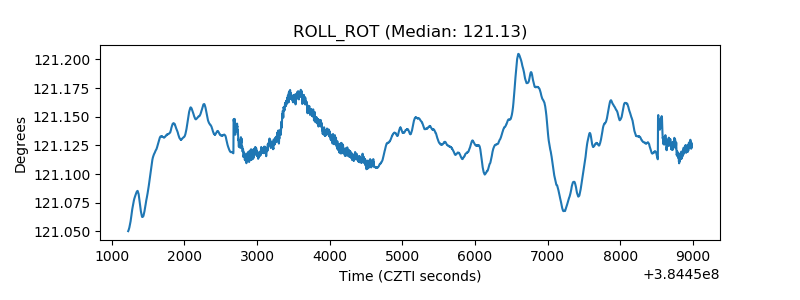 |
| _Roll_DEC | 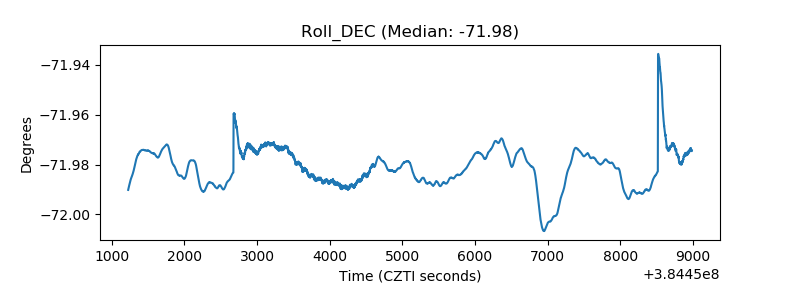 |
| _Roll_RA | 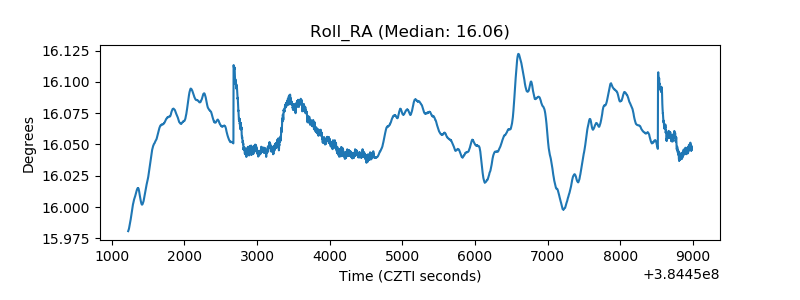 |
| Veto Counter | 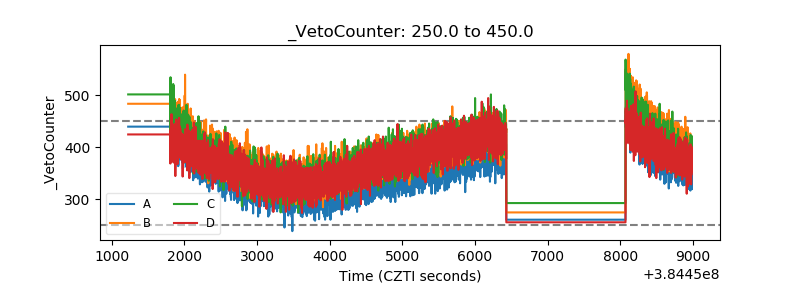 |