| Param | Original file | Final file |
|---|---|---|
| Filename | modeM0/AS1C07_005T01_9000004992_34836cztM0_level2.evt | modeM0/AS1C07_005T01_9000004992_34836cztM0_level2_quad_clean.evt |
| Size (bytes) | 1,547,274,240 | 247,576,320 |
| Size | 1.4 GB | 236.1 MB |
| Events in quadrant A | 13,630,383 | 1,537,454 |
| Events in quadrant B | 13,674,426 | 1,622,463 |
| Events in quadrant C | 8,001,440 | 1,677,218 |
| Events in quadrant D | 10,512,274 | 1,593,526 |
| Mode M9 | |||
|---|---|---|---|
| Quadrant | BADHDUFLAG | Total packets | Discarded packets |
| A | 0 | 47 | 0 |
| B | 0 | 47 | 0 |
| C | 0 | 47 | 0 |
| D | 0 | 48 | 0 |
| Mode M0 | |||
|---|---|---|---|
| Quadrant | BADHDUFLAG | Total packets | Discarded packets |
| A | 0 | 51096 | 5 |
| B | 0 | 50603 | 4 |
| C | 0 | 33216 | 4 |
| D | 0 | 41862 | 4 |
| Mode SS | |||
|---|---|---|---|
| Quadrant | BADHDUFLAG | Total packets | Discarded packets |
| A | 0 | 314 | 0 |
| B | 0 | 314 | 0 |
| C | 0 | 314 | 0 |
| D | 0 | 314 | 0 |
| Quadrant | Total seconds | Saturated seconds | Saturation percentage |
|---|---|---|---|
| A | 15458 | 2596 | 16.793893% |
| B | 15458 | 1850 | 11.967913% |
| C | 15458 | 129 | 0.834519% |
| D | 15458 | 367 | 2.374175% |
Noise dominated data is calculated using 1-second bins in cleaned event files. If a bin has >2000 counts, and if more than 50% of those come from <1% of pixels, then it is considered to be noise-dominated and hence unusable.
| Quadrant | # 1 sec bins | Bins with >0 counts | Bins with >2000 counts | High rate bins dominated by noise | Noise dominated (total time) | Noise dominated (detector-on time) | Marked lightcurve |
|---|---|---|---|---|---|---|---|
| A | 19724 | 15461 | 2133 | 2133 | 10.81% | 13.80% | 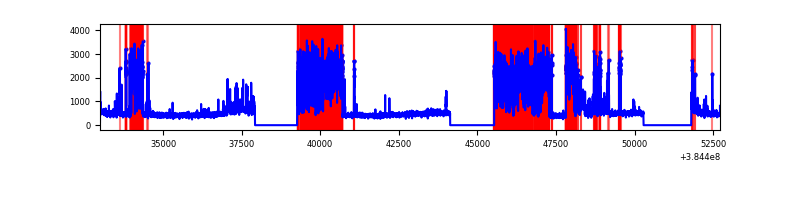 |
| B | 19723 | 15460 | 1591 | 1591 | 8.07% | 10.29% | 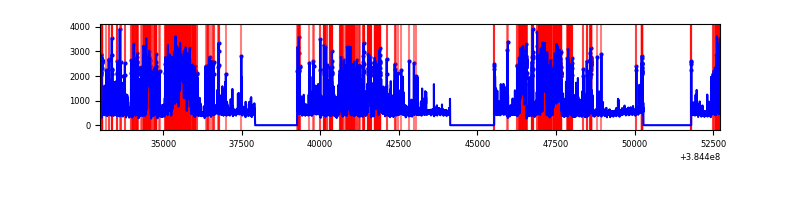 |
| C | 19724 | 15461 | 96 | 96 | 0.49% | 0.62% | 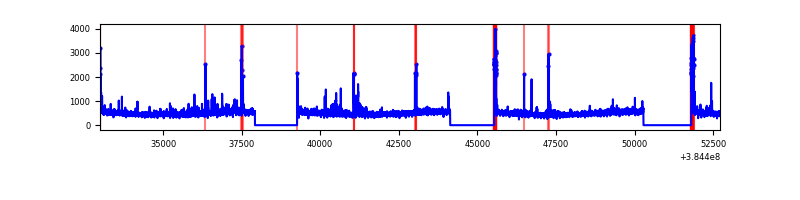 |
| D | 19724 | 15461 | 340 | 340 | 1.72% | 2.20% | 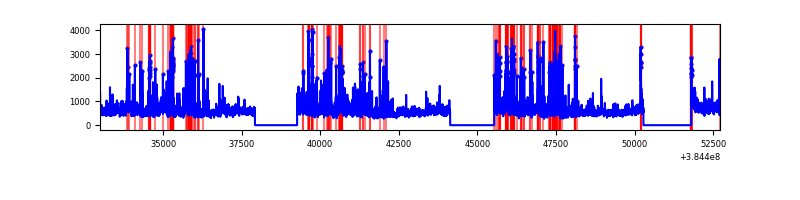 |
Top three noisy pixels from each quadrant. If the there are fewer than three noisy pixels in the level2.evt file, extra rows are filled as -1
| Pixel properties | Quadrant properties | ||||||
|---|---|---|---|---|---|---|---|
| Quadrant | DetID | PixID | Counts | Sigma | Mean | Median | Sigma |
| A | 15 | 169 | 7081429 | 21500.73 | 1642 | 1611 | 329.3 |
| A | 10 | 83 | 108676 | 325.14 | 1642 | 1611 | 329.3 |
| A | 13 | 6 | 28311 | 81.08 | 1642 | 1611 | 329.3 |
| B | 5 | 31 | 1590941 | 5002.63 | 1693 | 1650 | 317.7 |
| B | 5 | 15 | 1585844 | 4986.59 | 1693 | 1650 | 317.7 |
| B | 5 | 14 | 1554592 | 4888.22 | 1693 | 1650 | 317.7 |
| C | 15 | 214 | 702023 | 1783.43 | 1700 | 1710 | 392.7 |
| C | 0 | 10 | 392809 | 995.98 | 1700 | 1710 | 392.7 |
| C | 0 | 207 | 160602 | 404.64 | 1700 | 1710 | 392.7 |
| D | 8 | 195 | 1831038 | 4313.74 | 1686 | 1641 | 424.1 |
| D | 12 | 233 | 602702 | 1417.31 | 1686 | 1641 | 424.1 |
| D | 10 | 118 | 532520 | 1251.82 | 1686 | 1641 | 424.1 |
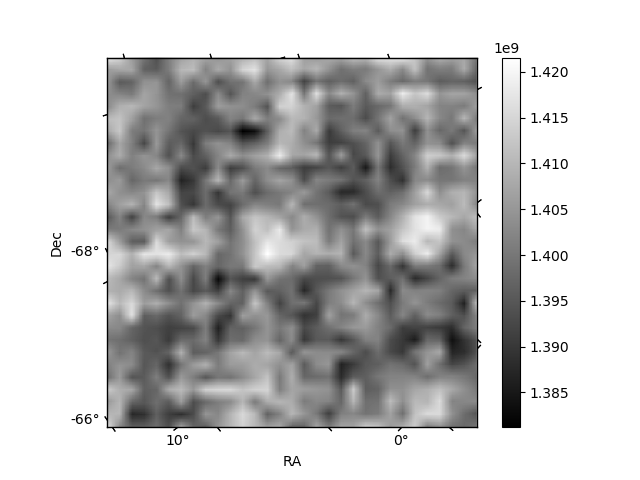
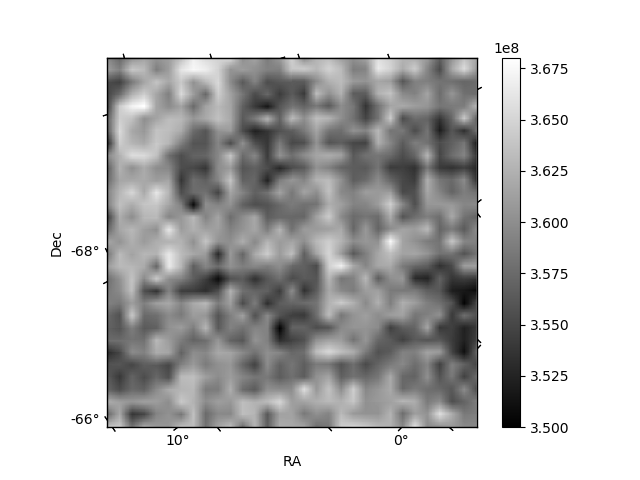
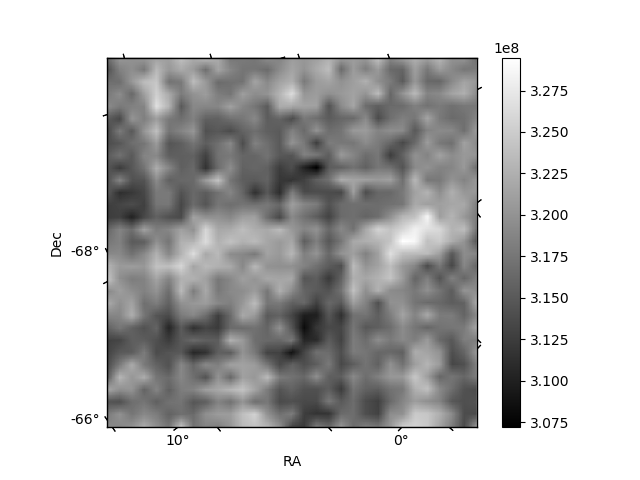
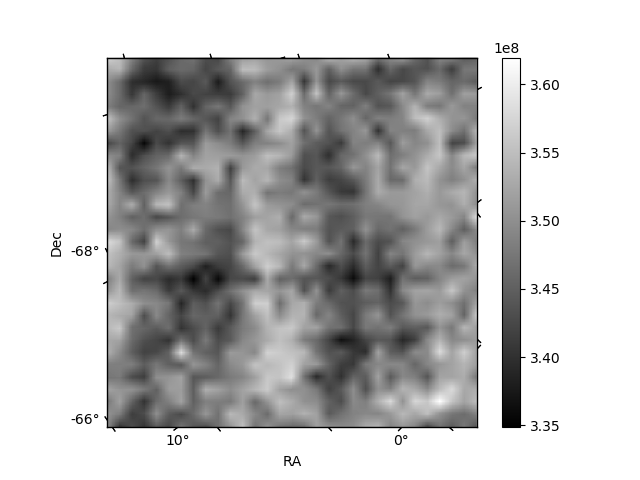
Histogram calculated using DETX and DETY for each event in the final _common_clean file
| Quadrant A | 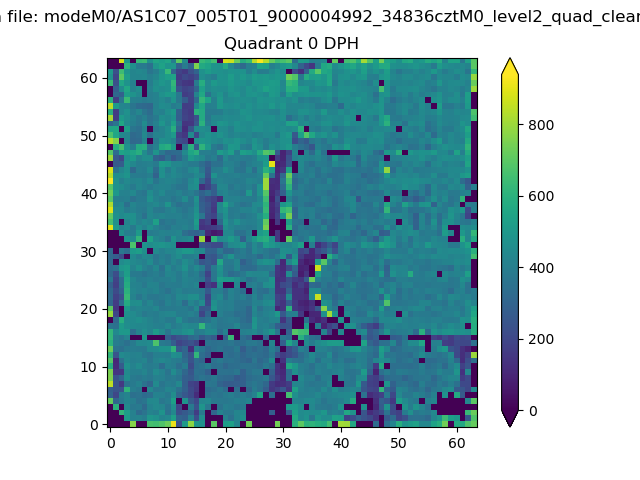 |
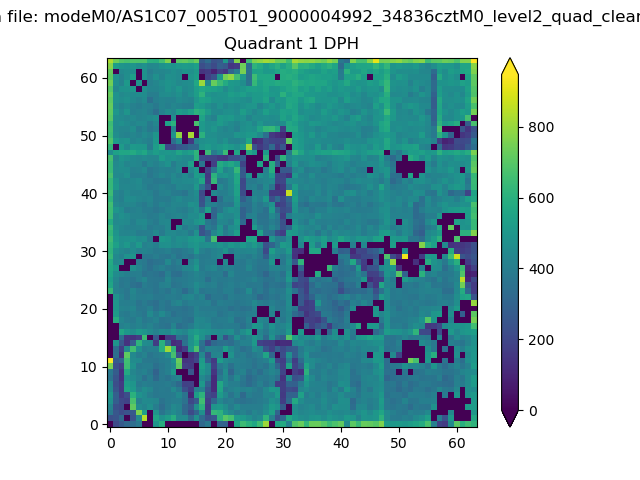 |
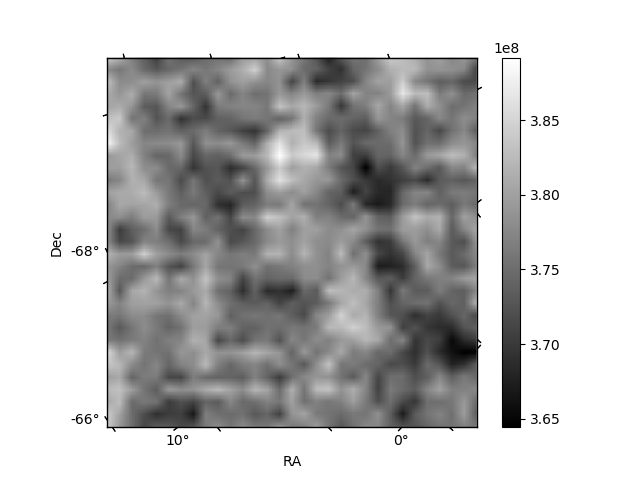
Quadrant B |
|---|---|---|---|
| Quadrant D | 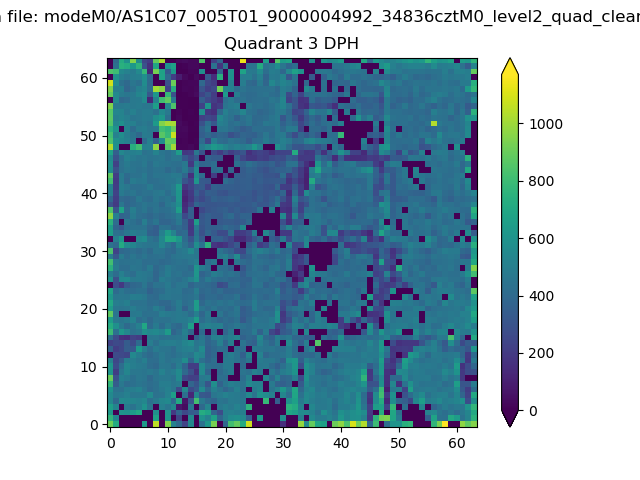 |
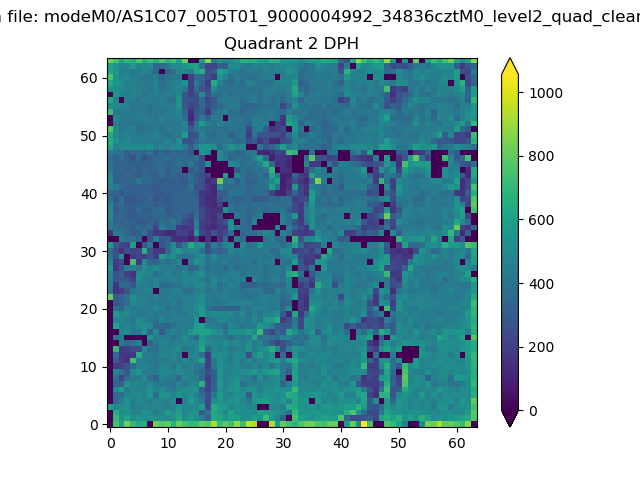 |
Quadrant C |
| Plot type | Count rate plots | Images |
|---|---|---|
| Comparison with Poisson distribution Blue bars denote a histogram of data divided into 1 sec bins. Red curve is a Poisson curve with rate = median count rate of data. |
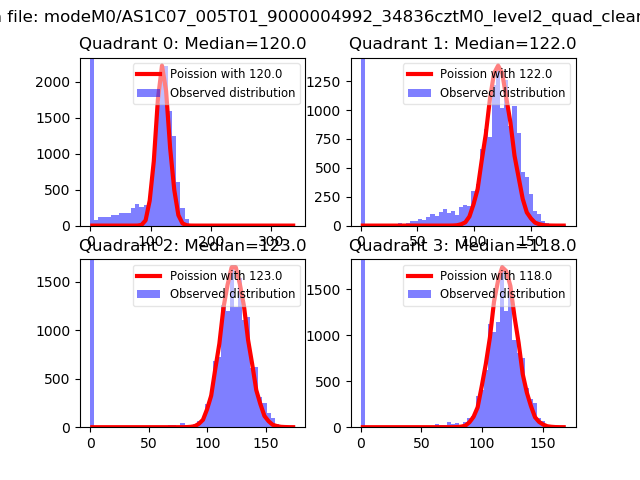 |
 |
| Quadrant-wise count rates Data is divided into 100 sec bins |
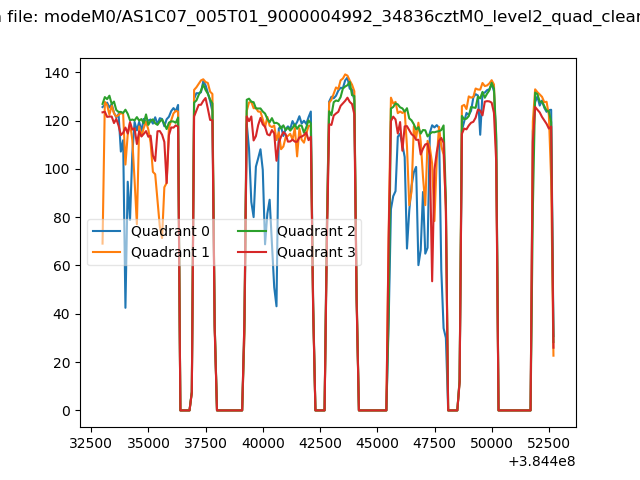 |
|
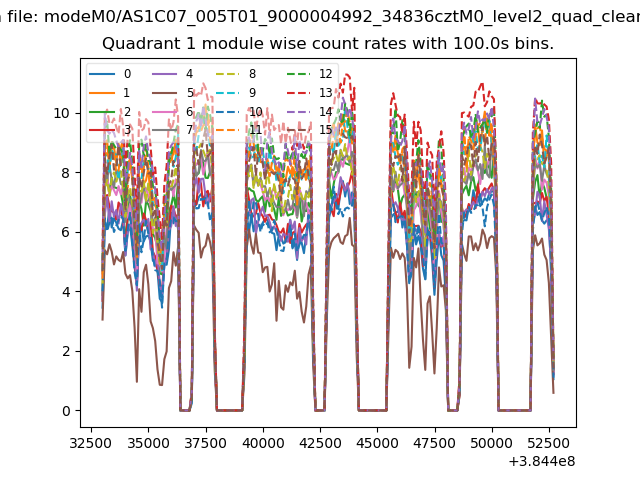
| Module-wise count rates for Quadrant A Data is divided into 100 sec bins |
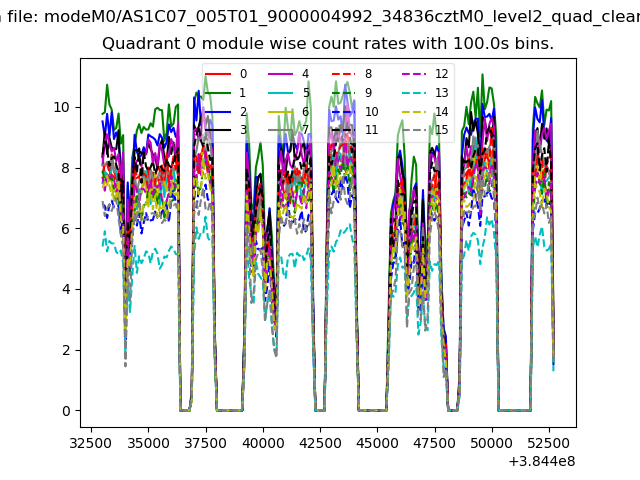 |
 |
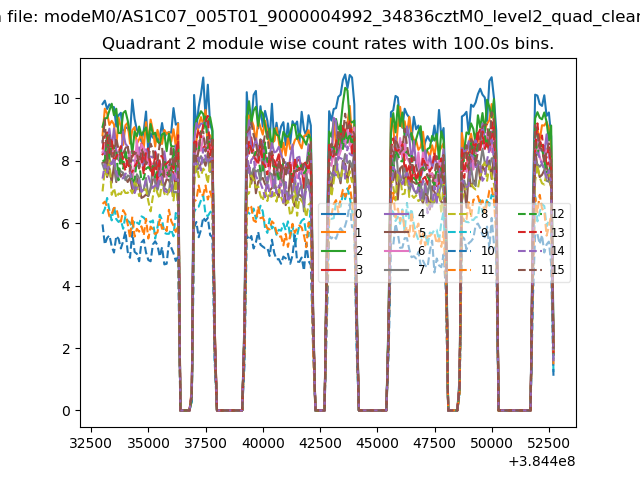
| Module-wise count rates for Quadrant B Data is divided into 100 sec bins |
 |
 |
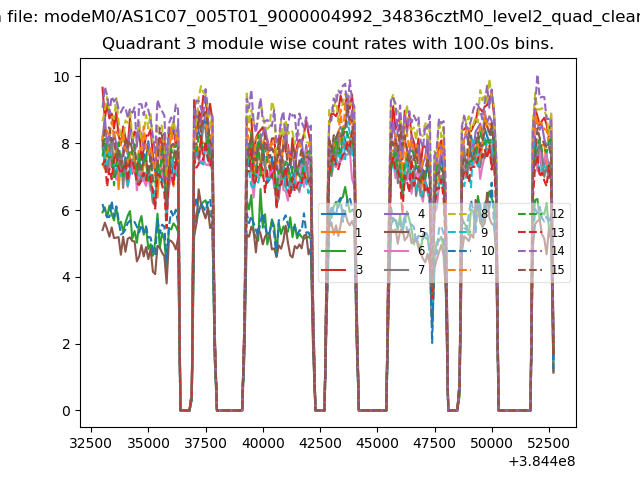
| Module-wise count rates for Quadrant C Data is divided into 100 sec bins |
 |
 |
| Module-wise count rates for Quadrant D Data is divided into 100 sec bins |
 |
 |
| Parameter | Plot |
|---|---|
| CZT HV Monitor | 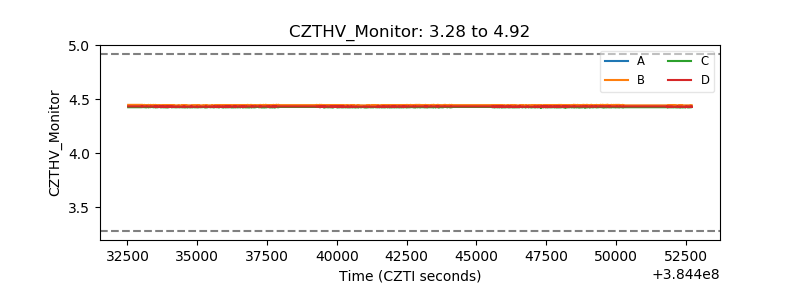 |
| D_VDD | 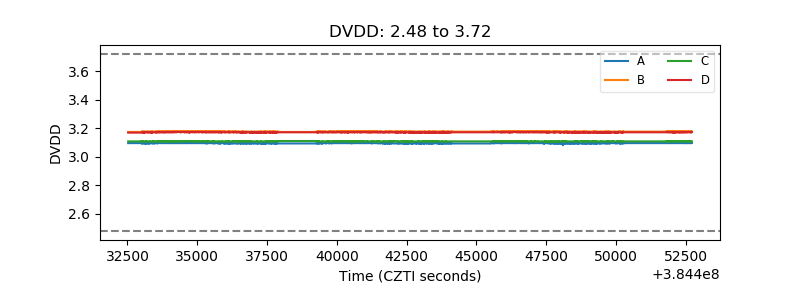 |
| Temperature 1 | 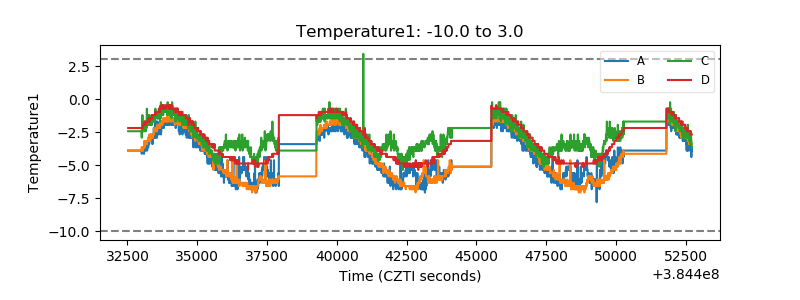 |
| Veto HV Monitor | 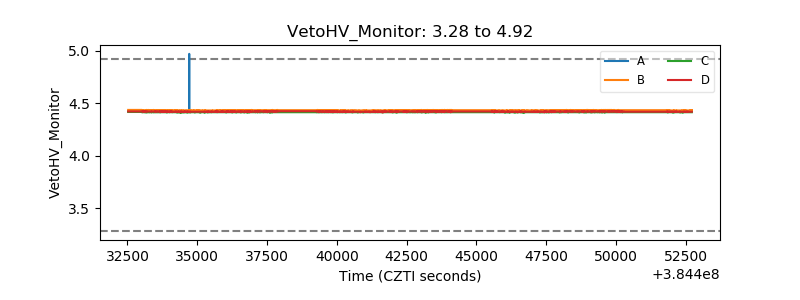 |
| Veto LLD | 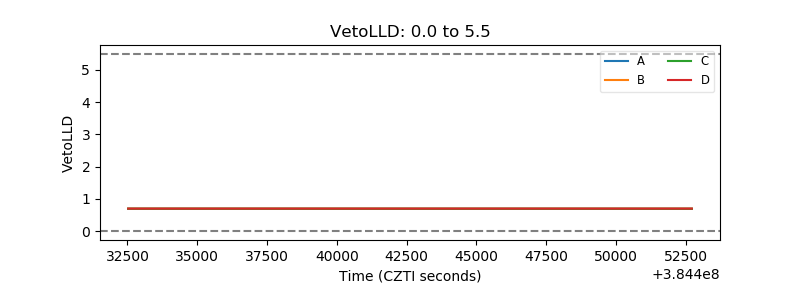 |
| Alpha Counter | 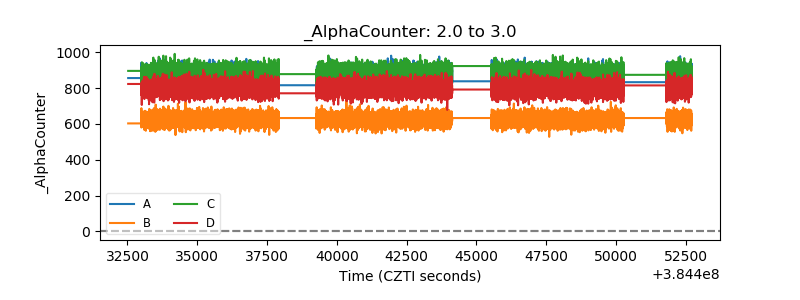 |
| _CPM_Rate |  |
| CZT Counter | 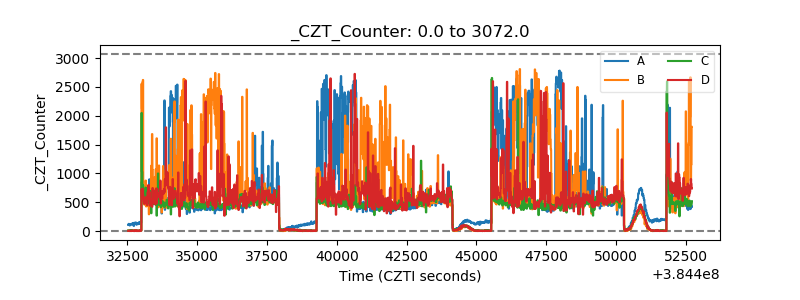 |
| +2.5 Volts monitor | 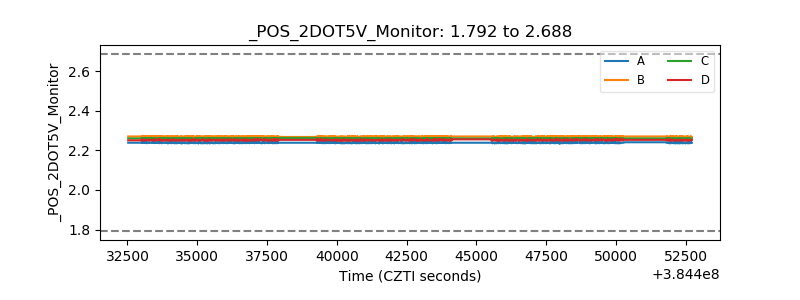 |
| +5 Volts monitor | 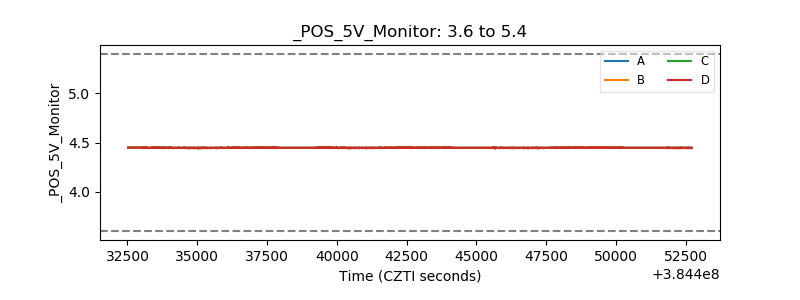 |
| _ROLL_ROT | 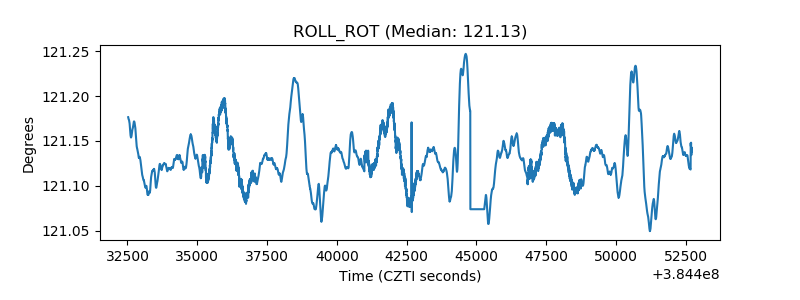 |
| _Roll_DEC | 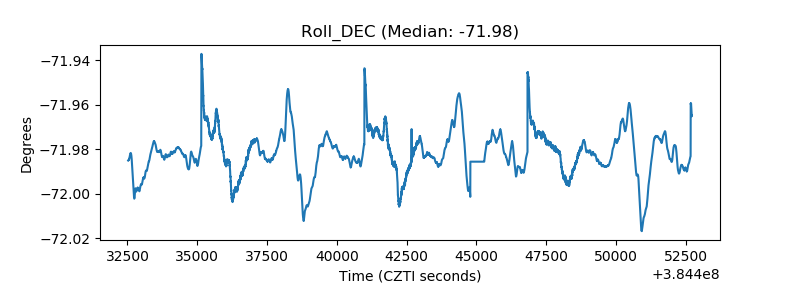 |
| _Roll_RA | 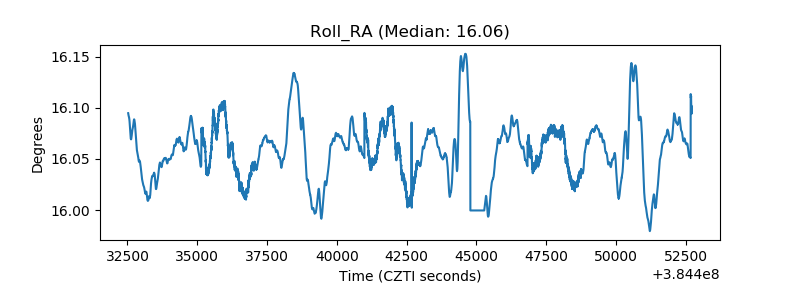 |
| Veto Counter | 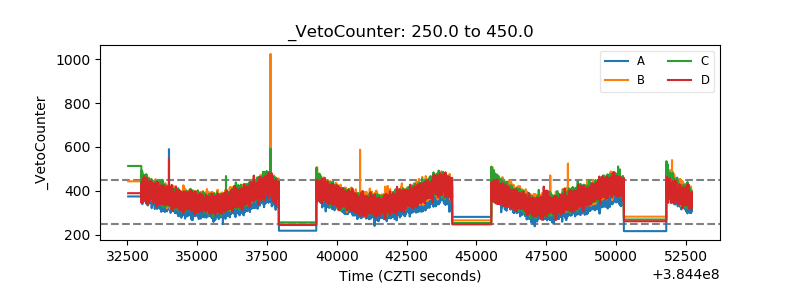 |