| Param | Original file | Final file |
|---|---|---|
| Filename | modeM0/AS1C07_005T01_9000004992_34833cztM0_level2.evt | modeM0/AS1C07_005T01_9000004992_34833cztM0_level2_quad_clean.evt |
| Size (bytes) | 692,403,840 | 94,867,200 |
| Size | 660.3 MB | 90.5 MB |
| Events in quadrant A | 4,842,709 | 641,051 |
| Events in quadrant B | 8,293,311 | 509,160 |
| Events in quadrant C | 3,130,515 | 672,732 |
| Events in quadrant D | 4,298,369 | 630,839 |
| Mode M9 | |||
|---|---|---|---|
| Quadrant | BADHDUFLAG | Total packets | Discarded packets |
| A | 0 | 16 | 0 |
| B | 0 | 16 | 0 |
| C | 0 | 16 | 0 |
| D | 0 | 17 | 0 |
| Mode M0 | |||
|---|---|---|---|
| Quadrant | BADHDUFLAG | Total packets | Discarded packets |
| A | 0 | 18234 | 3 |
| B | 0 | 28540 | 2 |
| C | 0 | 12860 | 2 |
| D | 0 | 17137 | 2 |
| Mode SS | |||
|---|---|---|---|
| Quadrant | BADHDUFLAG | Total packets | Discarded packets |
| A | 0 | 122 | 0 |
| B | 0 | 122 | 0 |
| C | 0 | 122 | 0 |
| D | 0 | 122 | 0 |
| Quadrant | Total seconds | Saturated seconds | Saturation percentage |
|---|---|---|---|
| A | 5978 | 713 | 11.927066% |
| B | 5978 | 2373 | 39.695550% |
| C | 5978 | 23 | 0.384744% |
| D | 5978 | 200 | 3.345601% |
Noise dominated data is calculated using 1-second bins in cleaned event files. If a bin has >2000 counts, and if more than 50% of those come from <1% of pixels, then it is considered to be noise-dominated and hence unusable.
| Quadrant | # 1 sec bins | Bins with >0 counts | Bins with >2000 counts | High rate bins dominated by noise | Noise dominated (total time) | Noise dominated (detector-on time) | Marked lightcurve |
|---|---|---|---|---|---|---|---|
| A | 7291 | 5978 | 615 | 615 | 8.44% | 10.29% | 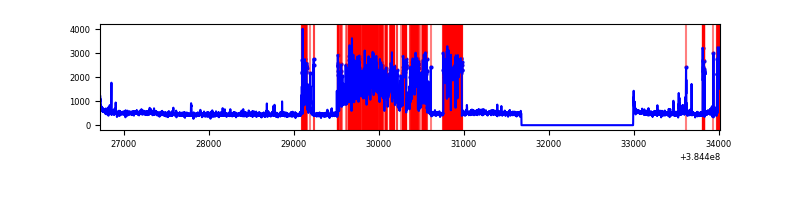 |
| B | 7292 | 5979 | 2234 | 2234 | 30.64% | 37.36% |  |
| C | 7292 | 5979 | 18 | 18 | 0.25% | 0.30% | 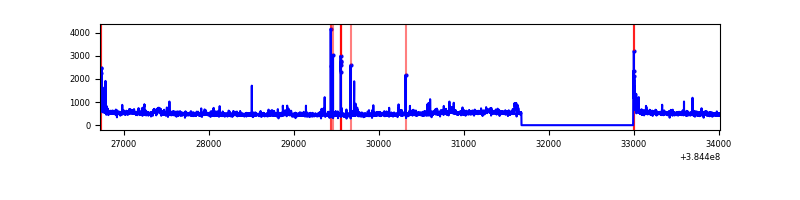 |
| D | 7292 | 5979 | 170 | 170 | 2.33% | 2.84% |  |
Top three noisy pixels from each quadrant. If the there are fewer than three noisy pixels in the level2.evt file, extra rows are filled as -1
| Pixel properties | Quadrant properties | ||||||
|---|---|---|---|---|---|---|---|
| Quadrant | DetID | PixID | Counts | Sigma | Mean | Median | Sigma |
| A | 15 | 169 | 2211597 | 16918.09 | 649 | 636 | 130.7 |
| A | 10 | 83 | 52011 | 393.12 | 649 | 636 | 130.7 |
| A | 7 | 16 | 29506 | 220.91 | 649 | 636 | 130.7 |
| B | 5 | 14 | 1588477 | 15286.26 | 542 | 527 | 103.9 |
| B | 5 | 31 | 1588439 | 15285.9 | 542 | 527 | 103.9 |
| B | 5 | 15 | 1583640 | 15239.7 | 542 | 527 | 103.9 |
| C | 15 | 214 | 276392 | 1794.57 | 665 | 671 | 153.6 |
| C | 0 | 207 | 130082 | 842.29 | 665 | 671 | 153.6 |
| C | 0 | 10 | 70291 | 453.13 | 665 | 671 | 153.6 |
| D | 8 | 195 | 807899 | 4981.36 | 659 | 639 | 162.1 |
| D | 12 | 233 | 265171 | 1632.35 | 659 | 639 | 162.1 |
| D | 2 | 250 | 137997 | 847.59 | 659 | 639 | 162.1 |
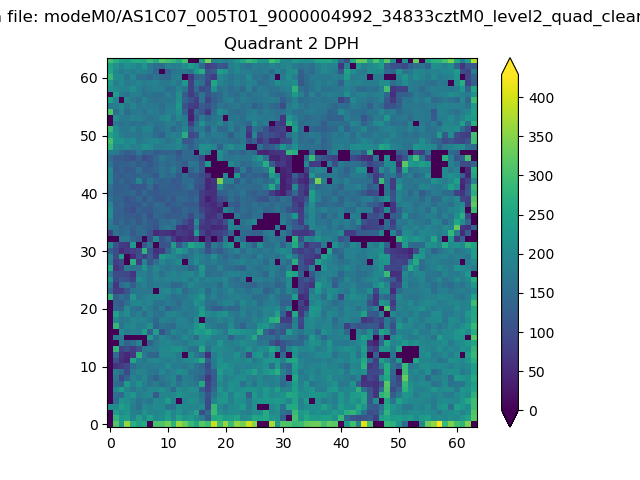
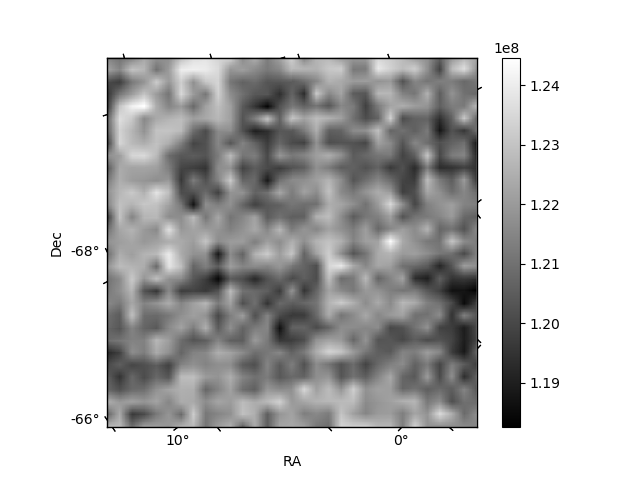
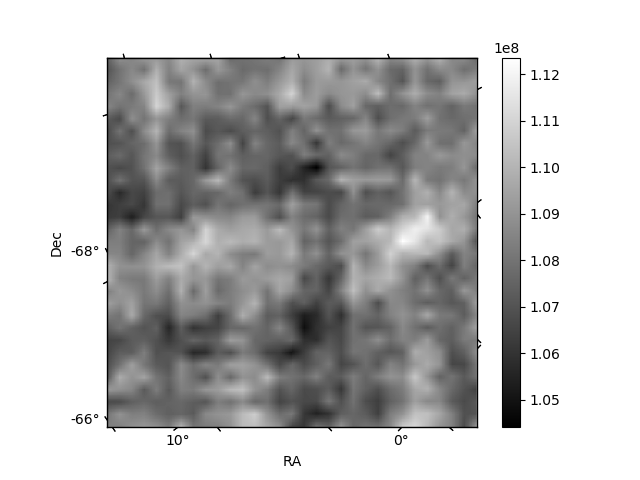
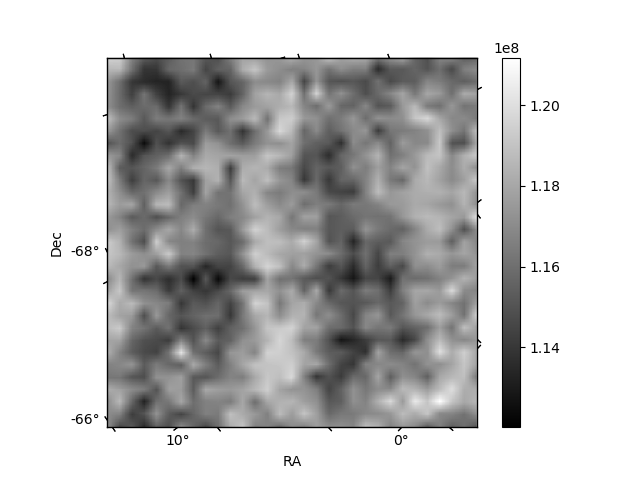
Histogram calculated using DETX and DETY for each event in the final _common_clean file
| Quadrant A | 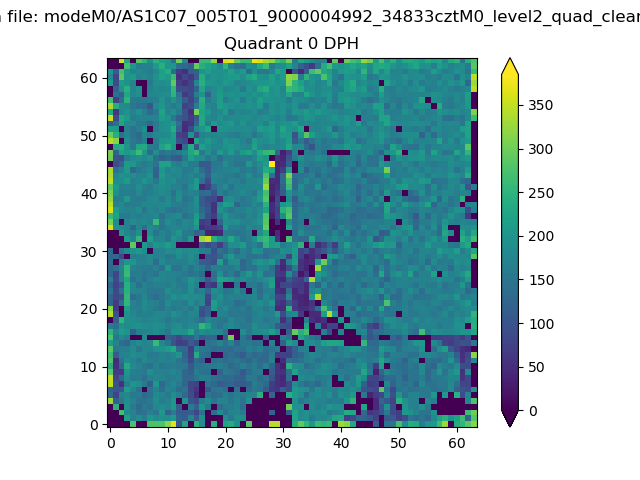 |
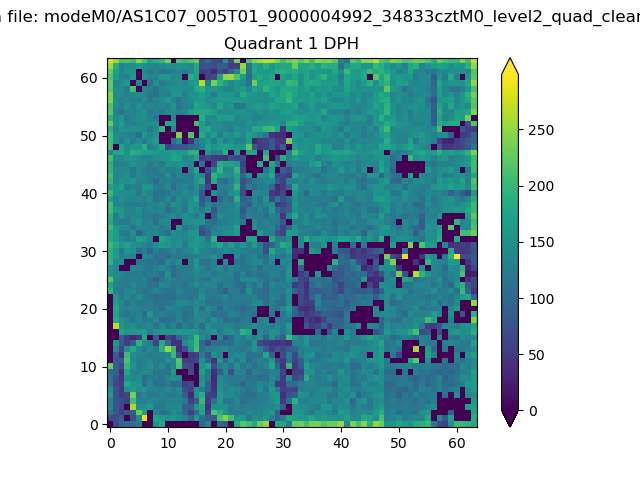 |
Quadrant B |
|---|---|---|---|
| Quadrant D | 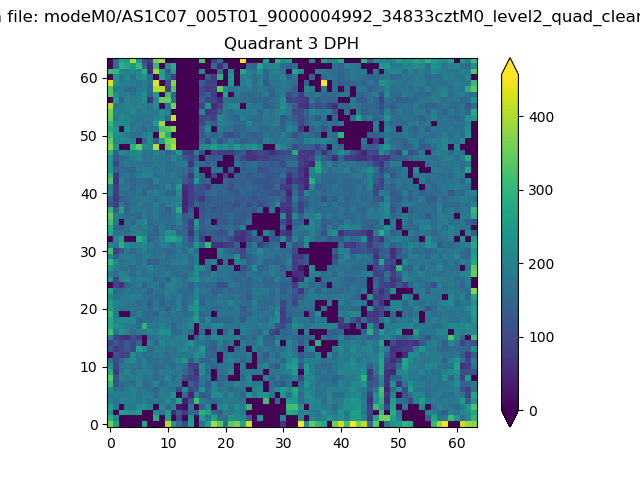 |
 |
Quadrant C |
| Plot type | Count rate plots | Images |
|---|---|---|
| Comparison with Poisson distribution Blue bars denote a histogram of data divided into 1 sec bins. Red curve is a Poisson curve with rate = median count rate of data. |
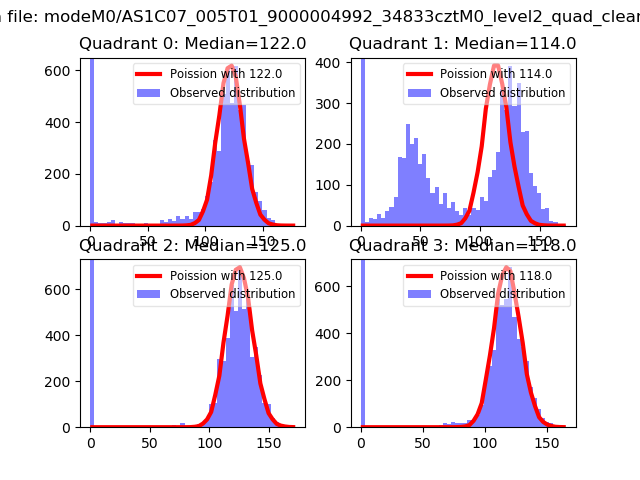 |
 |
| Quadrant-wise count rates Data is divided into 100 sec bins |
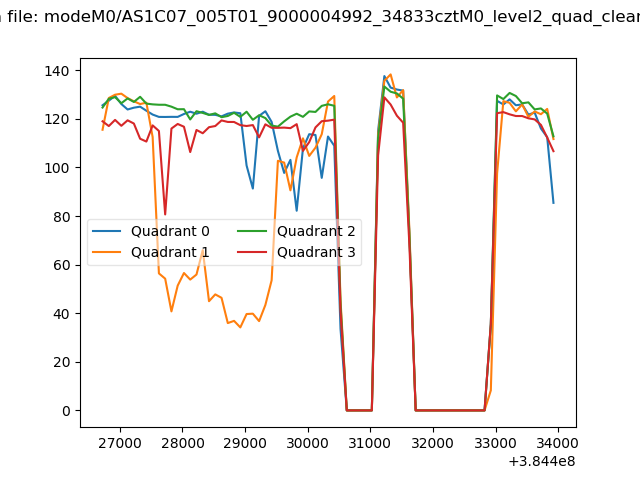 |
|
| Module-wise count rates for Quadrant A Data is divided into 100 sec bins |
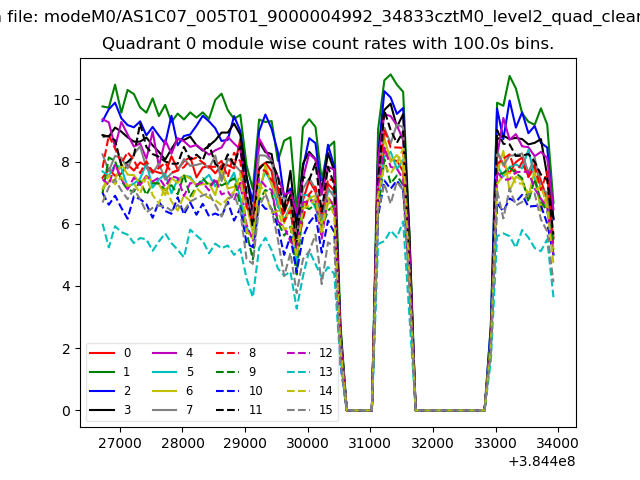 |
 |
| Module-wise count rates for Quadrant B Data is divided into 100 sec bins |
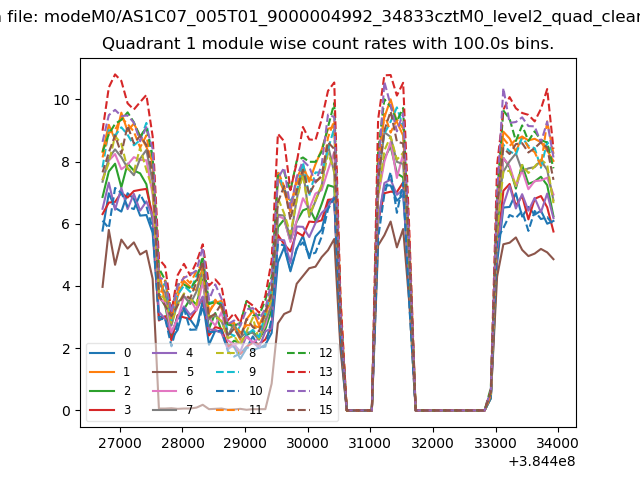 |
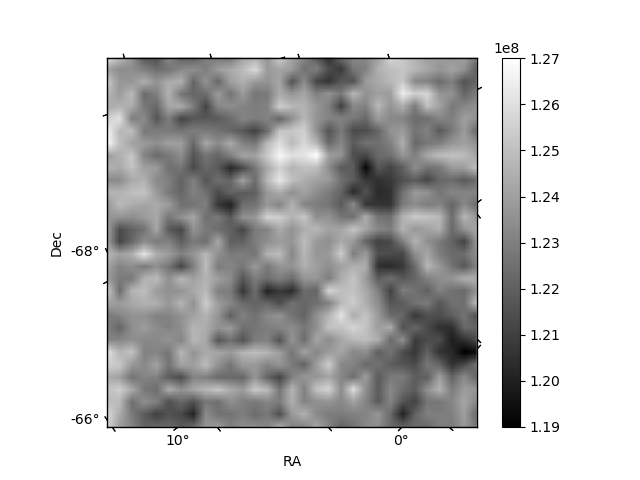 |
| Module-wise count rates for Quadrant C Data is divided into 100 sec bins |
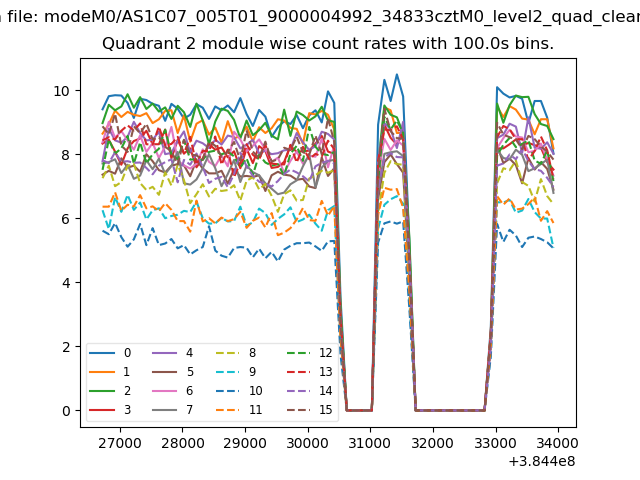 |
 |
| Module-wise count rates for Quadrant D Data is divided into 100 sec bins |
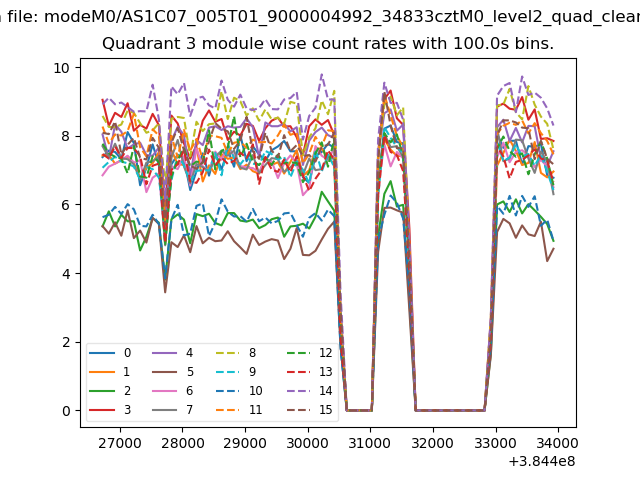 |
 |
| Parameter | Plot |
|---|---|
| CZT HV Monitor | 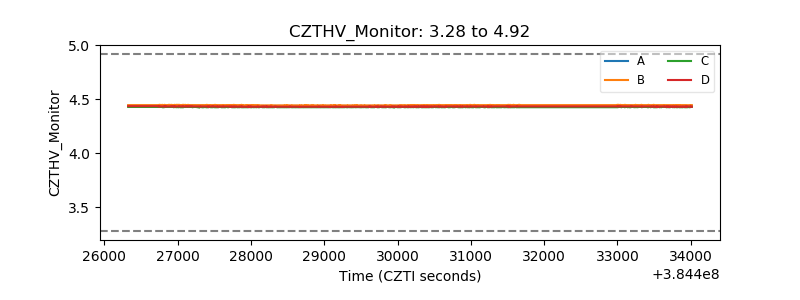 |
| D_VDD | 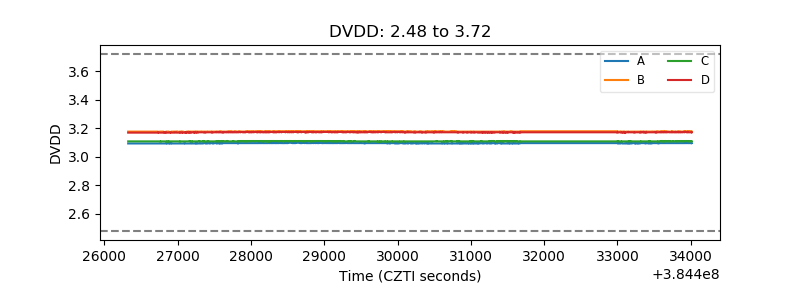 |
| Temperature 1 | 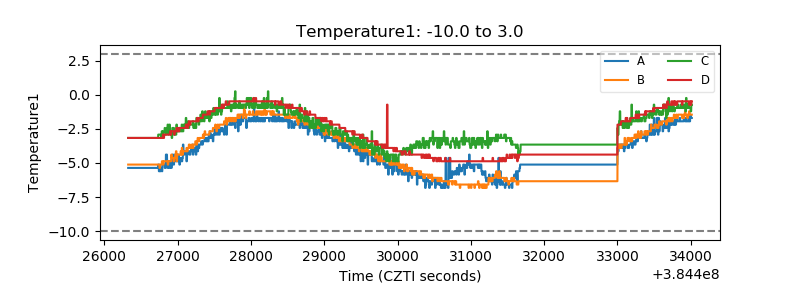 |
| Veto HV Monitor | 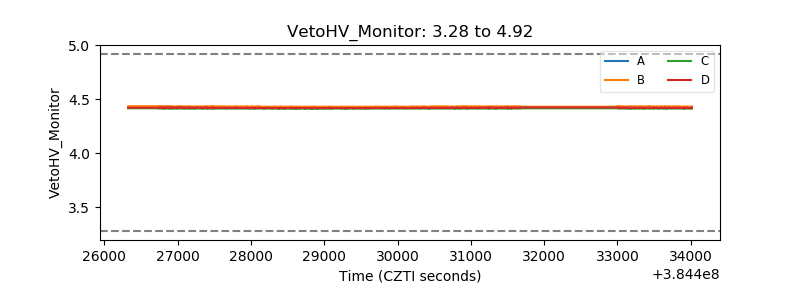 |
| Veto LLD | 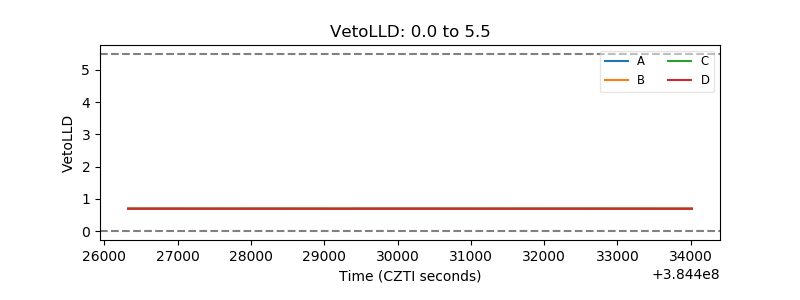 |
| Alpha Counter | 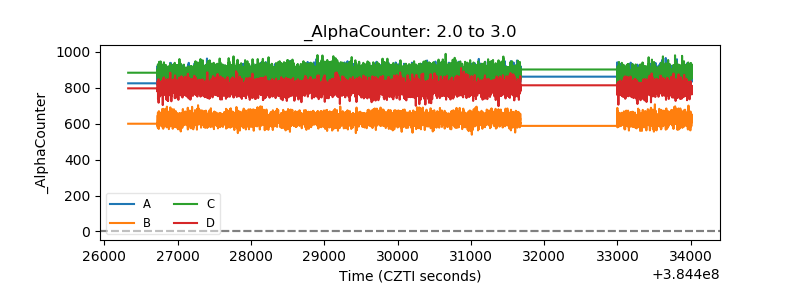 |
| _CPM_Rate | 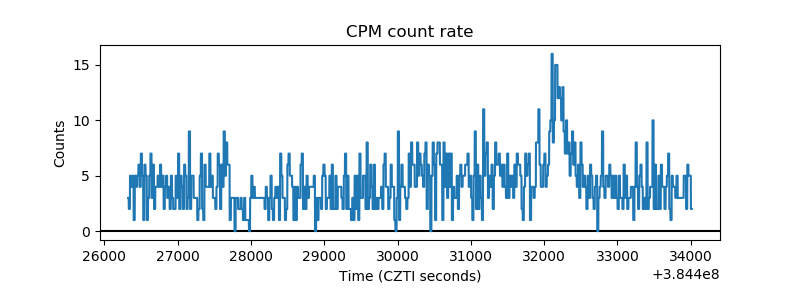 |
| CZT Counter | 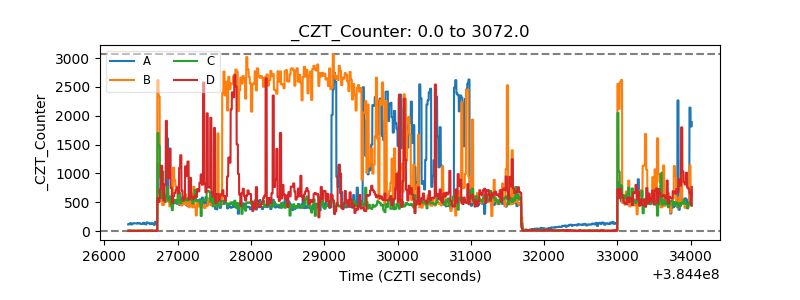 |
| +2.5 Volts monitor |  |
| +5 Volts monitor | 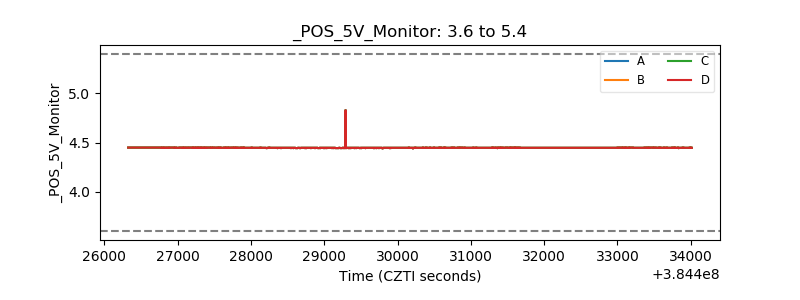 |
| _ROLL_ROT | 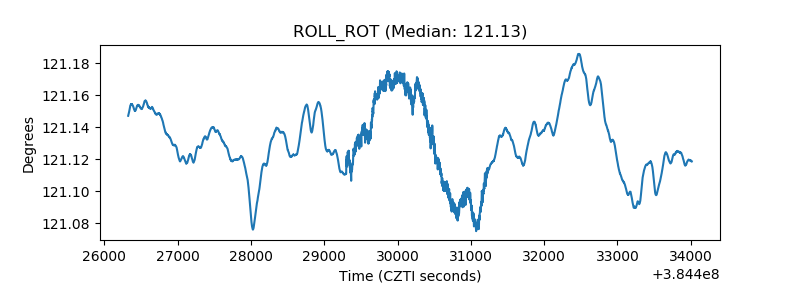 |
| _Roll_DEC | 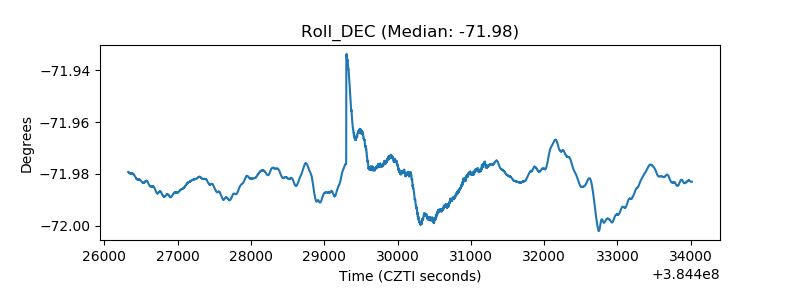 |
| _Roll_RA | 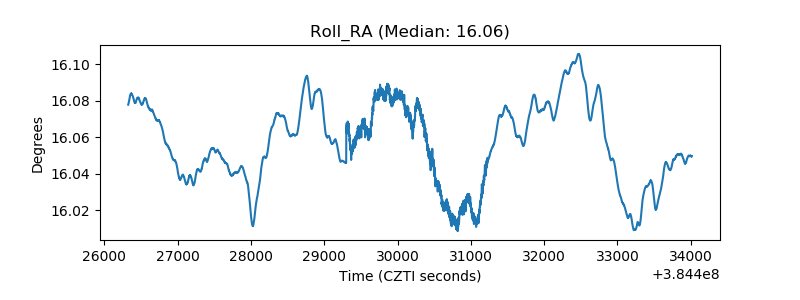 |
| Veto Counter | 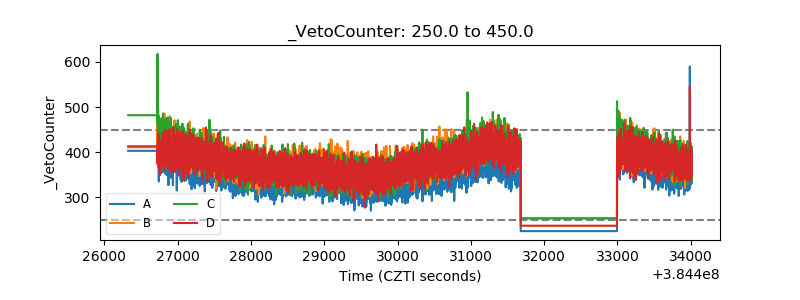 |