| Param | Original file | Final file |
|---|---|---|
| Filename | modeM0/AS1C07_005T01_9000004992_34831cztM0_level2.evt | modeM0/AS1C07_005T01_9000004992_34831cztM0_level2_quad_clean.evt |
| Size (bytes) | 765,578,880 | 85,633,920 |
| Size | 730.1 MB | 81.7 MB |
| Events in quadrant A | 2,544,607 | 678,672 |
| Events in quadrant B | 13,938,408 | 220,906 |
| Events in quadrant C | 2,807,164 | 679,460 |
| Events in quadrant D | 3,536,662 | 640,418 |
| Mode M9 | |||
|---|---|---|---|
| Quadrant | BADHDUFLAG | Total packets | Discarded packets |
| A | 0 | 17 | 0 |
| B | 0 | 17 | 0 |
| C | 0 | 17 | 0 |
| D | 0 | 17 | 0 |
| Mode M0 | |||
|---|---|---|---|
| Quadrant | BADHDUFLAG | Total packets | Discarded packets |
| A | 0 | 10887 | 2 |
| B | 0 | 45019 | 1 |
| C | 0 | 11389 | 1 |
| D | 0 | 13927 | 1 |
| Mode SS | |||
|---|---|---|---|
| Quadrant | BADHDUFLAG | Total packets | Discarded packets |
| A | 0 | 108 | 0 |
| B | 0 | 108 | 0 |
| C | 0 | 108 | 0 |
| D | 0 | 108 | 0 |
| Quadrant | Total seconds | Saturated seconds | Saturation percentage |
|---|---|---|---|
| A | 5302 | 12 | 0.226330% |
| B | 5302 | 5302 | 100.000000% |
| C | 5302 | 65 | 1.225952% |
| D | 5302 | 88 | 1.659751% |
Noise dominated data is calculated using 1-second bins in cleaned event files. If a bin has >2000 counts, and if more than 50% of those come from <1% of pixels, then it is considered to be noise-dominated and hence unusable.
| Quadrant | # 1 sec bins | Bins with >0 counts | Bins with >2000 counts | High rate bins dominated by noise | Noise dominated (total time) | Noise dominated (detector-on time) | Marked lightcurve |
|---|---|---|---|---|---|---|---|
| A | 6974 | 5303 | 5 | 5 | 0.07% | 0.09% | 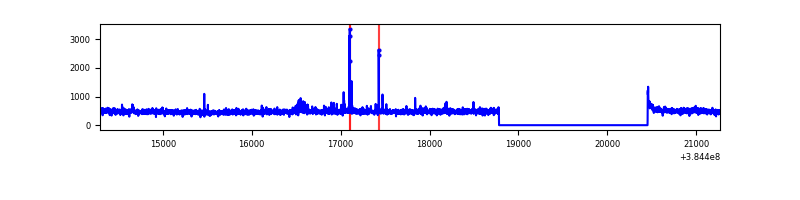 |
| B | 6973 | 5301 | 5243 | 5243 | 75.19% | 98.91% |  |
| C | 6974 | 5303 | 55 | 55 | 0.79% | 1.04% | 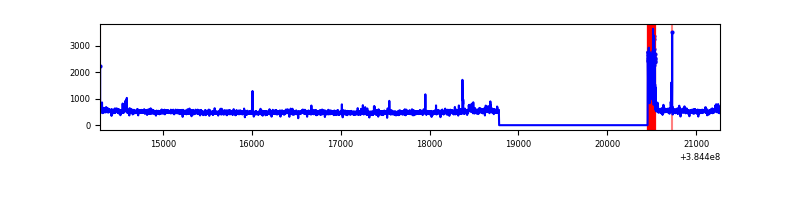 |
| D | 6974 | 5303 | 94 | 94 | 1.35% | 1.77% | 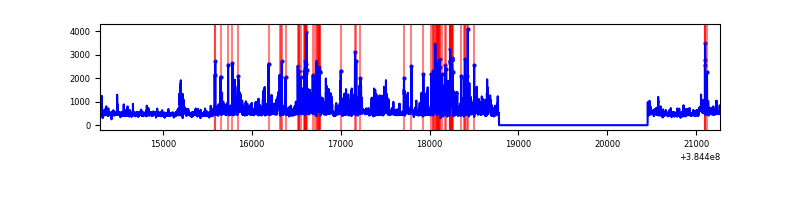 |
Top three noisy pixels from each quadrant. If the there are fewer than three noisy pixels in the level2.evt file, extra rows are filled as -1
| Pixel properties | Quadrant properties | ||||||
|---|---|---|---|---|---|---|---|
| Quadrant | DetID | PixID | Counts | Sigma | Mean | Median | Sigma |
| A | 15 | 169 | 46645 | 372.01 | 612 | 599 | 123.8 |
| A | 10 | 83 | 39557 | 314.75 | 612 | 599 | 123.8 |
| A | 13 | 6 | 30783 | 243.86 | 612 | 599 | 123.8 |
| B | 5 | 14 | 4249878 | 97832.74 | 220 | 214 | 43.4 |
| B | 5 | 31 | 4211841 | 96957.08 | 220 | 214 | 43.4 |
| B | 5 | 15 | 4203927 | 96774.89 | 220 | 214 | 43.4 |
| C | 15 | 214 | 244990 | 1793.16 | 591 | 594 | 136.3 |
| C | 0 | 10 | 159464 | 1165.64 | 591 | 594 | 136.3 |
| C | 8 | 111 | 30465 | 219.17 | 591 | 594 | 136.3 |
| D | 8 | 195 | 736446 | 5090.64 | 591 | 576 | 144.6 |
| D | 2 | 250 | 129372 | 890.99 | 591 | 576 | 144.6 |
| D | 13 | 249 | 120925 | 832.56 | 591 | 576 | 144.6 |
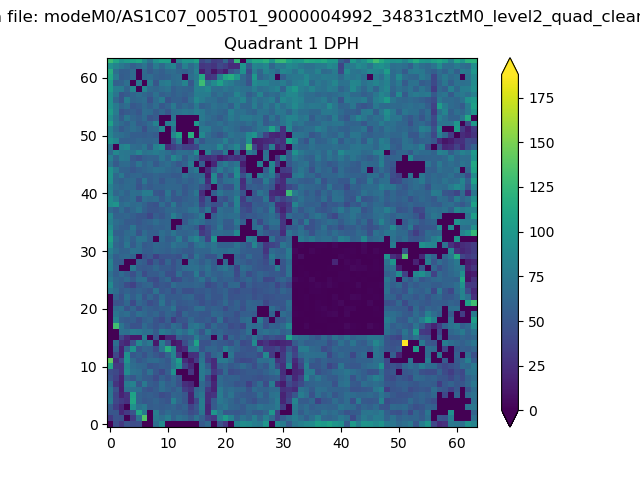
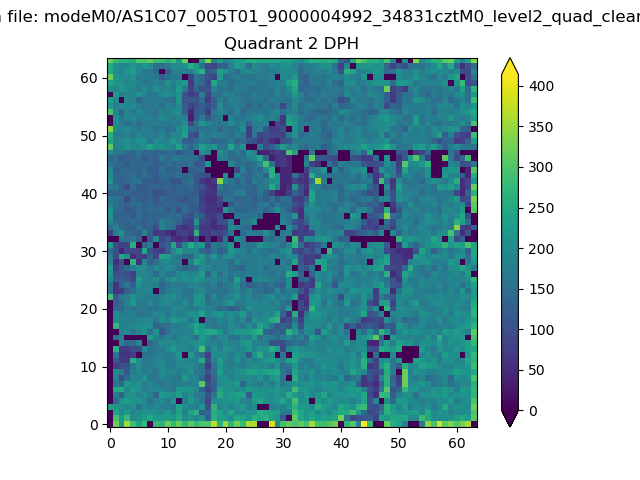
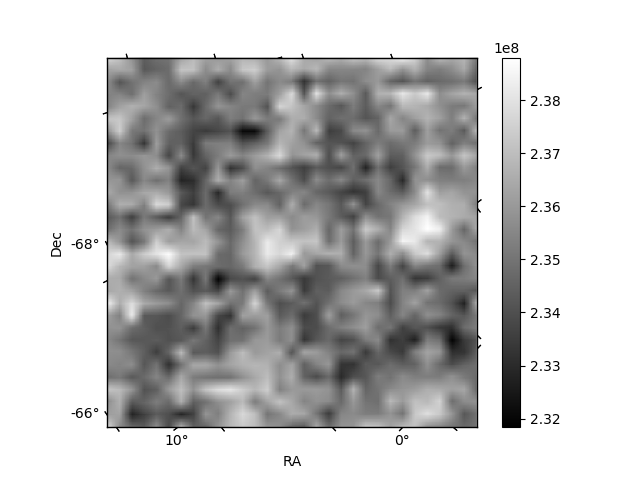
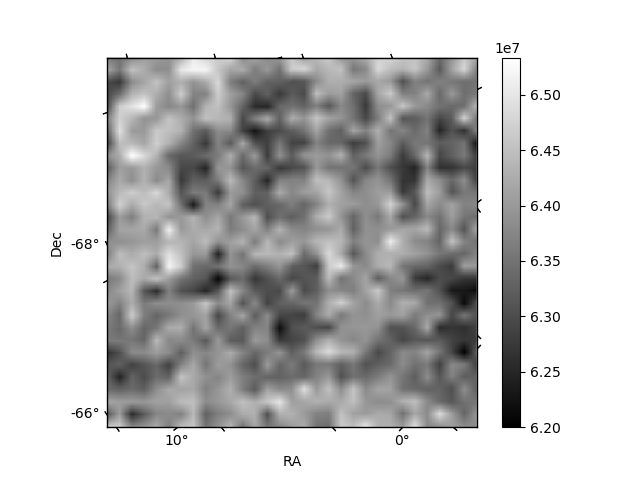
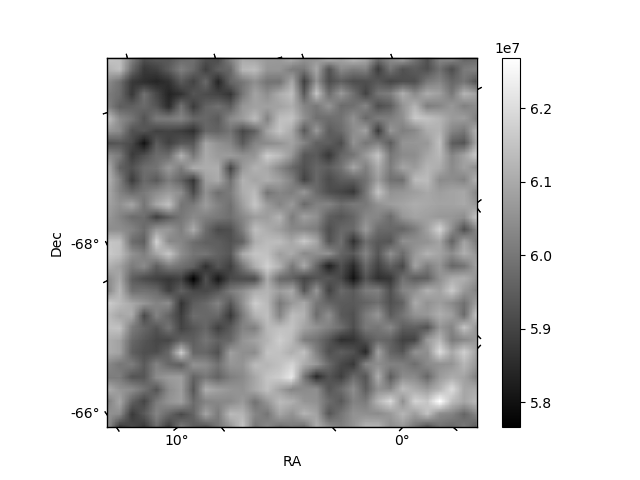
Histogram calculated using DETX and DETY for each event in the final _common_clean file
| Quadrant A | 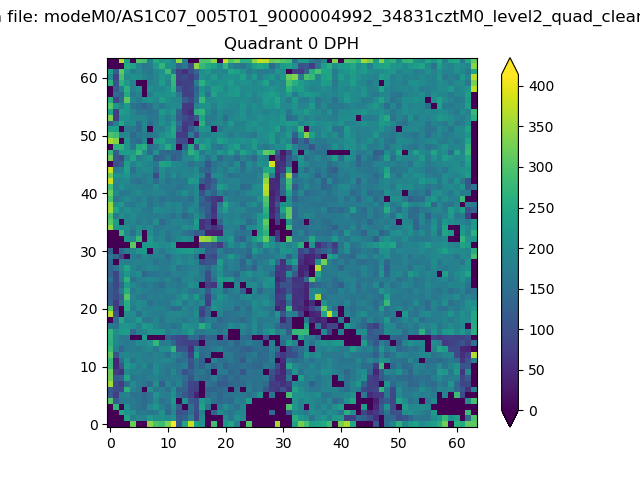 |
 |
Quadrant B |
|---|---|---|---|
| Quadrant D | 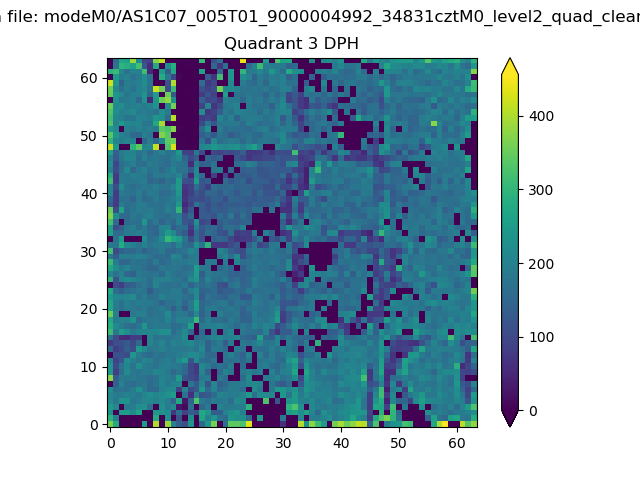 |
 |
Quadrant C |
| Plot type | Count rate plots | Images |
|---|---|---|
| Comparison with Poisson distribution Blue bars denote a histogram of data divided into 1 sec bins. Red curve is a Poisson curve with rate = median count rate of data. |
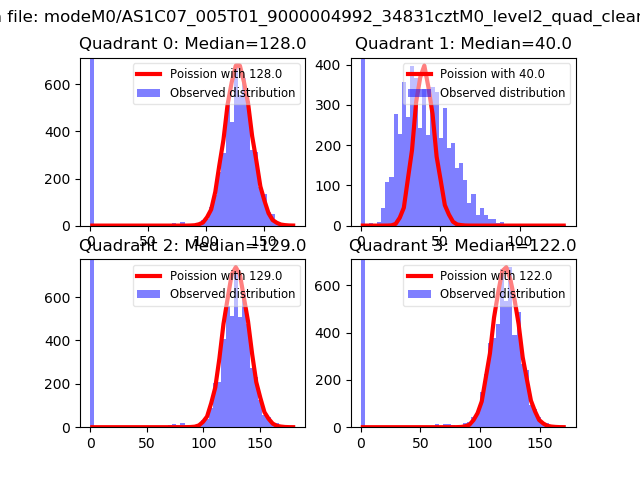 |
 |
| Quadrant-wise count rates Data is divided into 100 sec bins |
 |
|
| Module-wise count rates for Quadrant A Data is divided into 100 sec bins |
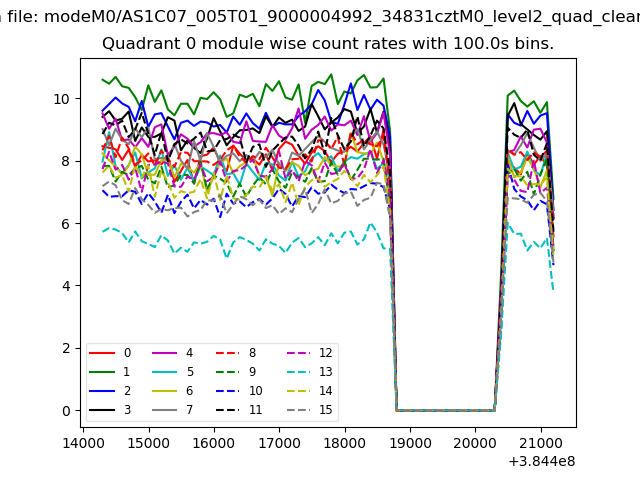 |
 |
| Module-wise count rates for Quadrant B Data is divided into 100 sec bins |
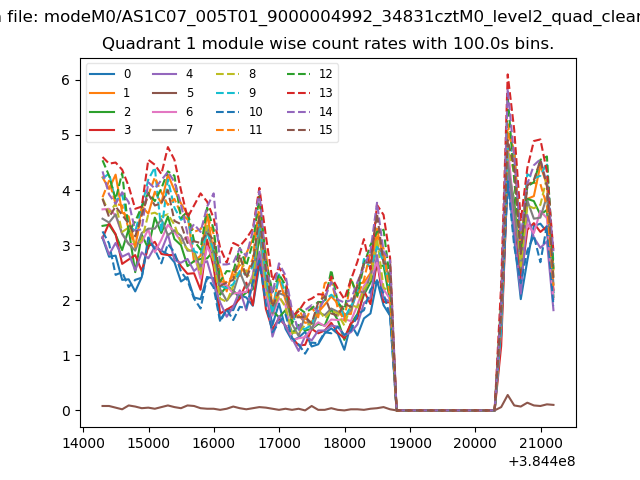 |
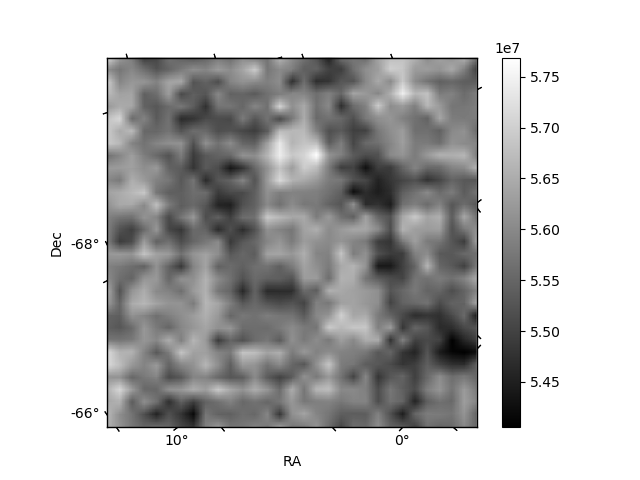 |
| Module-wise count rates for Quadrant C Data is divided into 100 sec bins |
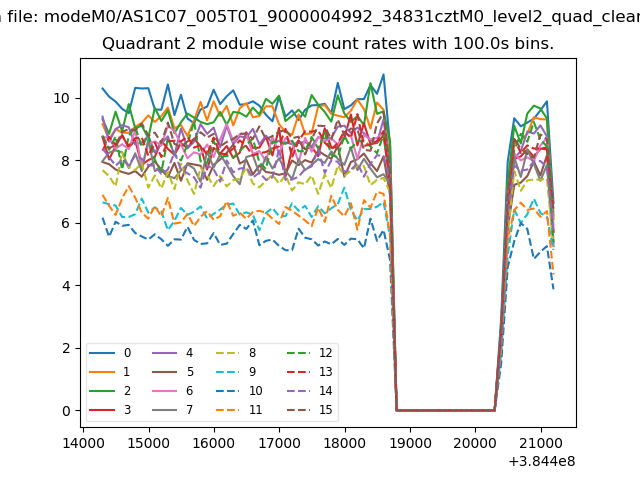 |
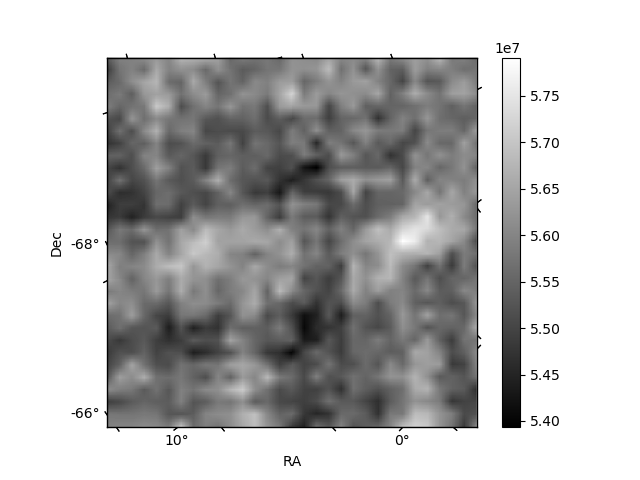 |
| Module-wise count rates for Quadrant D Data is divided into 100 sec bins |
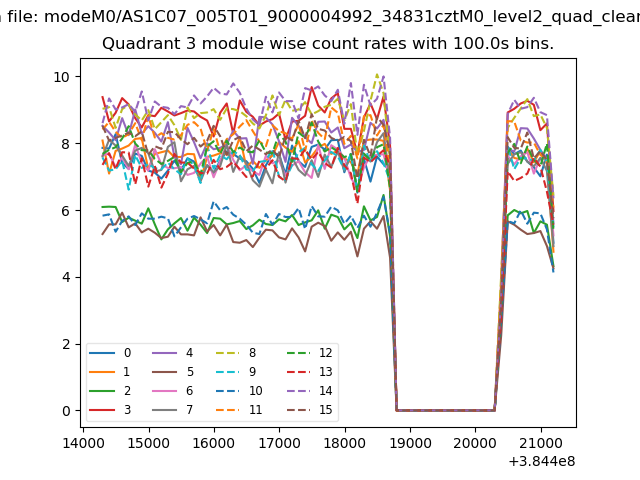 |
 |
| Parameter | Plot |
|---|---|
| CZT HV Monitor | 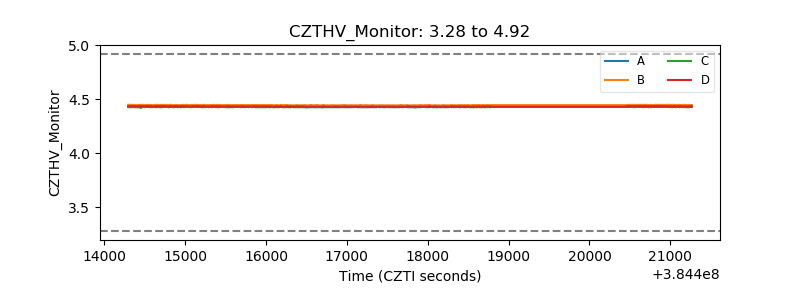 |
| D_VDD | 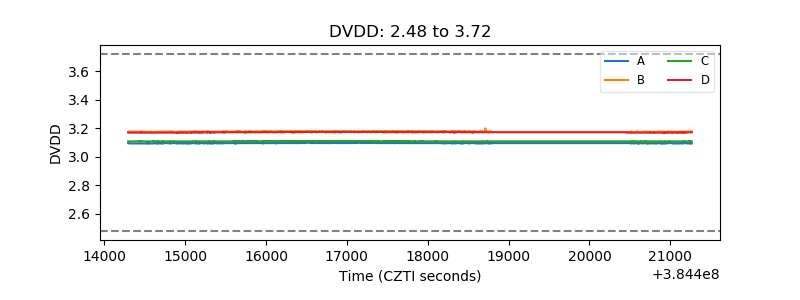 |
| Temperature 1 | 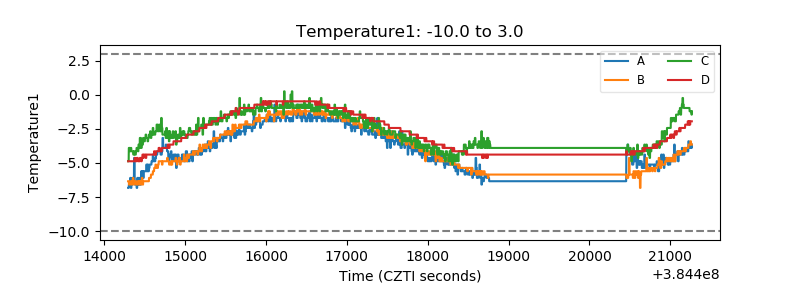 |
| Veto HV Monitor | 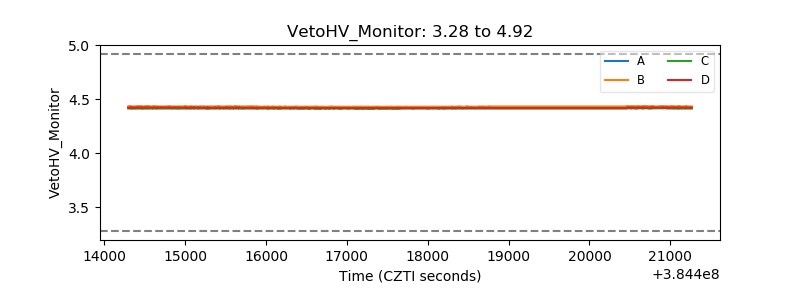 |
| Veto LLD | 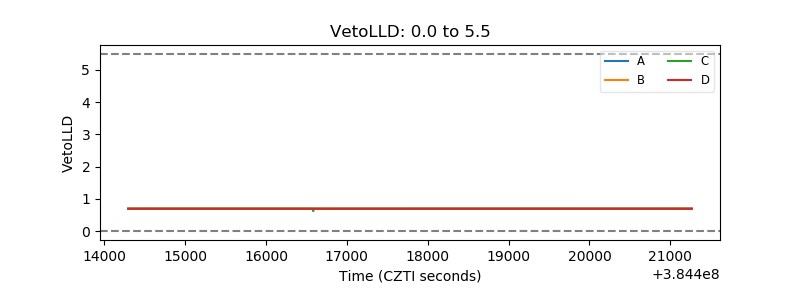 |
| Alpha Counter | 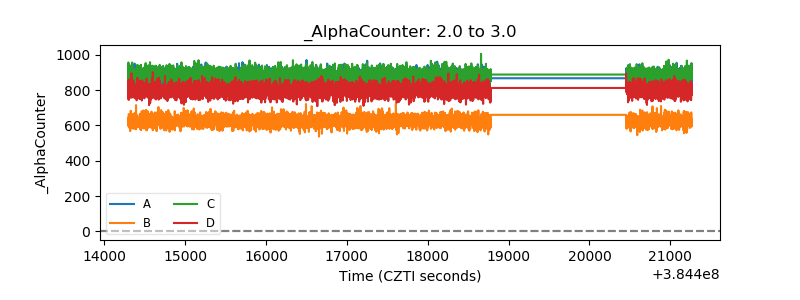 |
| _CPM_Rate | 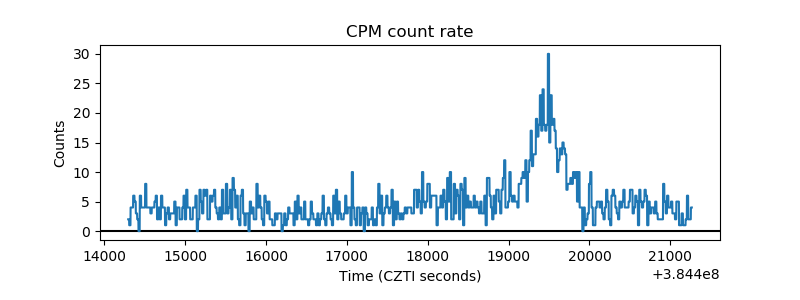 |
| CZT Counter | 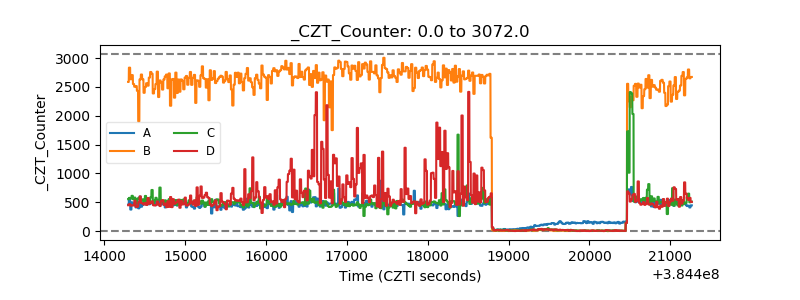 |
| +2.5 Volts monitor | 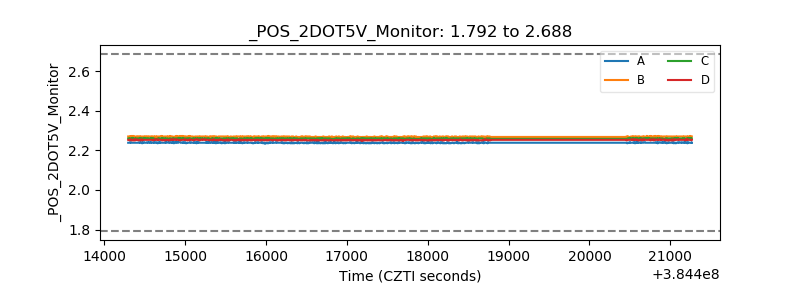 |
| +5 Volts monitor | 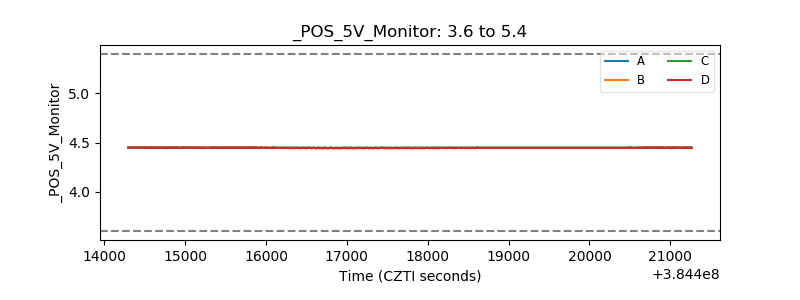 |
| _ROLL_ROT | 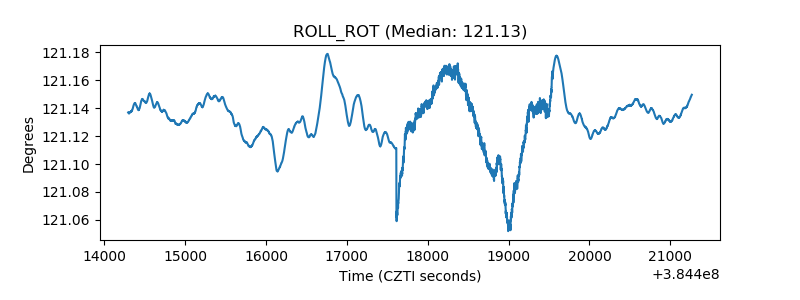 |
| _Roll_DEC | 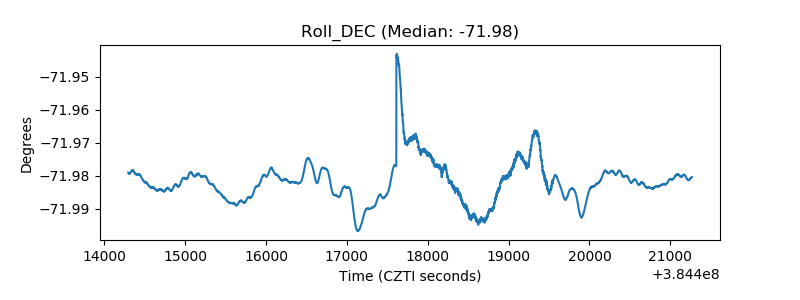 |
| _Roll_RA | 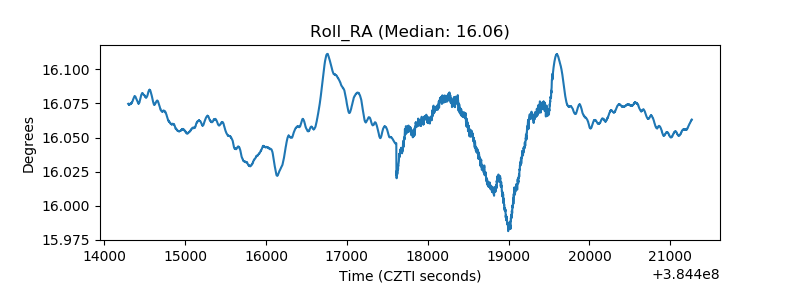 |
| Veto Counter | 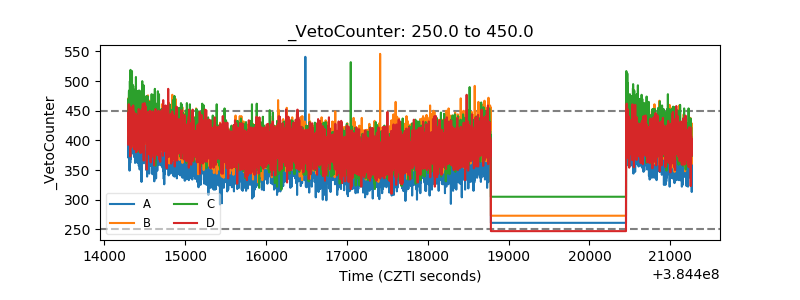 |