| Param | Original file | Final file |
|---|---|---|
| Filename | modeM0/AS1C07_005T01_9000004992_34828cztM0_level2.evt | modeM0/AS1C07_005T01_9000004992_34828cztM0_level2_quad_clean.evt |
| Size (bytes) | 943,608,960 | 75,928,320 |
| Size | 899.9 MB | 72.4 MB |
| Events in quadrant A | 2,631,028 | 654,644 |
| Events in quadrant B | 13,304,570 | 251,254 |
| Events in quadrant C | 2,953,185 | 653,615 |
| Events in quadrant D | 9,339,107 | 372,482 |
| Mode M9 | |||
|---|---|---|---|
| Quadrant | BADHDUFLAG | Total packets | Discarded packets |
| A | 0 | 31 | 0 |
| B | 0 | 31 | 0 |
| C | 0 | 31 | 0 |
| D | 0 | 32 | 0 |
| Mode M0 | |||
|---|---|---|---|
| Quadrant | BADHDUFLAG | Total packets | Discarded packets |
| A | 0 | 10734 | 3 |
| B | 0 | 43066 | 2 |
| C | 0 | 11497 | 2 |
| D | 0 | 31436 | 2 |
| Mode SS | |||
|---|---|---|---|
| Quadrant | BADHDUFLAG | Total packets | Discarded packets |
| A | 0 | 104 | 0 |
| B | 0 | 104 | 0 |
| C | 0 | 104 | 0 |
| D | 0 | 104 | 0 |
| Quadrant | Total seconds | Saturated seconds | Saturation percentage |
|---|---|---|---|
| A | 5198 | 6 | 0.115429% |
| B | 5198 | 5198 | 100.000000% |
| C | 5198 | 46 | 0.884956% |
| D | 5198 | 2886 | 55.521354% |
Noise dominated data is calculated using 1-second bins in cleaned event files. If a bin has >2000 counts, and if more than 50% of those come from <1% of pixels, then it is considered to be noise-dominated and hence unusable.
| Quadrant | # 1 sec bins | Bins with >0 counts | Bins with >2000 counts | High rate bins dominated by noise | Noise dominated (total time) | Noise dominated (detector-on time) | Marked lightcurve |
|---|---|---|---|---|---|---|---|
| A | 7319 | 5199 | 0 | 0 | 0.00% | 0.00% | 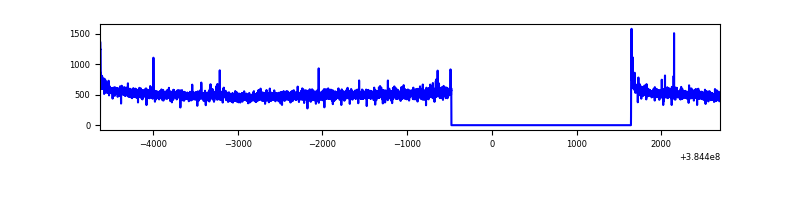 |
| B | 7318 | 5197 | 5123 | 5123 | 70.01% | 98.58% | 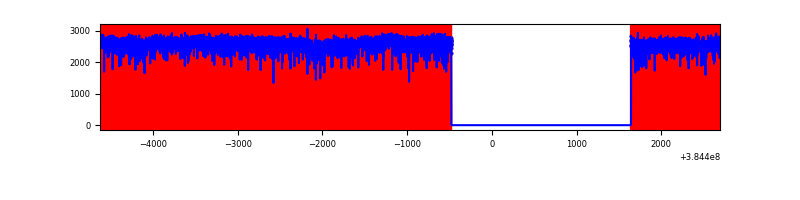 |
| C | 7319 | 5199 | 32 | 32 | 0.44% | 0.62% | 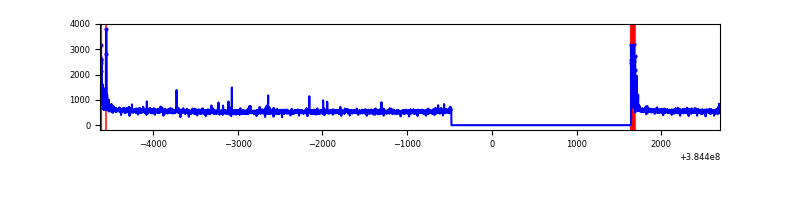 |
| D | 7319 | 5199 | 2738 | 2738 | 37.41% | 52.66% |  |
Top three noisy pixels from each quadrant. If the there are fewer than three noisy pixels in the level2.evt file, extra rows are filled as -1
| Pixel properties | Quadrant properties | ||||||
|---|---|---|---|---|---|---|---|
| Quadrant | DetID | PixID | Counts | Sigma | Mean | Median | Sigma |
| A | 10 | 83 | 50528 | 384.78 | 657 | 649 | 129.6 |
| A | 15 | 169 | 13193 | 96.77 | 657 | 649 | 129.6 |
| A | 13 | 6 | 9446 | 67.86 | 657 | 649 | 129.6 |
| B | 5 | 14 | 3847735 | 75469.5 | 269 | 263 | 51.0 |
| B | 5 | 31 | 3791242 | 74361.37 | 269 | 263 | 51.0 |
| B | 5 | 15 | 3783115 | 74201.95 | 269 | 263 | 51.0 |
| C | 15 | 214 | 241411 | 1624.91 | 648 | 653 | 148.2 |
| C | 0 | 10 | 137582 | 924.15 | 648 | 653 | 148.2 |
| C | 14 | 67 | 23687 | 155.46 | 648 | 653 | 148.2 |
| D | 14 | 52 | 6293656 | 56278.83 | 453 | 440 | 111.8 |
| D | 8 | 195 | 499742 | 4465.15 | 453 | 440 | 111.8 |
| D | 14 | 226 | 460477 | 4114.01 | 453 | 440 | 111.8 |
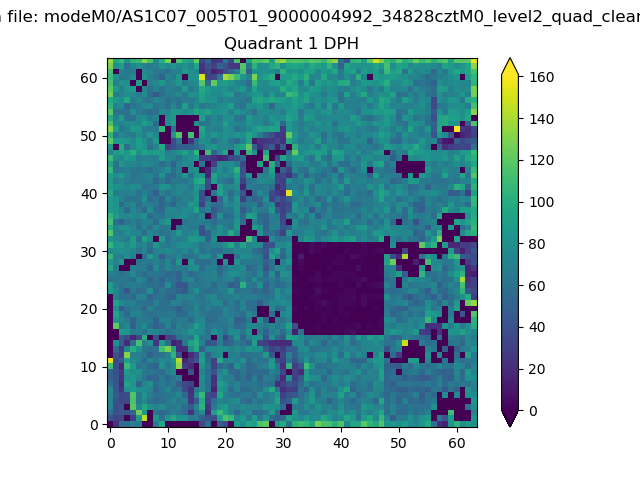
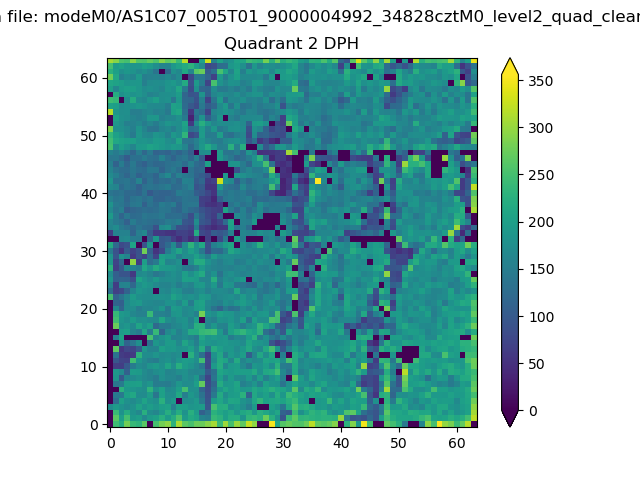
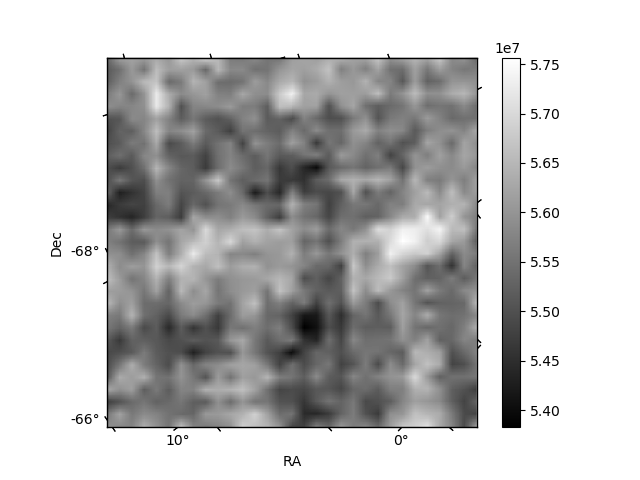
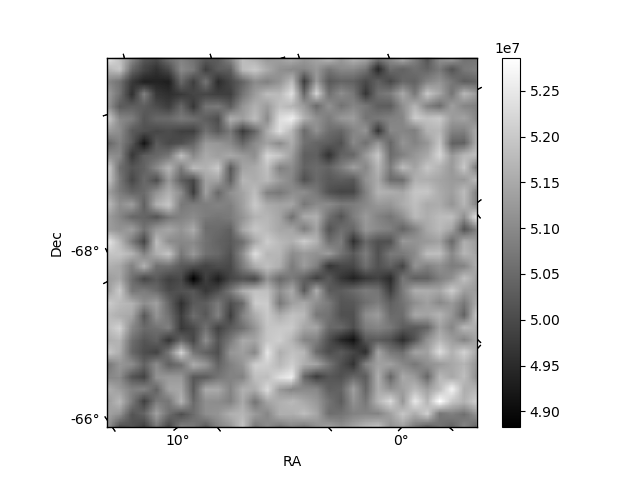
Histogram calculated using DETX and DETY for each event in the final _common_clean file
| Quadrant A | 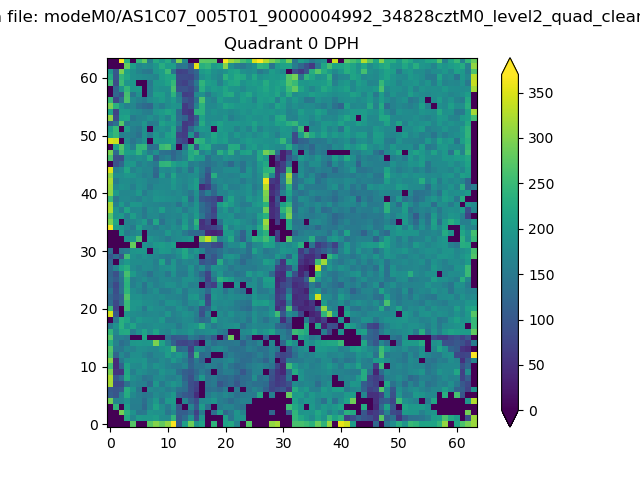 |
 |
Quadrant B |
|---|---|---|---|
| Quadrant D | 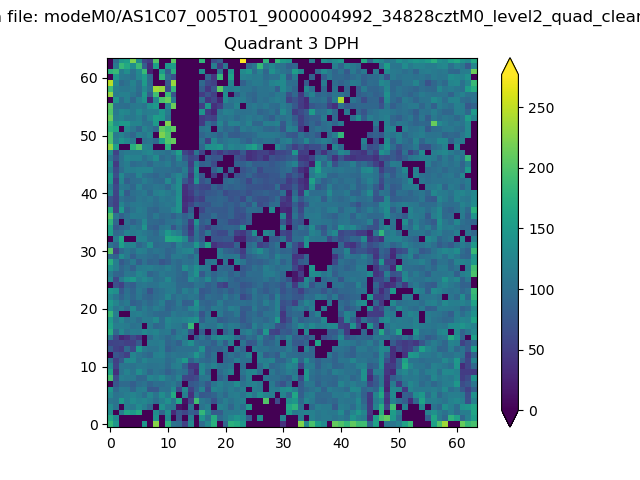 |
 |
Quadrant C |
| Plot type | Count rate plots | Images |
|---|---|---|
| Comparison with Poisson distribution Blue bars denote a histogram of data divided into 1 sec bins. Red curve is a Poisson curve with rate = median count rate of data. |
 |
 |
| Quadrant-wise count rates Data is divided into 100 sec bins |
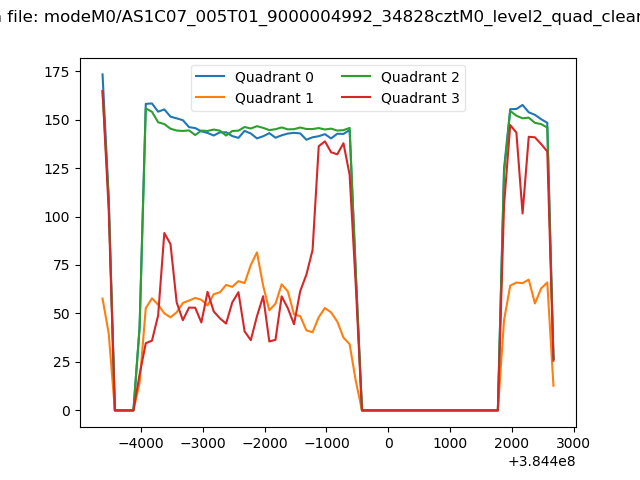 |
|
| Module-wise count rates for Quadrant A Data is divided into 100 sec bins |
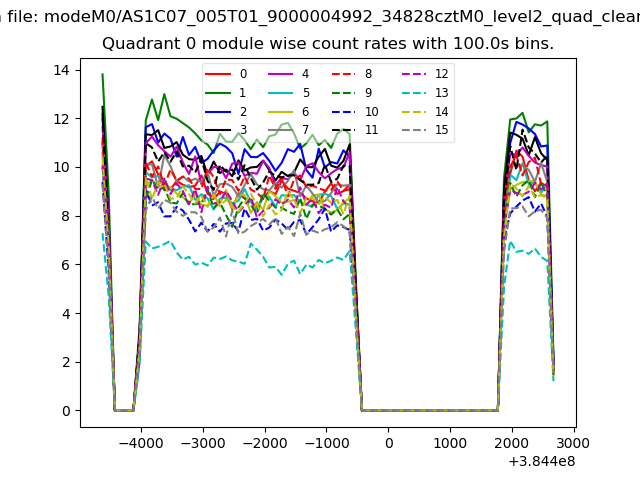 |
 |
| Module-wise count rates for Quadrant B Data is divided into 100 sec bins |
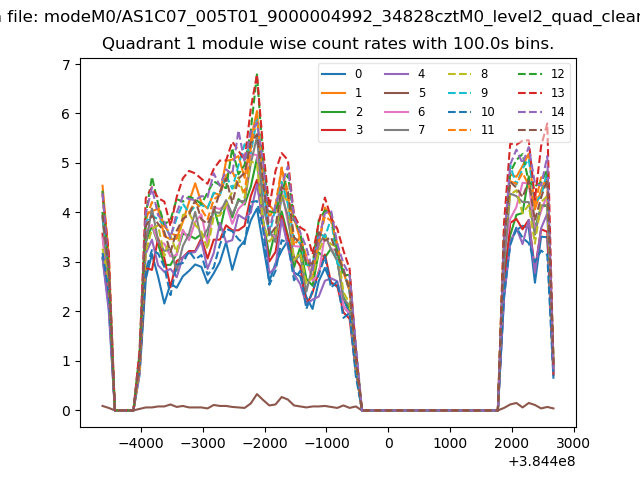 |
 |
| Module-wise count rates for Quadrant C Data is divided into 100 sec bins |
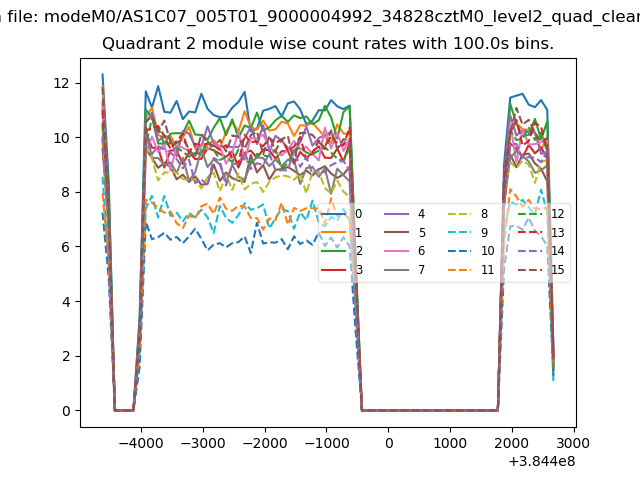 |
 |
| Module-wise count rates for Quadrant D Data is divided into 100 sec bins |
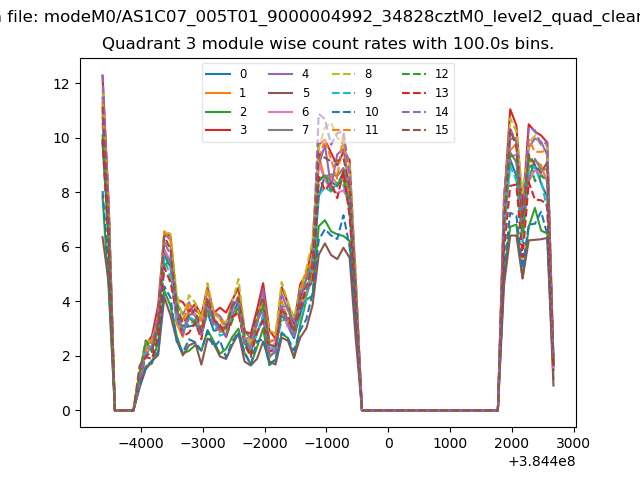 |
 |
| Parameter | Plot |
|---|---|
| CZT HV Monitor | 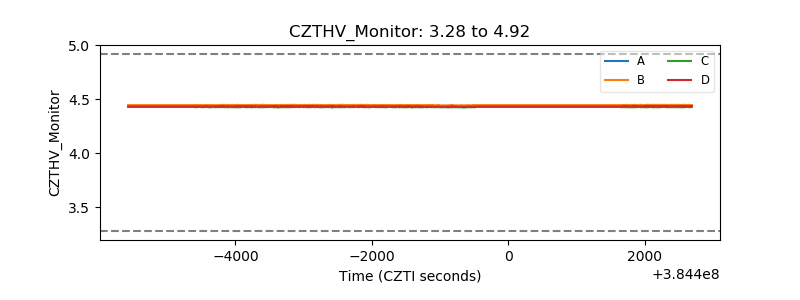 |
| D_VDD | 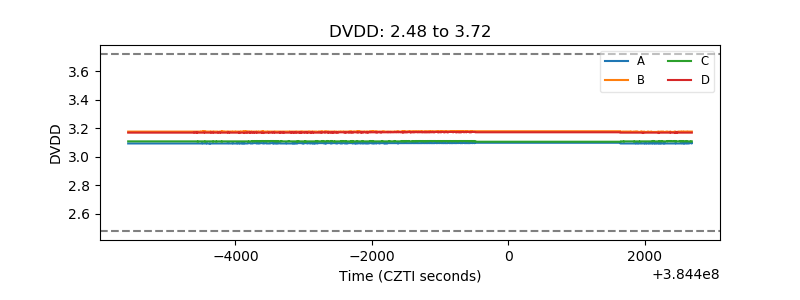 |
| Temperature 1 | 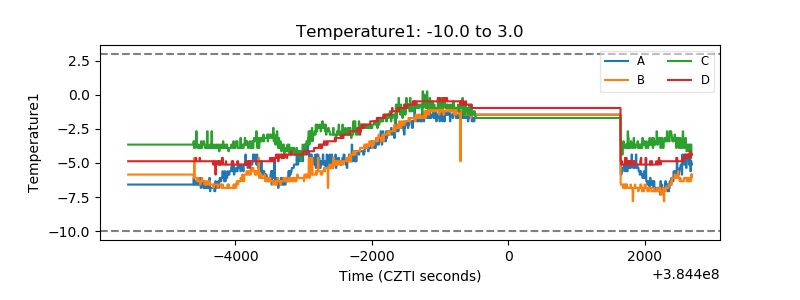 |
| Veto HV Monitor |  |
| Veto LLD | 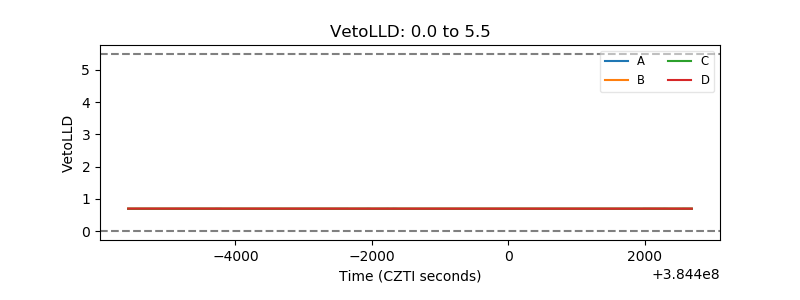 |
| Alpha Counter | 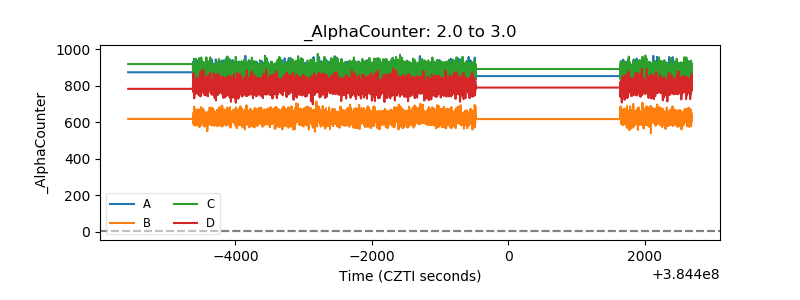 |
| _CPM_Rate | 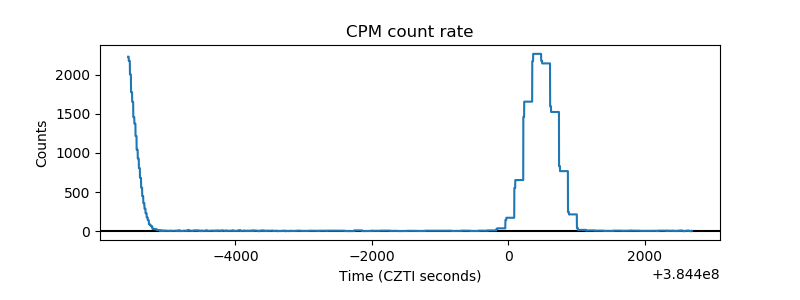 |
| CZT Counter | 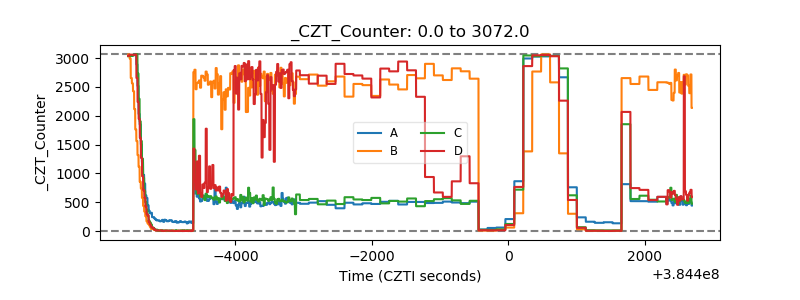 |
| +2.5 Volts monitor | 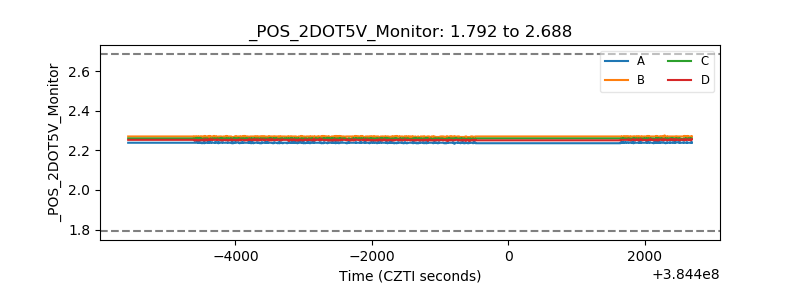 |
| +5 Volts monitor | 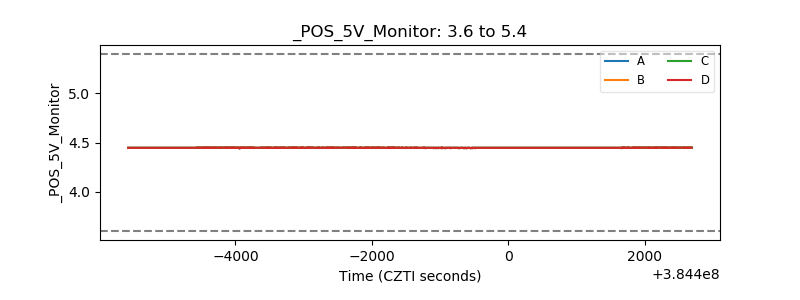 |
| _ROLL_ROT | 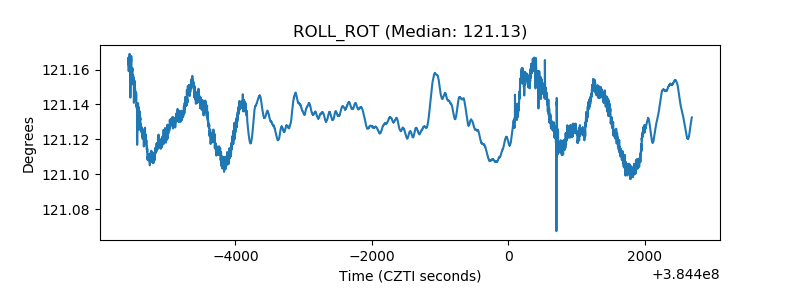 |
| _Roll_DEC | 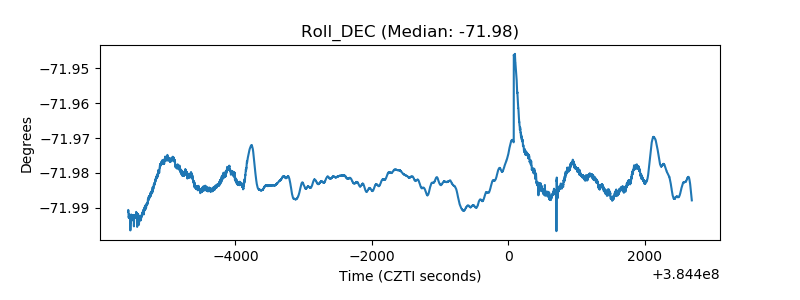 |
| _Roll_RA | 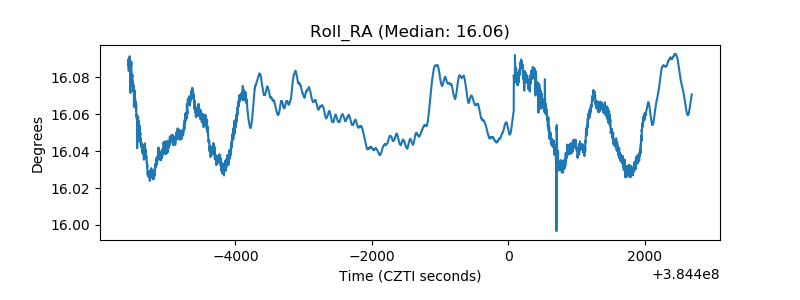 |
| Veto Counter |  |