| Param | Original file | Final file |
|---|---|---|
| Filename | modeM0/AS1C07_005T01_9000004992_34825cztM0_level2.evt | modeM0/AS1C07_005T01_9000004992_34825cztM0_level2_quad_clean.evt |
| Size (bytes) | 783,743,040 | 82,316,160 |
| Size | 747.4 MB | 78.5 MB |
| Events in quadrant A | 3,695,212 | 639,760 |
| Events in quadrant B | 13,401,498 | 250,913 |
| Events in quadrant C | 2,870,532 | 630,211 |
| Events in quadrant D | 3,414,460 | 602,731 |
| Mode M9 | |||
|---|---|---|---|
| Quadrant | BADHDUFLAG | Total packets | Discarded packets |
| A | 0 | 23 | 0 |
| B | 0 | 23 | 0 |
| C | 0 | 23 | 0 |
| D | 0 | 24 | 0 |
| Mode M0 | |||
|---|---|---|---|
| Quadrant | BADHDUFLAG | Total packets | Discarded packets |
| A | 0 | 14604 | 3 |
| B | 0 | 43400 | 2 |
| C | 0 | 11620 | 2 |
| D | 0 | 13793 | 2 |
| Mode SS | |||
|---|---|---|---|
| Quadrant | BADHDUFLAG | Total packets | Discarded packets |
| A | 0 | 106 | 0 |
| B | 0 | 106 | 0 |
| C | 0 | 106 | 0 |
| D | 0 | 106 | 0 |
| Quadrant | Total seconds | Saturated seconds | Saturation percentage |
|---|---|---|---|
| A | 5240 | 110 | 2.099237% |
| B | 5240 | 5240 | 100.000000% |
| C | 5240 | 71 | 1.354962% |
| D | 5240 | 67 | 1.278626% |
Noise dominated data is calculated using 1-second bins in cleaned event files. If a bin has >2000 counts, and if more than 50% of those come from <1% of pixels, then it is considered to be noise-dominated and hence unusable.
| Quadrant | # 1 sec bins | Bins with >0 counts | Bins with >2000 counts | High rate bins dominated by noise | Noise dominated (total time) | Noise dominated (detector-on time) | Marked lightcurve |
|---|---|---|---|---|---|---|---|
| A | 7093 | 5241 | 64 | 64 | 0.90% | 1.22% | 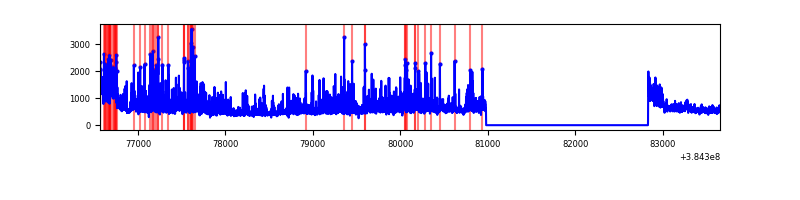 |
| B | 7092 | 5239 | 5155 | 5155 | 72.69% | 98.40% | 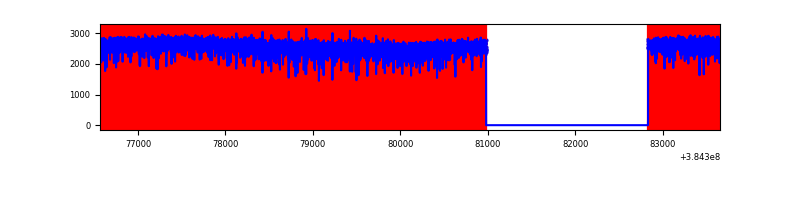 |
| C | 7093 | 5241 | 55 | 55 | 0.78% | 1.05% | 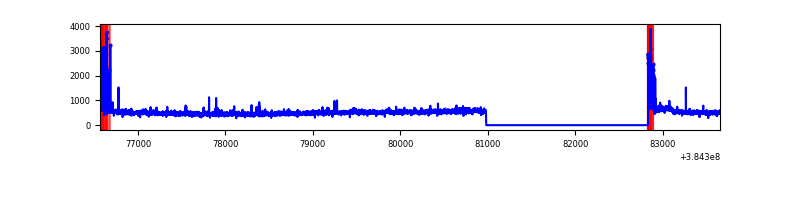 |
| D | 7093 | 5241 | 60 | 60 | 0.85% | 1.14% | 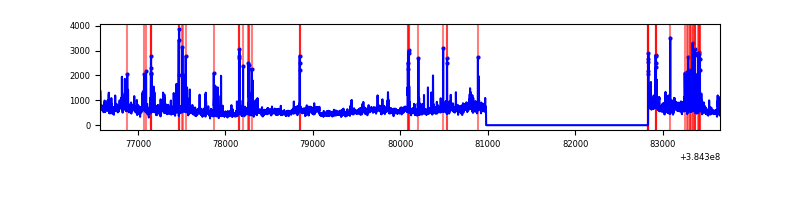 |
Top three noisy pixels from each quadrant. If the there are fewer than three noisy pixels in the level2.evt file, extra rows are filled as -1
| Pixel properties | Quadrant properties | ||||||
|---|---|---|---|---|---|---|---|
| Quadrant | DetID | PixID | Counts | Sigma | Mean | Median | Sigma |
| A | 15 | 169 | 1215088 | 9940.47 | 613 | 602 | 122.2 |
| A | 10 | 83 | 52554 | 425.22 | 613 | 602 | 122.2 |
| A | 13 | 6 | 19629 | 155.73 | 613 | 602 | 122.2 |
| B | 5 | 14 | 4018173 | 77651.25 | 266 | 260 | 51.7 |
| B | 5 | 31 | 3975488 | 76826.31 | 266 | 260 | 51.7 |
| B | 5 | 15 | 3965630 | 76635.79 | 266 | 260 | 51.7 |
| C | 15 | 214 | 239094 | 1754.07 | 592 | 598 | 136.0 |
| C | 0 | 10 | 205798 | 1509.19 | 592 | 598 | 136.0 |
| C | 14 | 67 | 85965 | 627.85 | 592 | 598 | 136.0 |
| D | 8 | 195 | 546995 | 3839.67 | 590 | 575 | 142.3 |
| D | 13 | 249 | 107642 | 752.36 | 590 | 575 | 142.3 |
| D | 12 | 6 | 76136 | 530.96 | 590 | 575 | 142.3 |
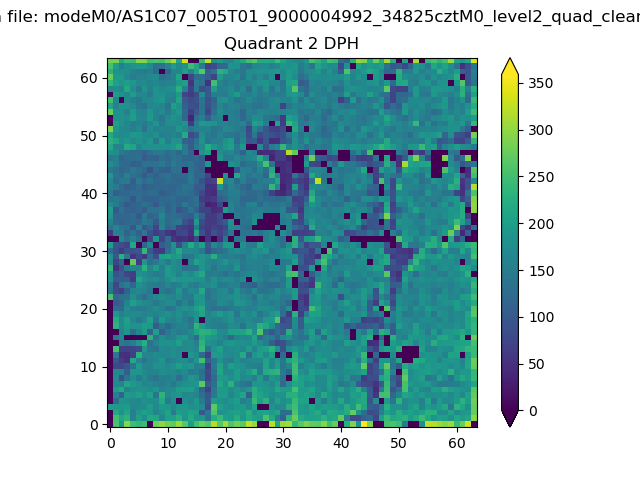
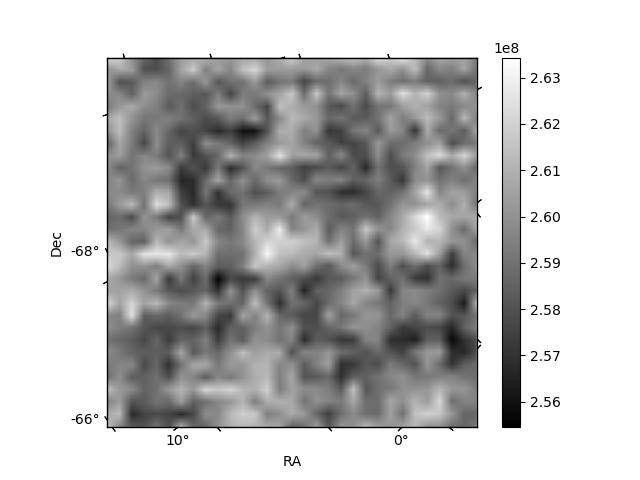
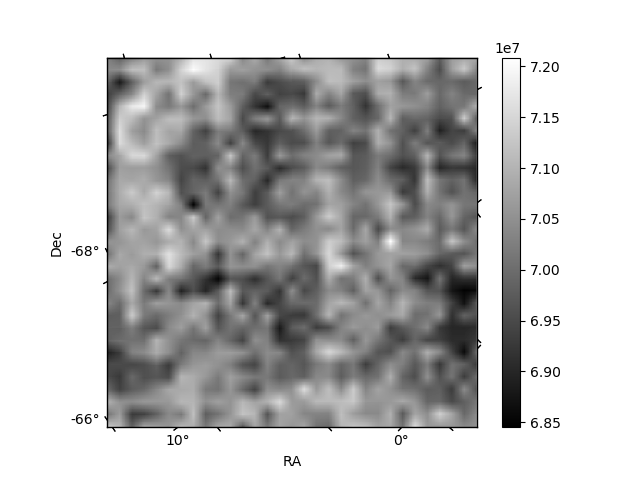
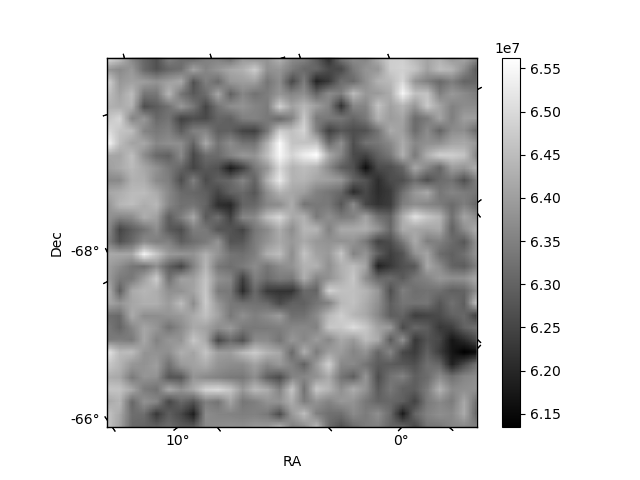
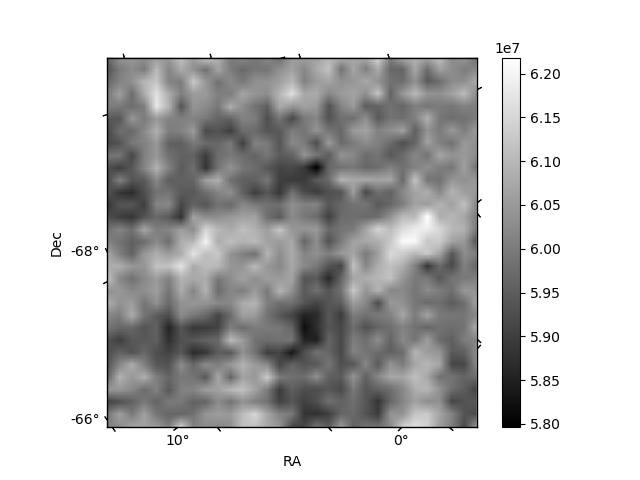
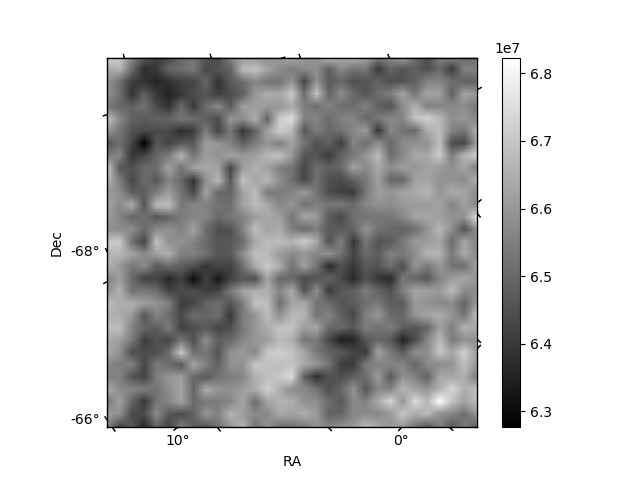
Histogram calculated using DETX and DETY for each event in the final _common_clean file
| Quadrant A | 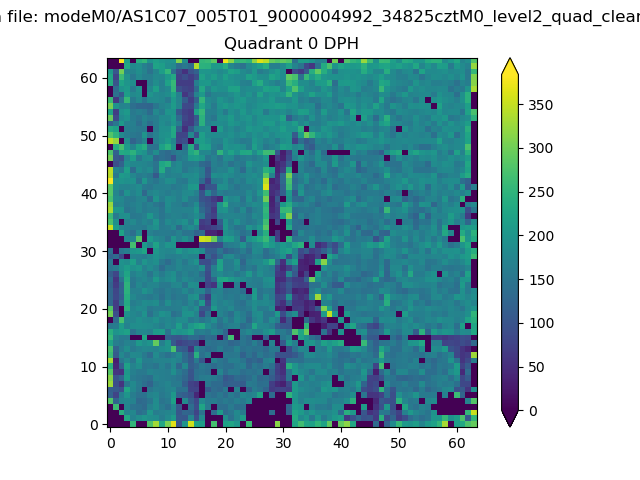 |
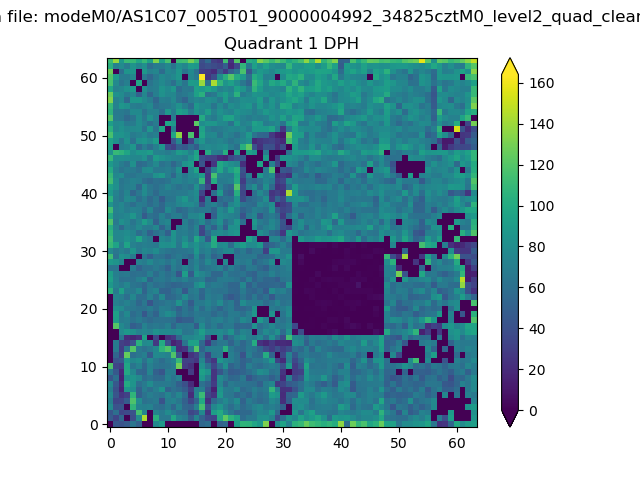 |
Quadrant B |
|---|---|---|---|
| Quadrant D | 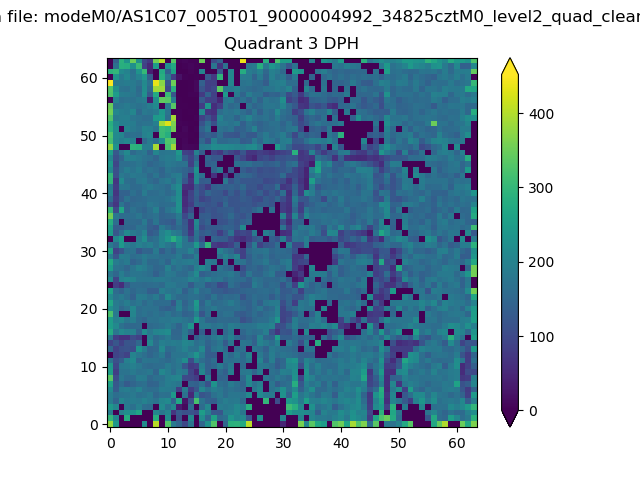 |
 |
Quadrant C |
| Plot type | Count rate plots | Images |
|---|---|---|
| Comparison with Poisson distribution Blue bars denote a histogram of data divided into 1 sec bins. Red curve is a Poisson curve with rate = median count rate of data. |
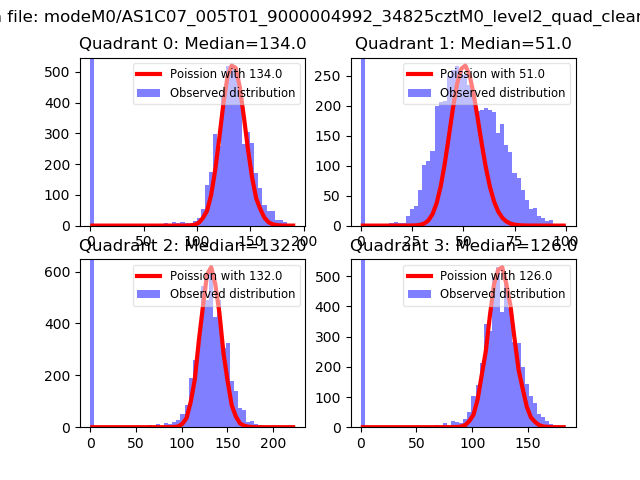 |
 |
| Quadrant-wise count rates Data is divided into 100 sec bins |
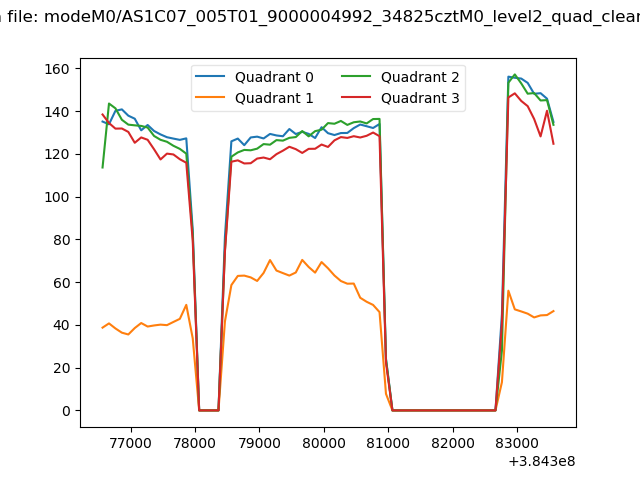 |
|
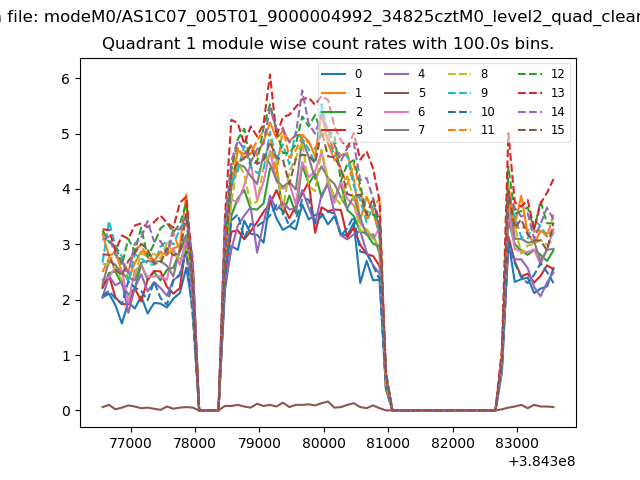
| Module-wise count rates for Quadrant A Data is divided into 100 sec bins |
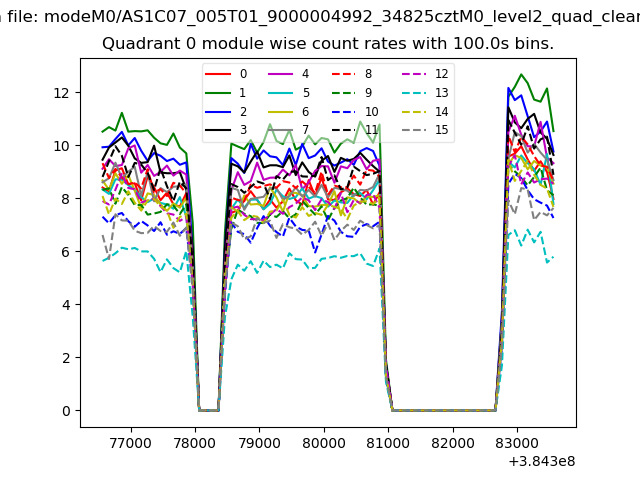 |
 |
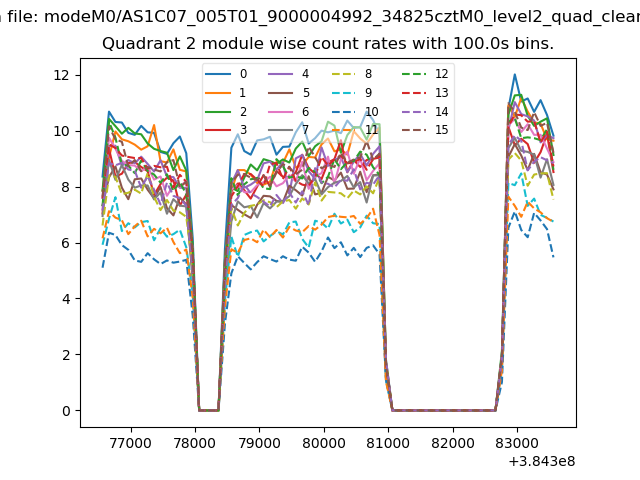
| Module-wise count rates for Quadrant B Data is divided into 100 sec bins |
 |
 |
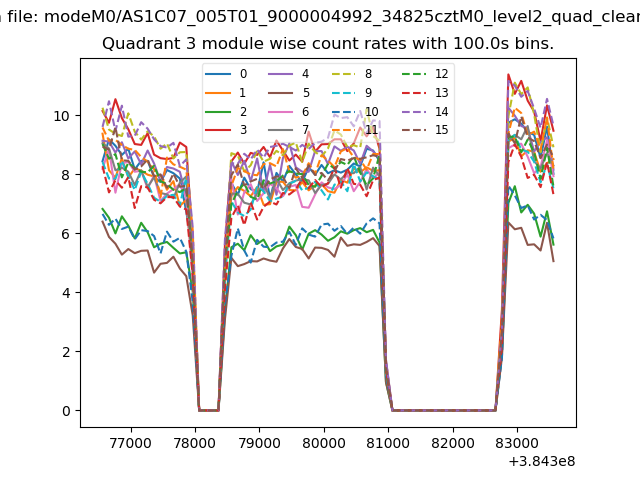
| Module-wise count rates for Quadrant C Data is divided into 100 sec bins |
 |
 |
| Module-wise count rates for Quadrant D Data is divided into 100 sec bins |
 |
 |
| Parameter | Plot |
|---|---|
| CZT HV Monitor | 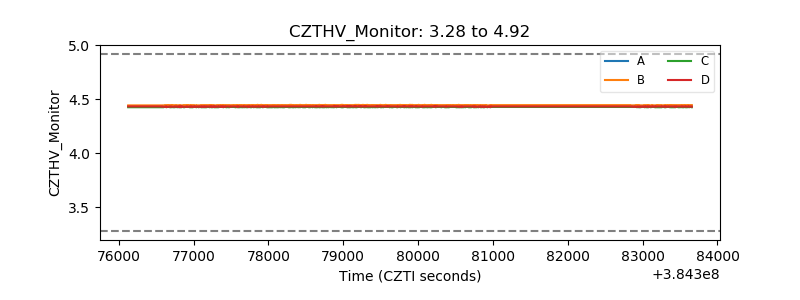 |
| D_VDD | 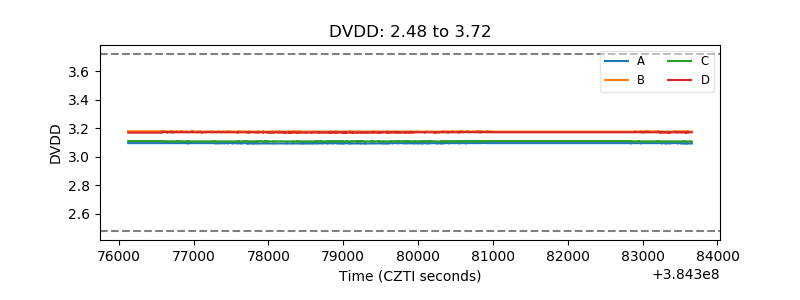 |
| Temperature 1 | 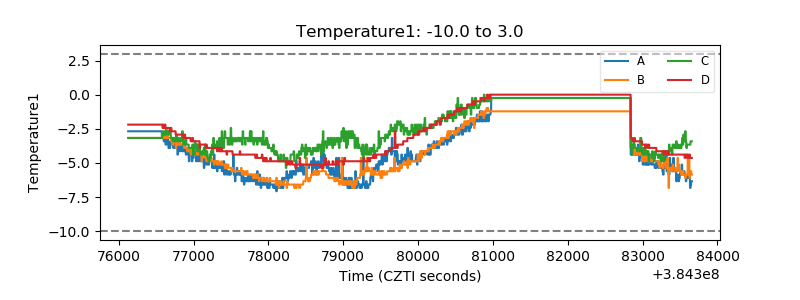 |
| Veto HV Monitor | 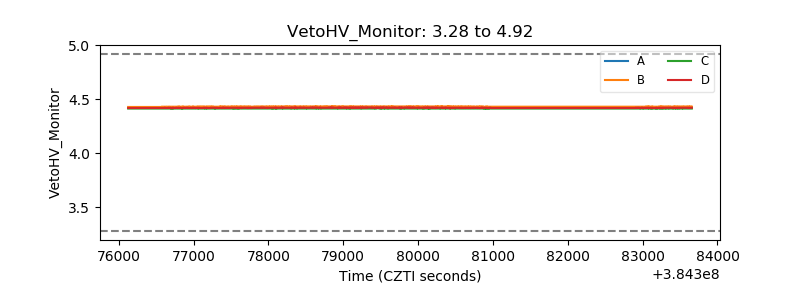 |
| Veto LLD | 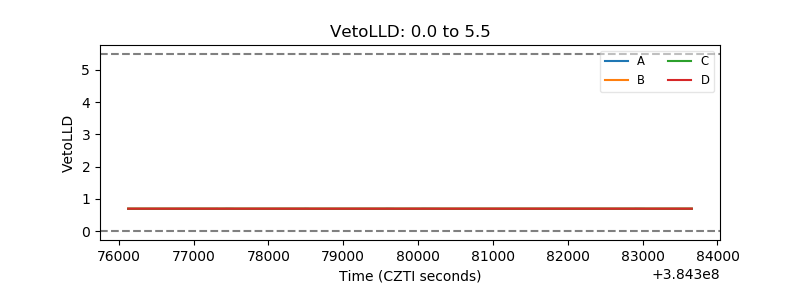 |
| Alpha Counter | 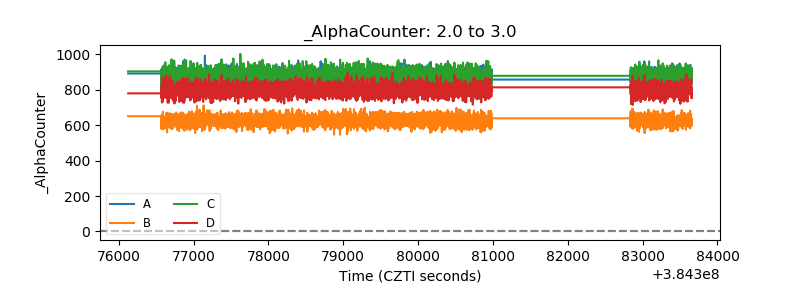 |
| _CPM_Rate | 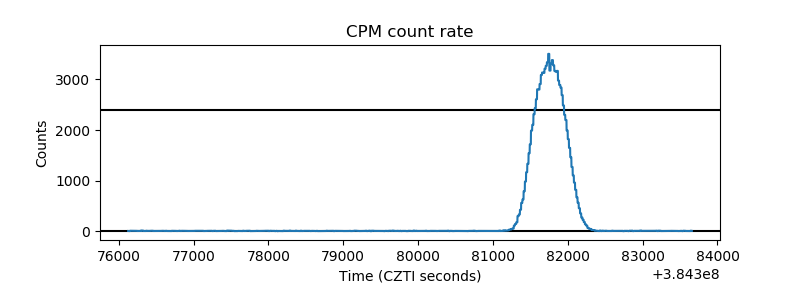 |
| CZT Counter | 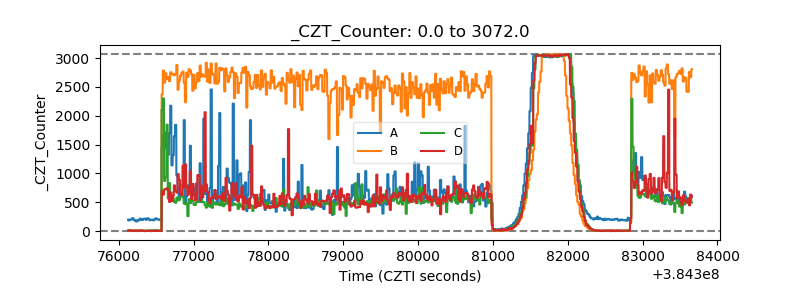 |
| +2.5 Volts monitor | 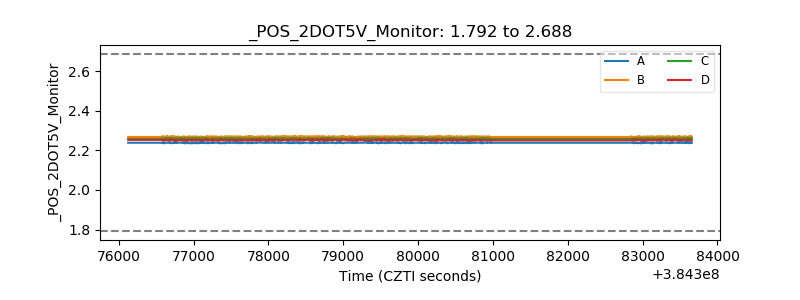 |
| +5 Volts monitor | 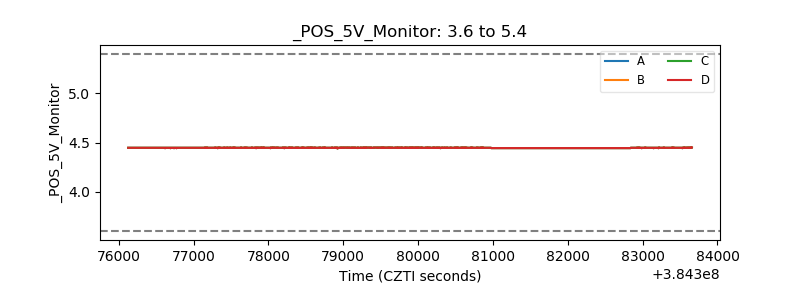 |
| _ROLL_ROT | 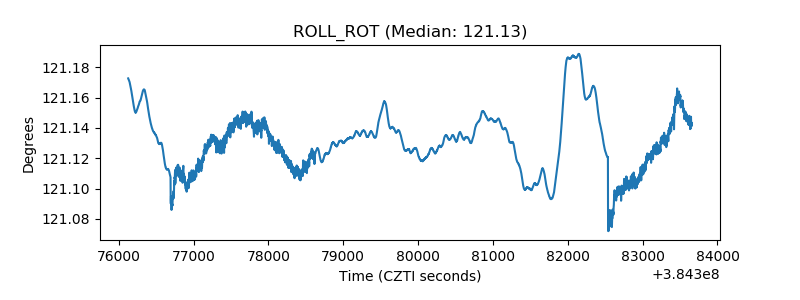 |
| _Roll_DEC | 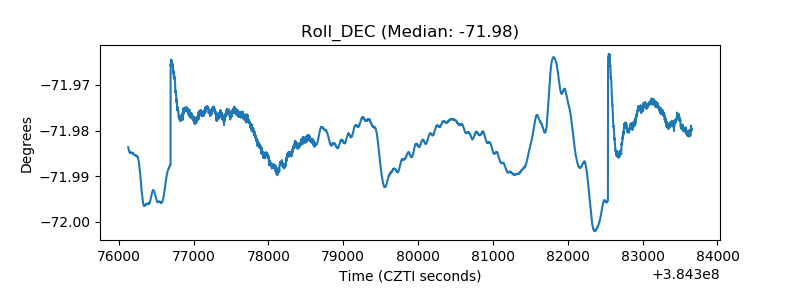 |
| _Roll_RA | 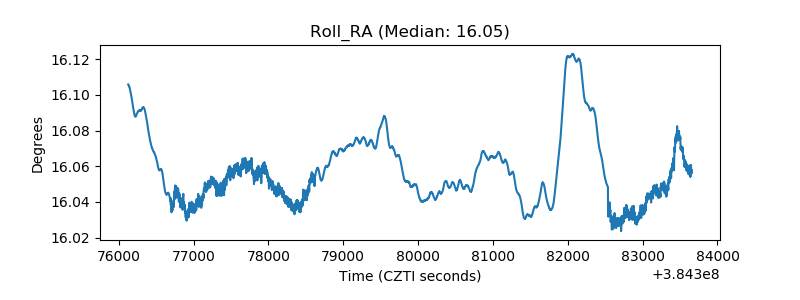 |
| Veto Counter | 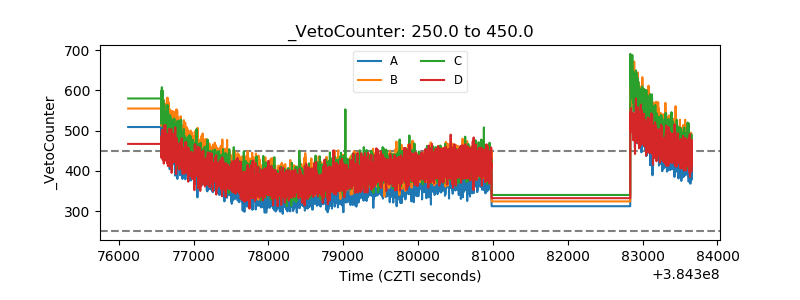 |