| Param | Original file | Final file |
|---|---|---|
| Filename | modeM0/AS1C07_005T01_9000004992_34821cztM0_level2.evt | modeM0/AS1C07_005T01_9000004992_34821cztM0_level2_quad_clean.evt |
| Size (bytes) | 1,360,226,880 | 167,944,320 |
| Size | 1.3 GB | 160.2 MB |
| Events in quadrant A | 5,312,274 | 1,229,151 |
| Events in quadrant B | 21,916,122 | 738,328 |
| Events in quadrant C | 5,448,010 | 1,222,647 |
| Events in quadrant D | 7,794,666 | 1,149,720 |
| Mode M9 | |||
|---|---|---|---|
| Quadrant | BADHDUFLAG | Total packets | Discarded packets |
| A | 0 | 28 | 0 |
| B | 0 | 28 | 0 |
| C | 0 | 28 | 0 |
| D | 0 | 28 | 0 |
| Mode M0 | |||
|---|---|---|---|
| Quadrant | BADHDUFLAG | Total packets | Discarded packets |
| A | 0 | 22928 | 3 |
| B | 0 | 72576 | 2 |
| C | 0 | 22748 | 2 |
| D | 0 | 30352 | 2 |
| Mode SS | |||
|---|---|---|---|
| Quadrant | BADHDUFLAG | Total packets | Discarded packets |
| A | 0 | 218 | 0 |
| B | 0 | 218 | 0 |
| C | 0 | 218 | 0 |
| D | 0 | 218 | 0 |
| Quadrant | Total seconds | Saturated seconds | Saturation percentage |
|---|---|---|---|
| A | 10740 | 41 | 0.381750% |
| B | 10740 | 7614 | 70.893855% |
| C | 10740 | 45 | 0.418994% |
| D | 10740 | 402 | 3.743017% |
Noise dominated data is calculated using 1-second bins in cleaned event files. If a bin has >2000 counts, and if more than 50% of those come from <1% of pixels, then it is considered to be noise-dominated and hence unusable.
| Quadrant | # 1 sec bins | Bins with >0 counts | Bins with >2000 counts | High rate bins dominated by noise | Noise dominated (total time) | Noise dominated (detector-on time) | Marked lightcurve |
|---|---|---|---|---|---|---|---|
| A | 13544 | 10742 | 18 | 18 | 0.13% | 0.17% | 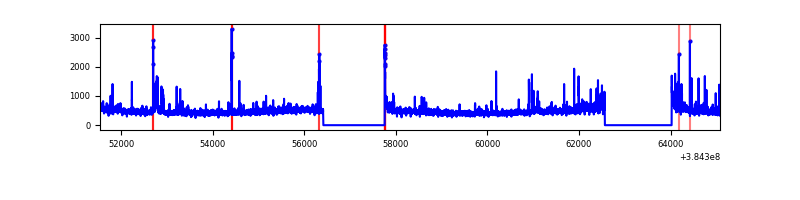 |
| B | 13543 | 10741 | 6771 | 6771 | 50.00% | 63.04% | 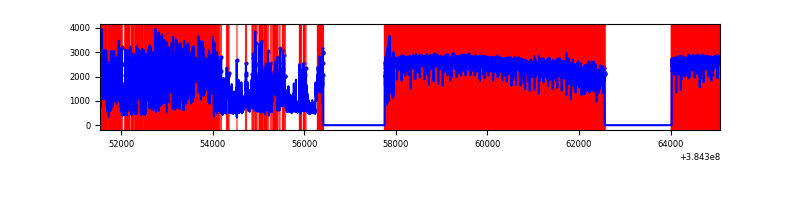 |
| C | 13544 | 10742 | 24 | 24 | 0.18% | 0.22% | 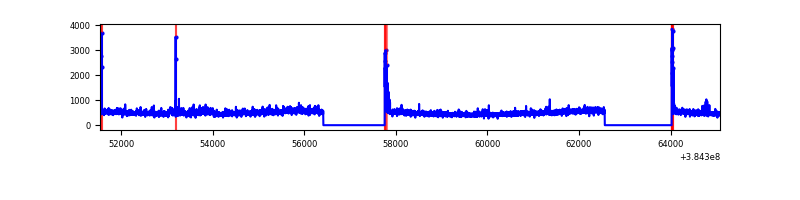 |
| D | 13544 | 10742 | 380 | 380 | 2.81% | 3.54% | 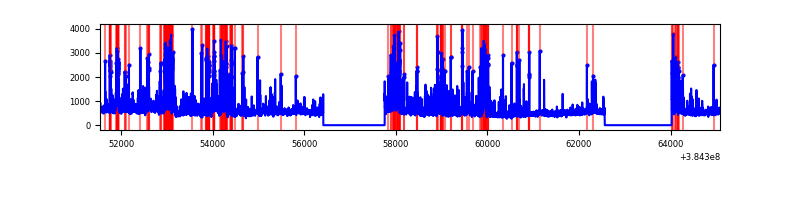 |
Top three noisy pixels from each quadrant. If the there are fewer than three noisy pixels in the level2.evt file, extra rows are filled as -1
| Pixel properties | Quadrant properties | ||||||
|---|---|---|---|---|---|---|---|
| Quadrant | DetID | PixID | Counts | Sigma | Mean | Median | Sigma |
| A | 15 | 169 | 337206 | 1367.52 | 1224 | 1200 | 245.7 |
| A | 10 | 83 | 77279 | 309.64 | 1224 | 1200 | 245.7 |
| A | 15 | 174 | 44121 | 174.69 | 1224 | 1200 | 245.7 |
| B | 4 | 251 | 5270355 | 34730.25 | 796 | 773 | 151.7 |
| B | 5 | 14 | 3730572 | 24582.0 | 796 | 773 | 151.7 |
| B | 5 | 31 | 3622107 | 23867.14 | 796 | 773 | 151.7 |
| C | 15 | 214 | 489178 | 1783.14 | 1184 | 1190 | 273.7 |
| C | 14 | 67 | 158792 | 575.89 | 1184 | 1190 | 273.7 |
| C | 0 | 10 | 131816 | 477.32 | 1184 | 1190 | 273.7 |
| D | 8 | 195 | 1062525 | 3406.56 | 1157 | 1134 | 311.6 |
| D | 12 | 233 | 681884 | 2184.88 | 1157 | 1134 | 311.6 |
| D | 2 | 250 | 260657 | 832.95 | 1157 | 1134 | 311.6 |
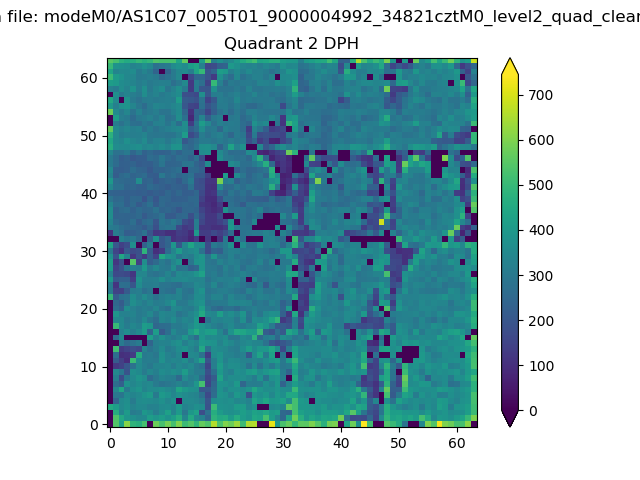
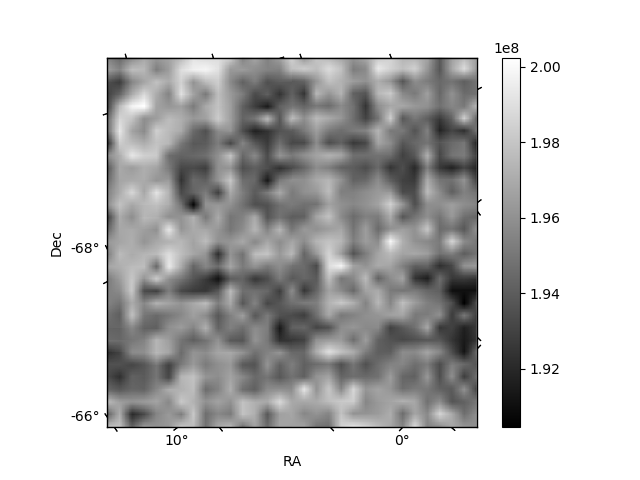
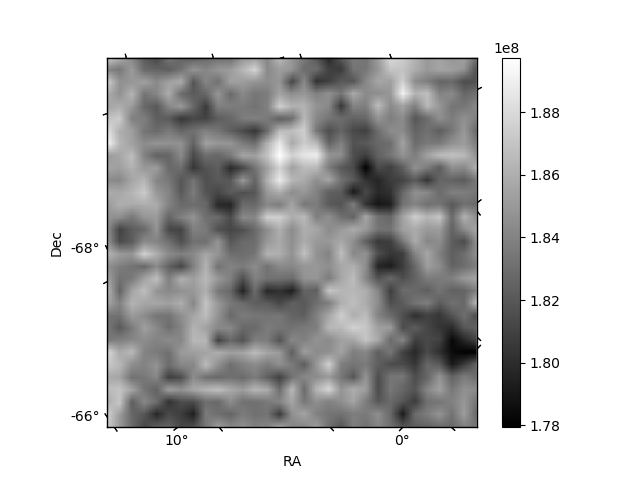
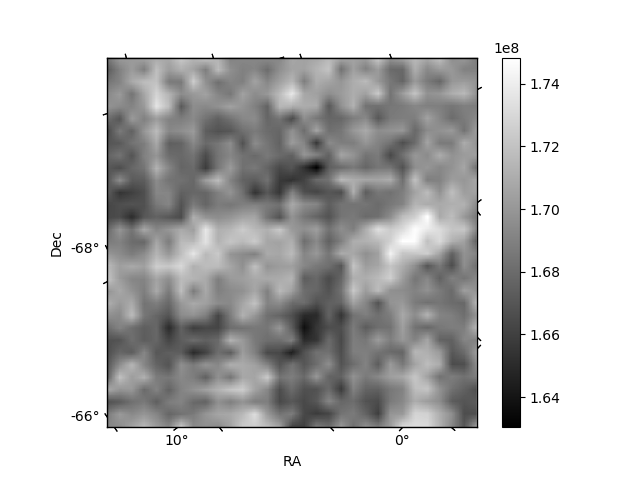
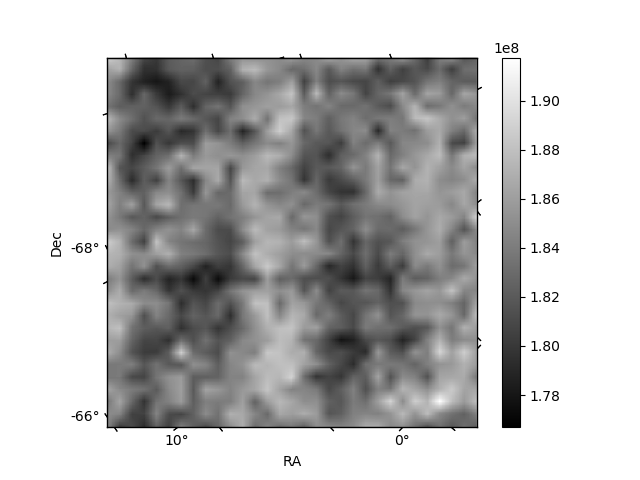
Histogram calculated using DETX and DETY for each event in the final _common_clean file
| Quadrant A | 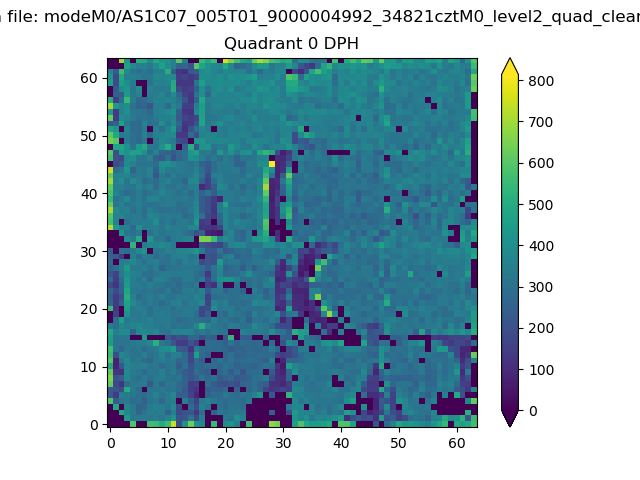 |
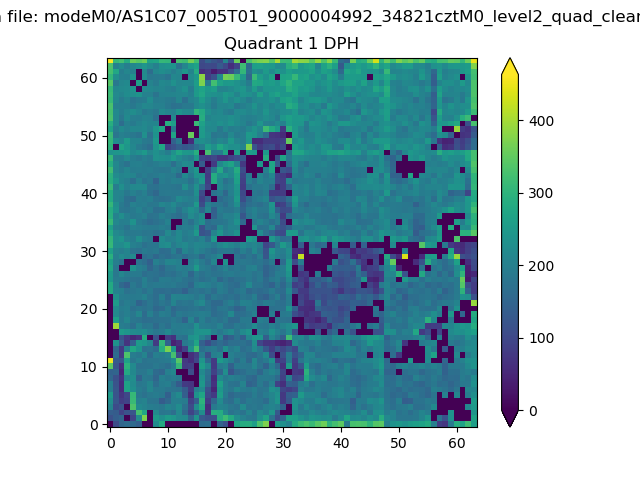 |
Quadrant B |
|---|---|---|---|
| Quadrant D | 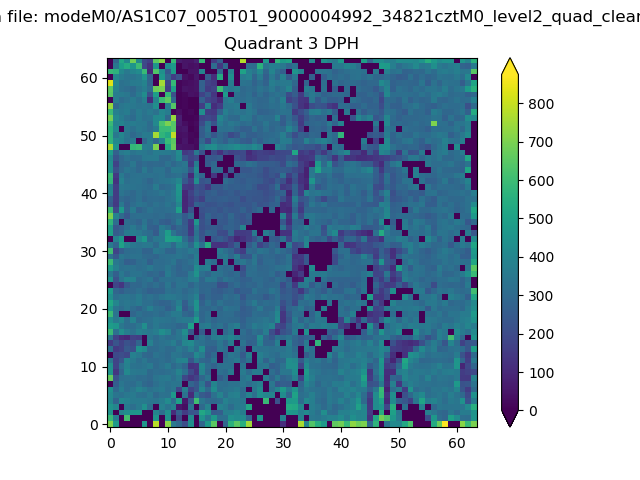 |
 |
Quadrant C |
| Plot type | Count rate plots | Images |
|---|---|---|
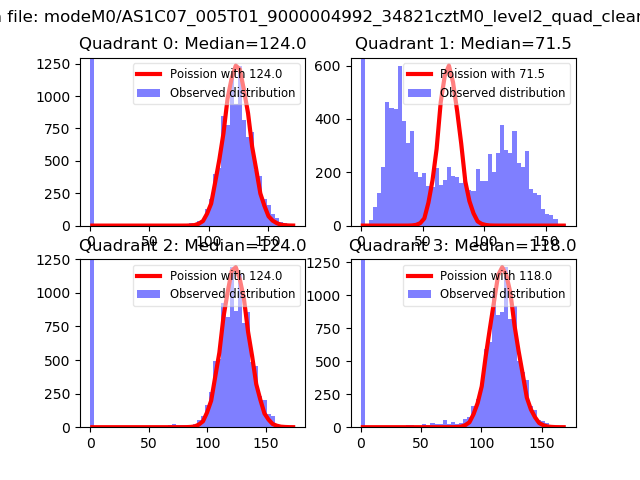
| Comparison with Poisson distribution Blue bars denote a histogram of data divided into 1 sec bins. Red curve is a Poisson curve with rate = median count rate of data. |
 |
 |
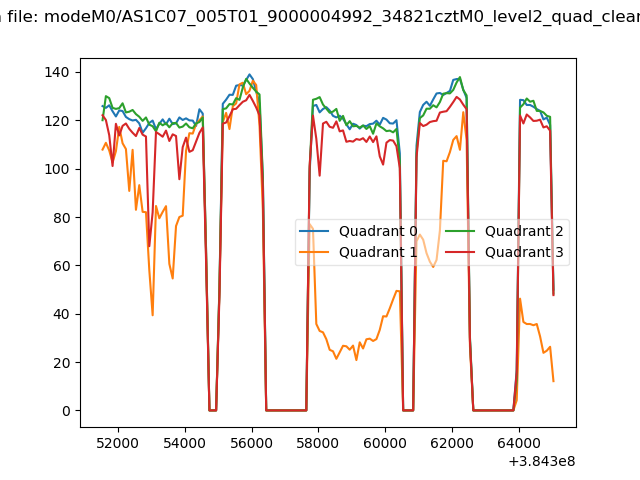
| Quadrant-wise count rates Data is divided into 100 sec bins |
 |
|
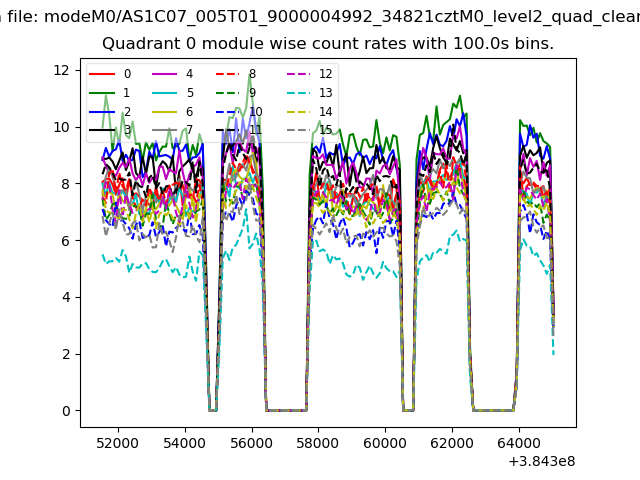
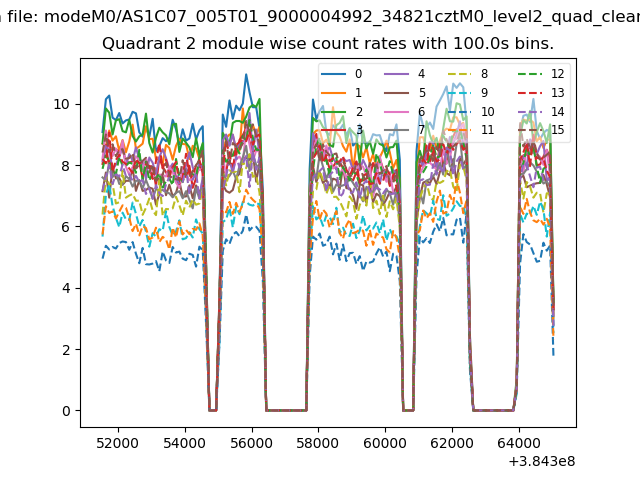
| Module-wise count rates for Quadrant A Data is divided into 100 sec bins |
 |
 |
| Module-wise count rates for Quadrant B Data is divided into 100 sec bins |
 |
 |
| Module-wise count rates for Quadrant C Data is divided into 100 sec bins |
 |
 |
| Module-wise count rates for Quadrant D Data is divided into 100 sec bins |
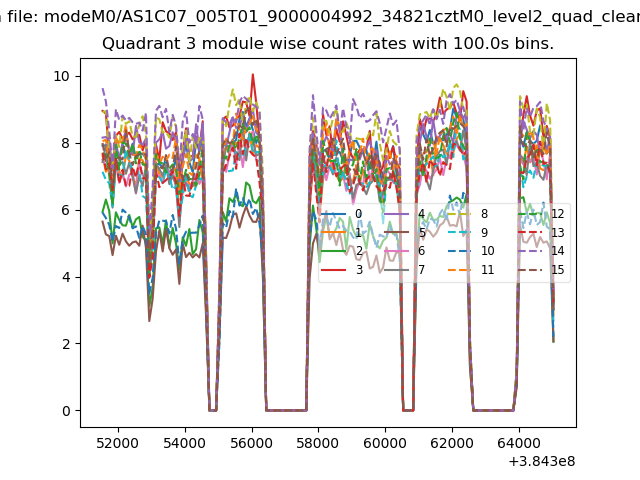 |
 |
| Parameter | Plot |
|---|---|
| CZT HV Monitor | 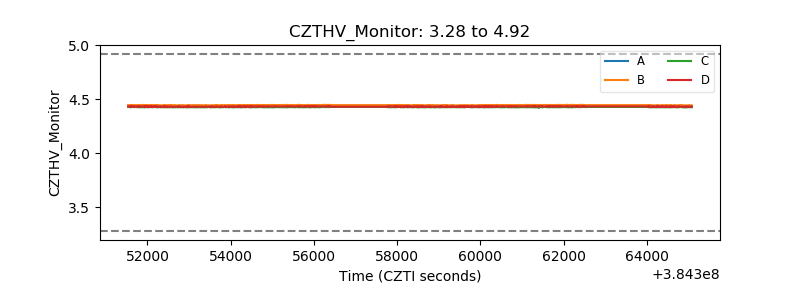 |
| D_VDD | 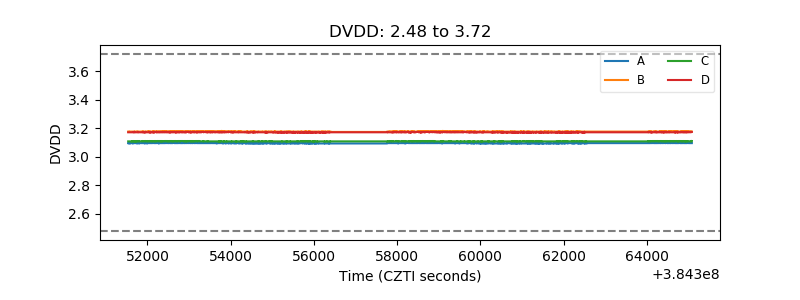 |
| Temperature 1 | 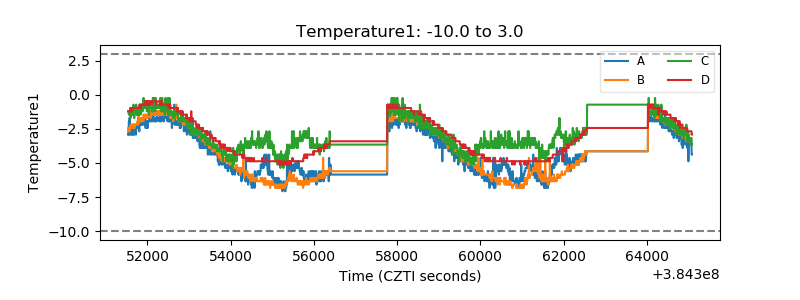 |
| Veto HV Monitor | 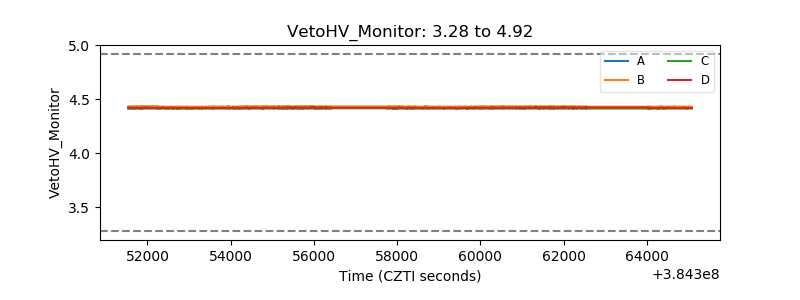 |
| Veto LLD | 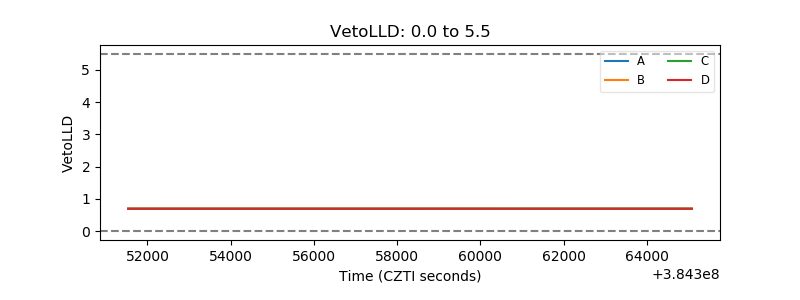 |
| Alpha Counter | 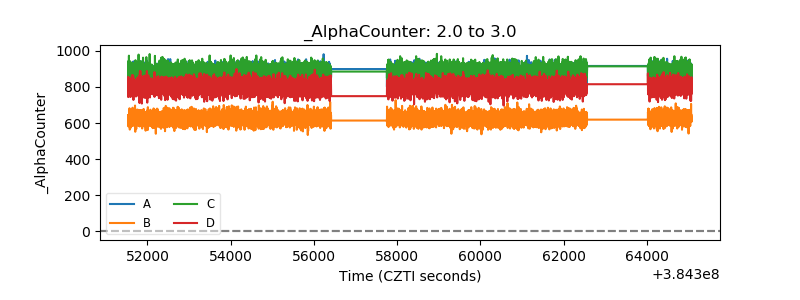 |
| _CPM_Rate | 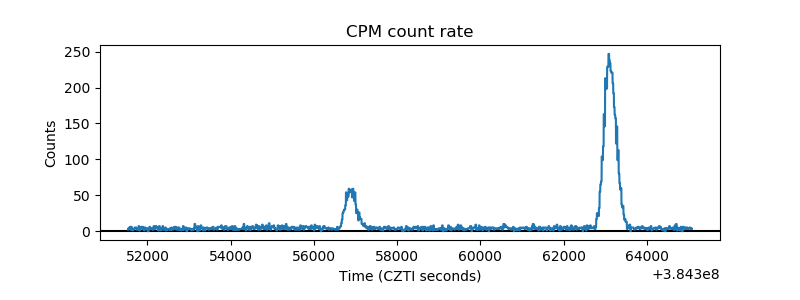 |
| CZT Counter | 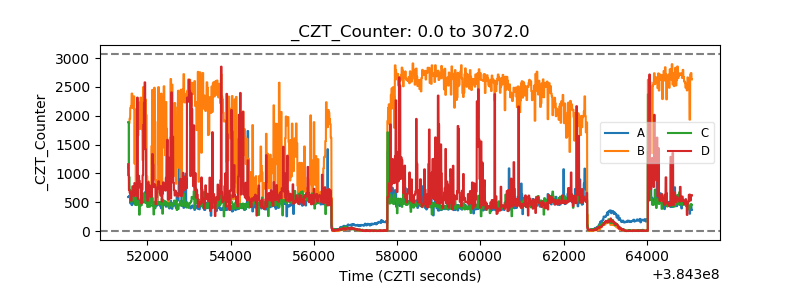 |
| +2.5 Volts monitor | 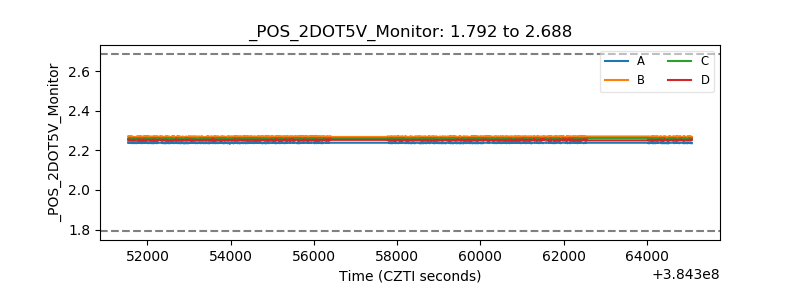 |
| +5 Volts monitor | 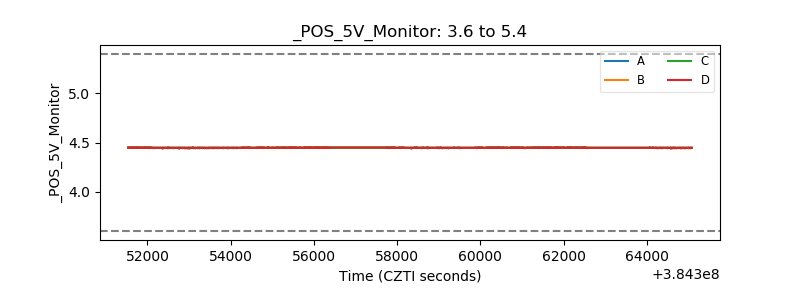 |
| _ROLL_ROT | 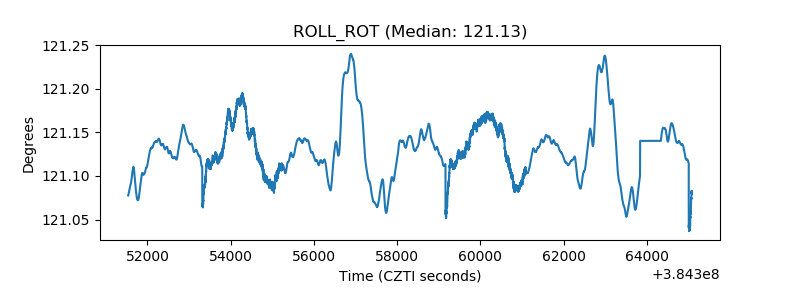 |
| _Roll_DEC | 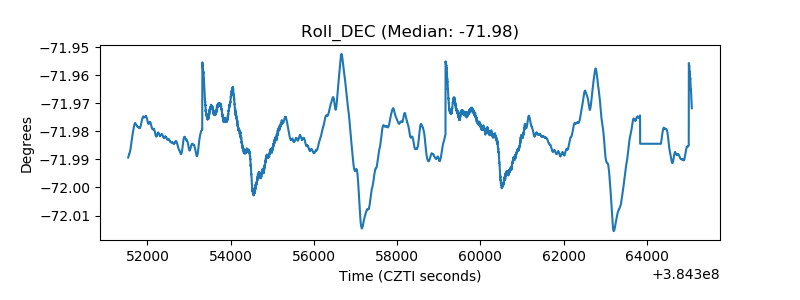 |
| _Roll_RA | 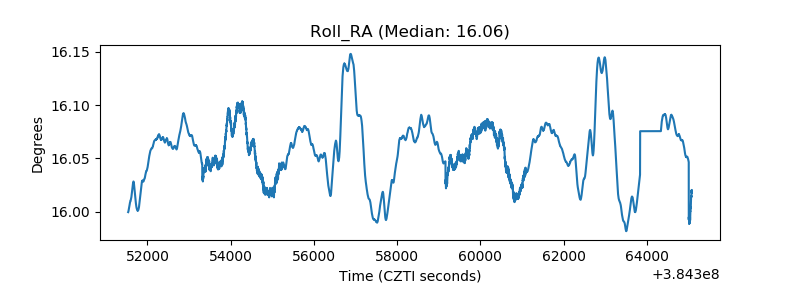 |
| Veto Counter | 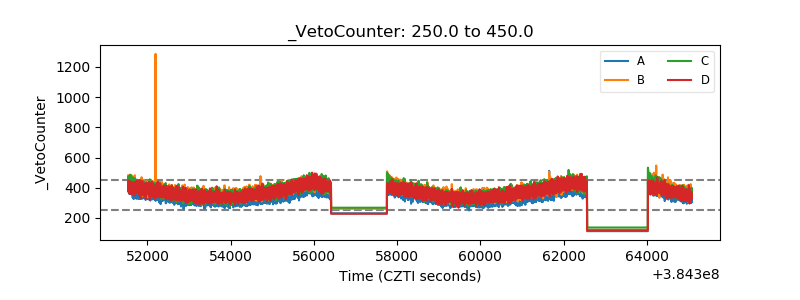 |