| Param | Original file | Final file |
|---|---|---|
| Filename | modeM0/AS1C07_005T01_9000004992_34818cztM0_level2.evt | modeM0/AS1C07_005T01_9000004992_34818cztM0_level2_quad_clean.evt |
| Size (bytes) | 582,615,360 | 104,676,480 |
| Size | 555.6 MB | 99.8 MB |
| Events in quadrant A | 2,780,897 | 708,101 |
| Events in quadrant B | 6,942,342 | 661,591 |
| Events in quadrant C | 3,292,363 | 708,766 |
| Events in quadrant D | 4,220,384 | 669,582 |
| Mode M9 | |||
|---|---|---|---|
| Quadrant | BADHDUFLAG | Total packets | Discarded packets |
| A | 0 | 18 | 0 |
| B | 0 | 18 | 0 |
| C | 0 | 18 | 0 |
| D | 0 | 19 | 0 |
| Mode M0 | |||
|---|---|---|---|
| Quadrant | BADHDUFLAG | Total packets | Discarded packets |
| A | 0 | 12306 | 3 |
| B | 0 | 24760 | 2 |
| C | 0 | 13297 | 2 |
| D | 0 | 16627 | 2 |
| Mode SS | |||
|---|---|---|---|
| Quadrant | BADHDUFLAG | Total packets | Discarded packets |
| A | 0 | 122 | 0 |
| B | 0 | 122 | 0 |
| C | 0 | 122 | 0 |
| D | 0 | 122 | 0 |
| Quadrant | Total seconds | Saturated seconds | Saturation percentage |
|---|---|---|---|
| A | 6041 | 7 | 0.115875% |
| B | 6041 | 1031 | 17.066711% |
| C | 6041 | 77 | 1.274623% |
| D | 6041 | 130 | 2.151962% |
Noise dominated data is calculated using 1-second bins in cleaned event files. If a bin has >2000 counts, and if more than 50% of those come from <1% of pixels, then it is considered to be noise-dominated and hence unusable.
| Quadrant | # 1 sec bins | Bins with >0 counts | Bins with >2000 counts | High rate bins dominated by noise | Noise dominated (total time) | Noise dominated (detector-on time) | Marked lightcurve |
|---|---|---|---|---|---|---|---|
| A | 7354 | 6042 | 1 | 1 | 0.01% | 0.02% | 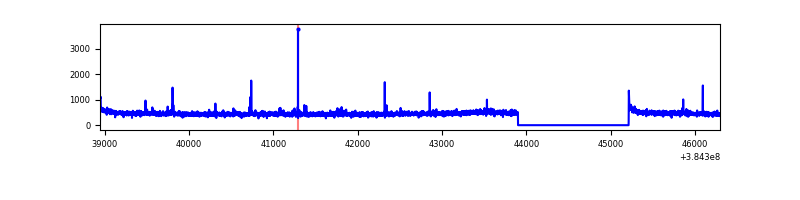 |
| B | 7354 | 6042 | 788 | 788 | 10.72% | 13.04% | 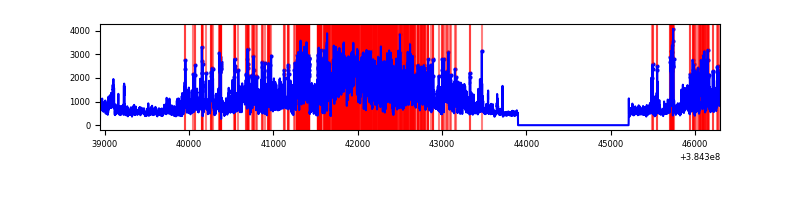 |
| C | 7354 | 6042 | 58 | 58 | 0.79% | 0.96% | 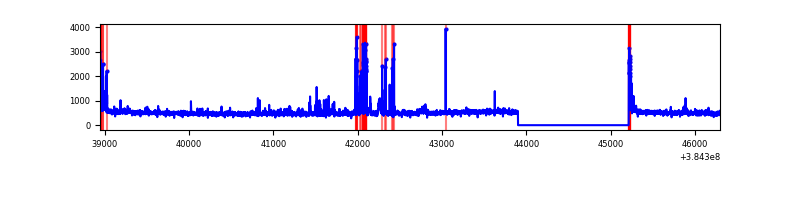 |
| D | 7354 | 6042 | 119 | 119 | 1.62% | 1.97% | 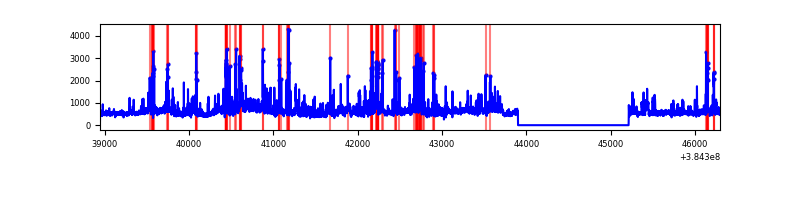 |
Top three noisy pixels from each quadrant. If the there are fewer than three noisy pixels in the level2.evt file, extra rows are filled as -1
| Pixel properties | Quadrant properties | ||||||
|---|---|---|---|---|---|---|---|
| Quadrant | DetID | PixID | Counts | Sigma | Mean | Median | Sigma |
| A | 10 | 83 | 53483 | 383.33 | 690 | 678 | 137.8 |
| A | 7 | 16 | 28835 | 204.4 | 690 | 678 | 137.8 |
| A | 13 | 254 | 11119 | 75.79 | 690 | 678 | 137.8 |
| B | 4 | 251 | 3879247 | 31382.38 | 653 | 635 | 123.6 |
| B | 5 | 172 | 276305 | 2230.48 | 653 | 635 | 123.6 |
| B | 10 | 245 | 89493 | 718.96 | 653 | 635 | 123.6 |
| C | 15 | 214 | 276668 | 1778.08 | 668 | 671 | 155.2 |
| C | 0 | 207 | 183314 | 1176.66 | 668 | 671 | 155.2 |
| C | 0 | 10 | 117790 | 754.53 | 668 | 671 | 155.2 |
| D | 8 | 195 | 719014 | 4385.99 | 668 | 650 | 163.8 |
| D | 14 | 52 | 149973 | 911.7 | 668 | 650 | 163.8 |
| D | 2 | 250 | 148677 | 903.78 | 668 | 650 | 163.8 |
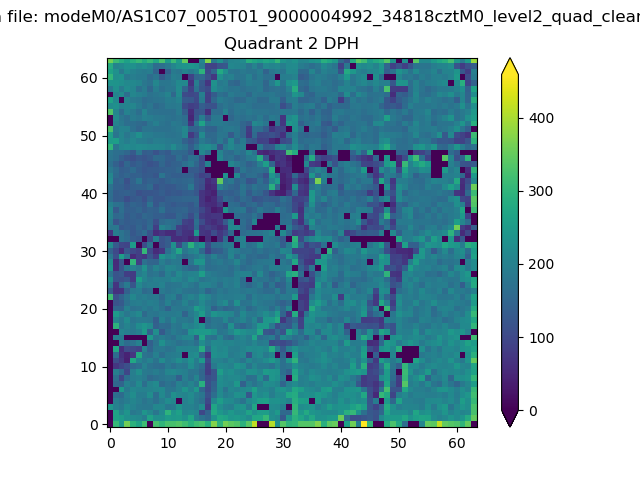
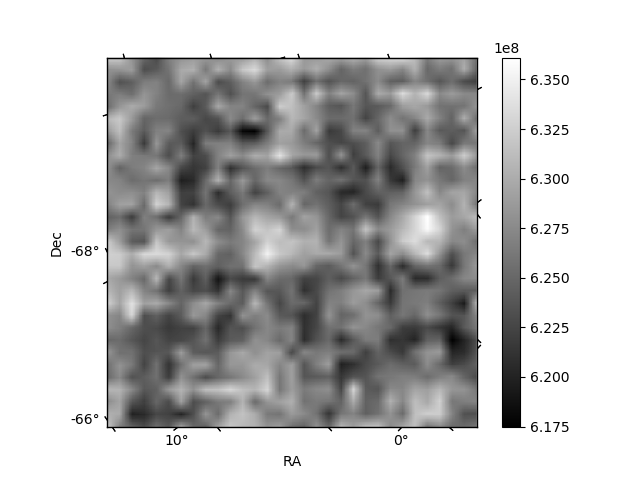
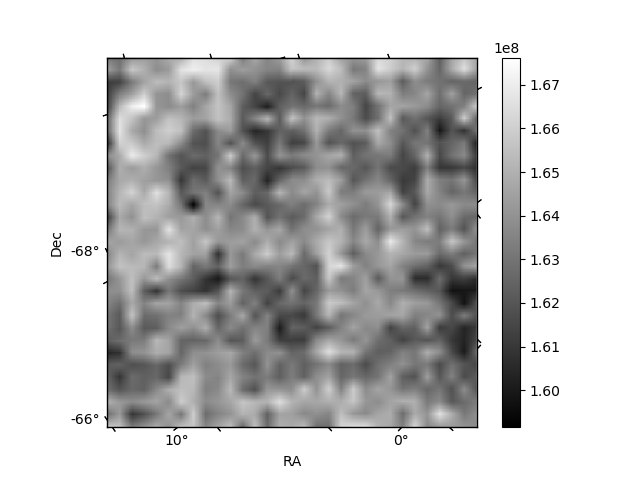
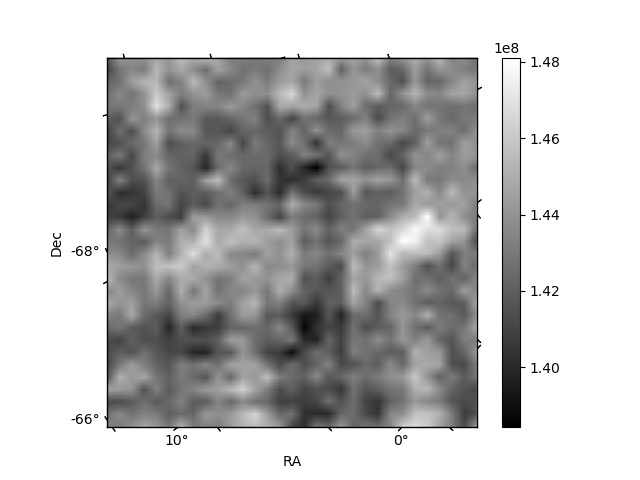
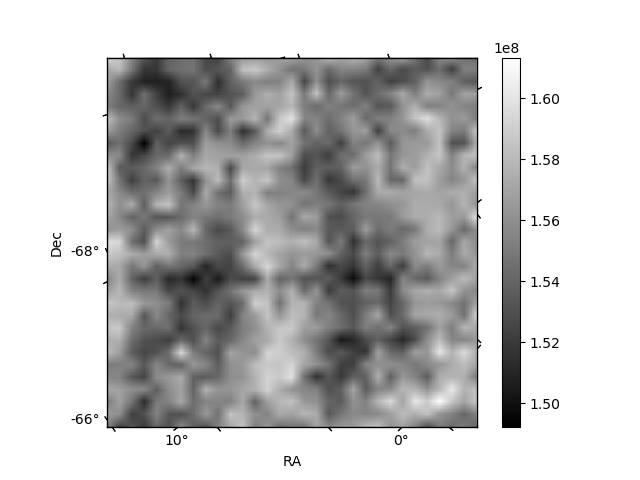
Histogram calculated using DETX and DETY for each event in the final _common_clean file
| Quadrant A | 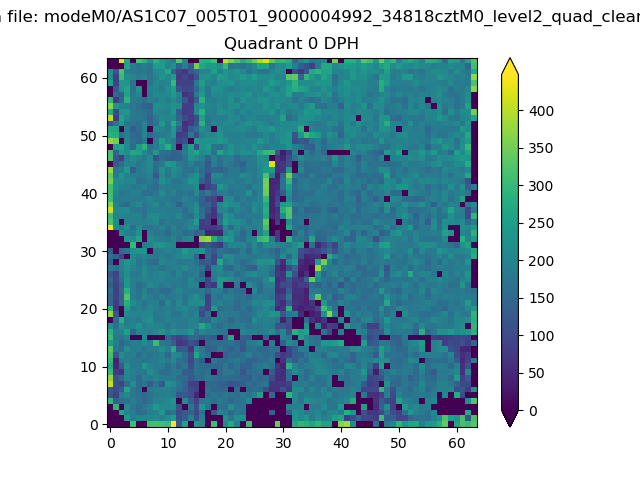 |
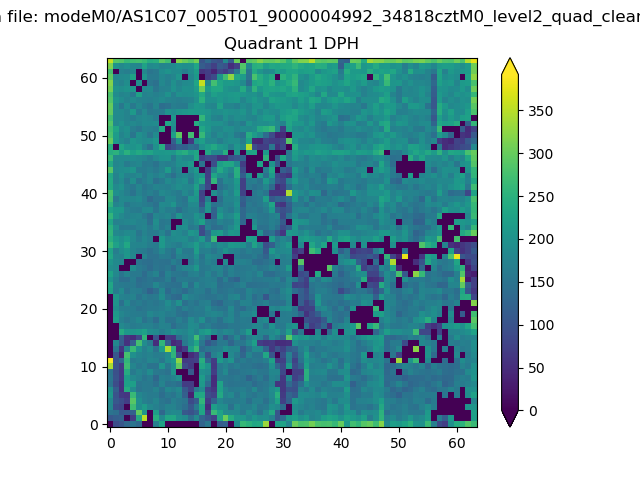 |
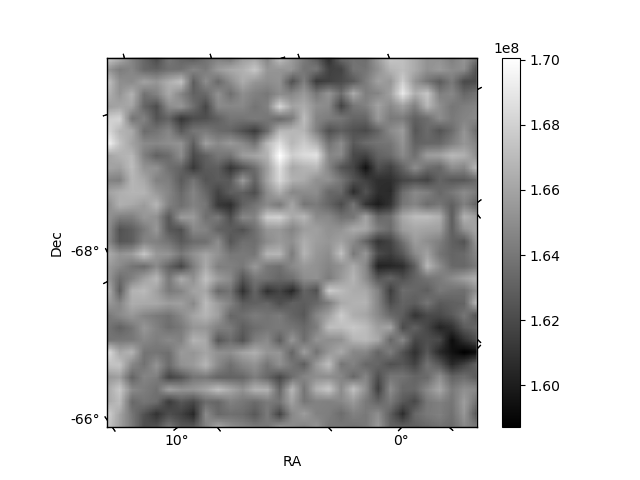
Quadrant B |
|---|---|---|---|
| Quadrant D | 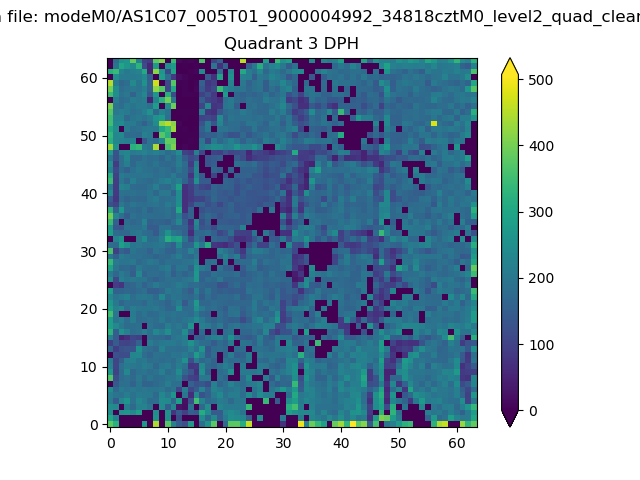 |
 |
Quadrant C |
| Plot type | Count rate plots | Images |
|---|---|---|
| Comparison with Poisson distribution Blue bars denote a histogram of data divided into 1 sec bins. Red curve is a Poisson curve with rate = median count rate of data. |
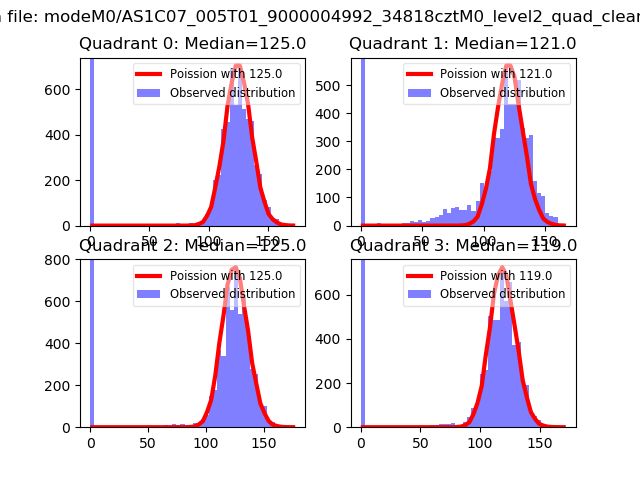 |
 |
| Quadrant-wise count rates Data is divided into 100 sec bins |
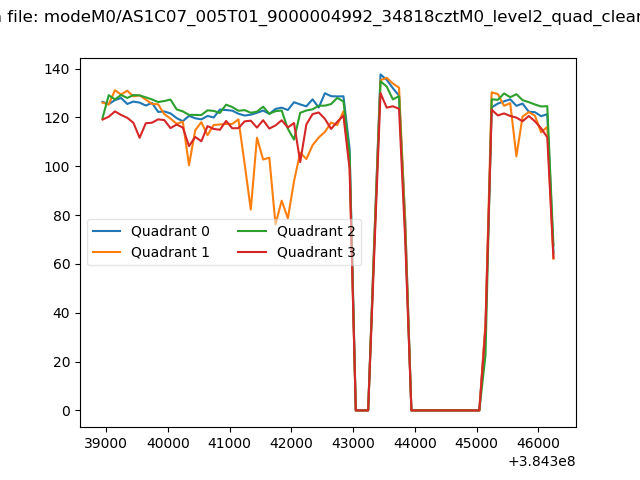 |
|
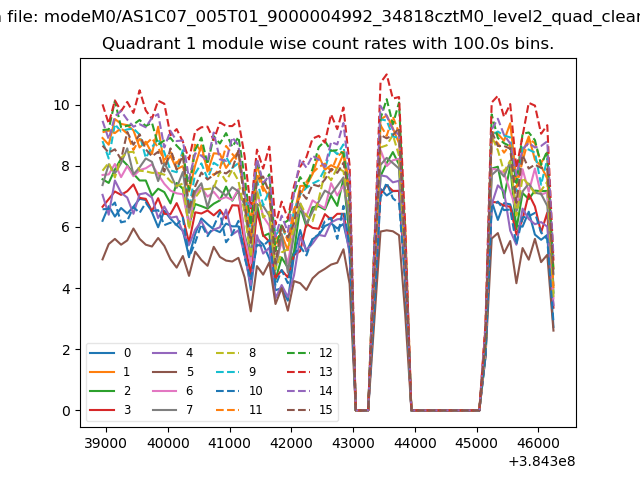
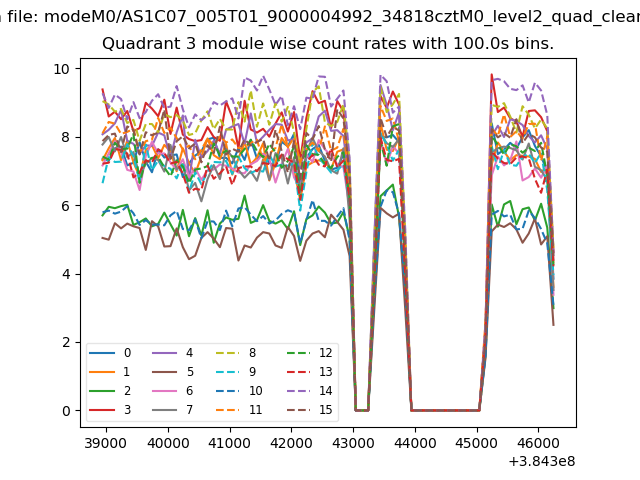
| Module-wise count rates for Quadrant A Data is divided into 100 sec bins |
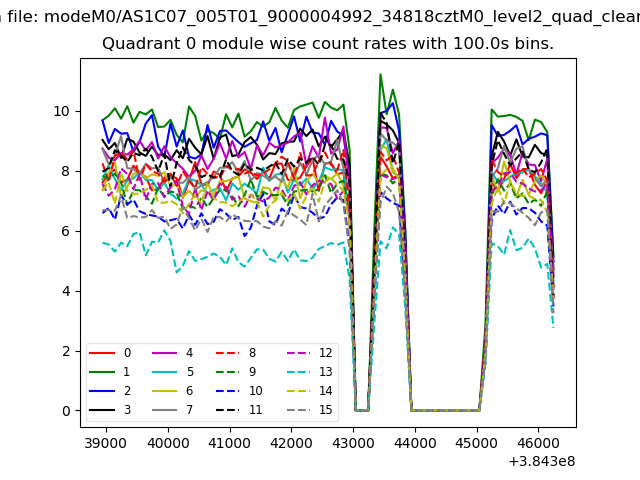 |
 |
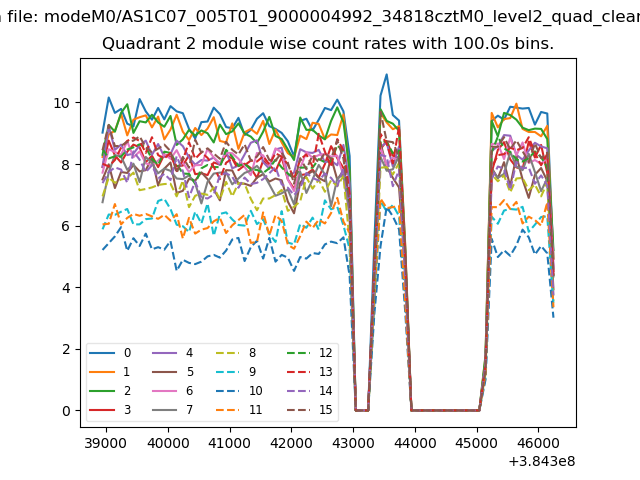
| Module-wise count rates for Quadrant B Data is divided into 100 sec bins |
 |
 |
| Module-wise count rates for Quadrant C Data is divided into 100 sec bins |
 |
 |
| Module-wise count rates for Quadrant D Data is divided into 100 sec bins |
 |
 |
| Parameter | Plot |
|---|---|
| CZT HV Monitor | 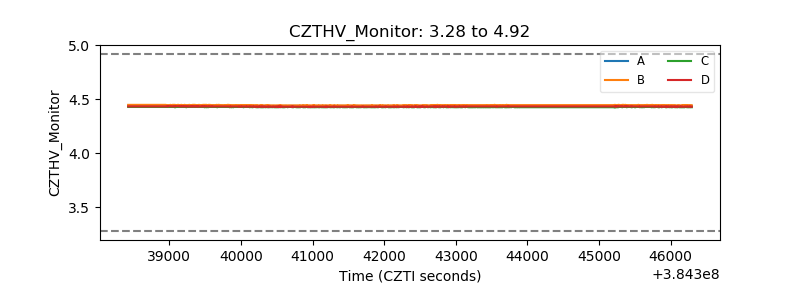 |
| D_VDD | 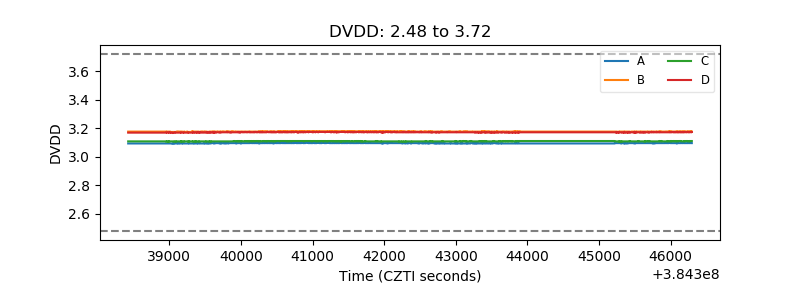 |
| Temperature 1 | 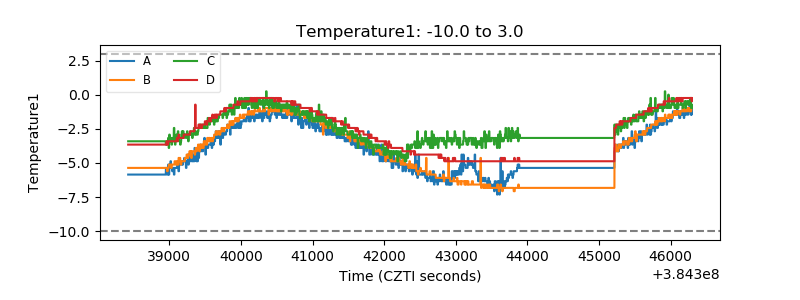 |
| Veto HV Monitor |  |
| Veto LLD | 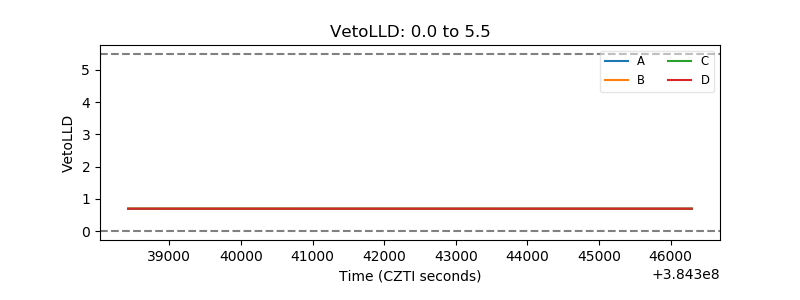 |
| Alpha Counter | 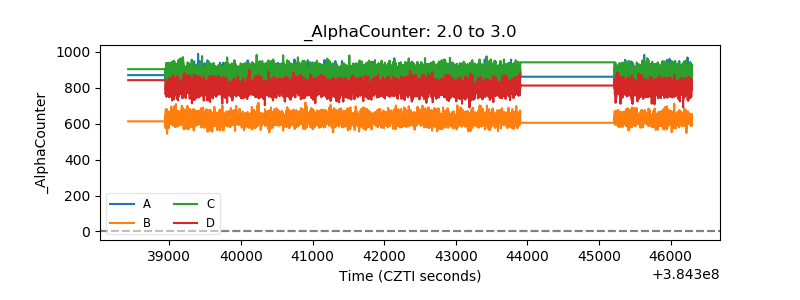 |
| _CPM_Rate | 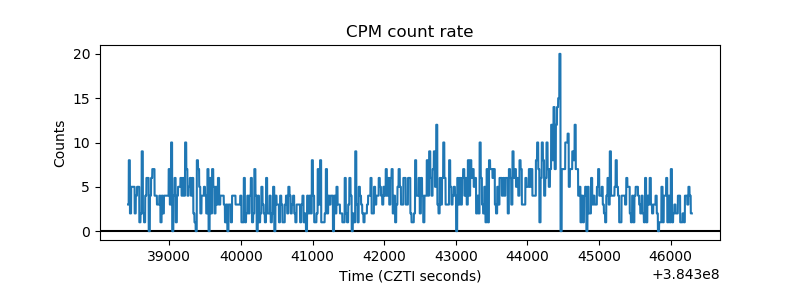 |
| CZT Counter | 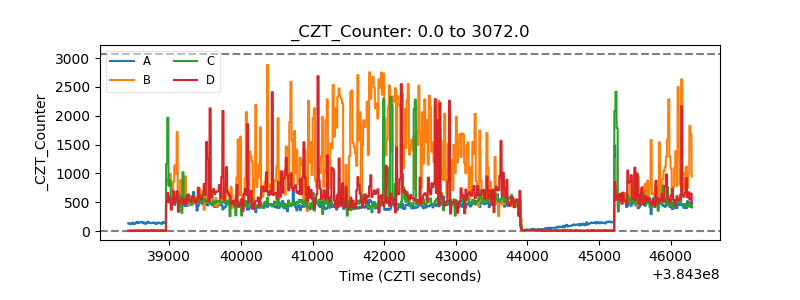 |
| +2.5 Volts monitor | 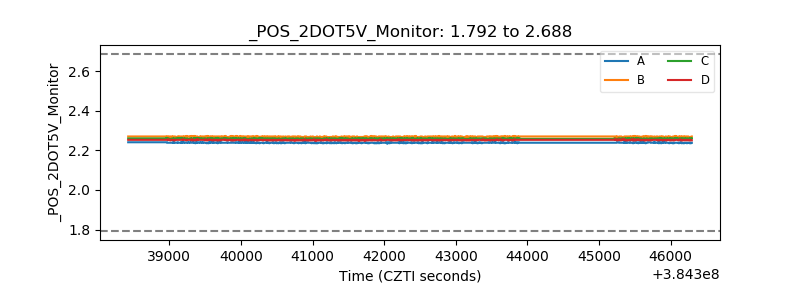 |
| +5 Volts monitor | 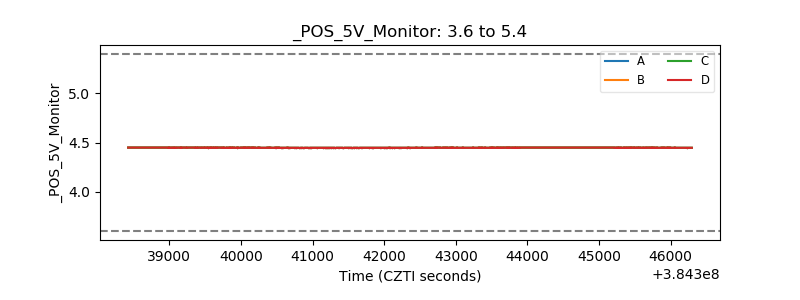 |
| _ROLL_ROT | 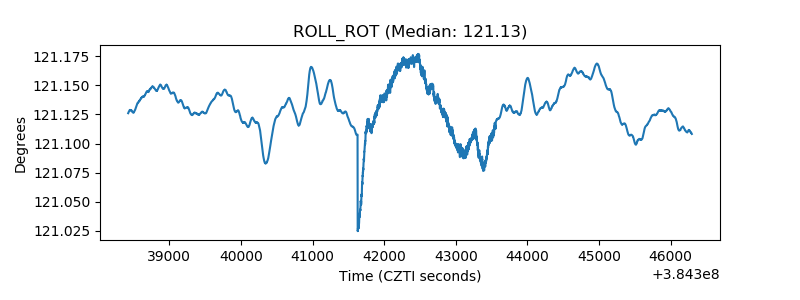 |
| _Roll_DEC | 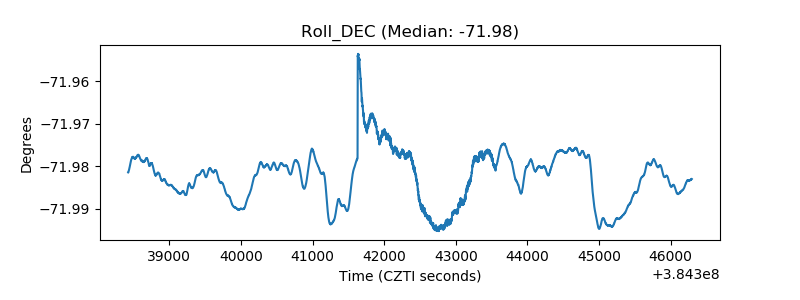 |
| _Roll_RA | 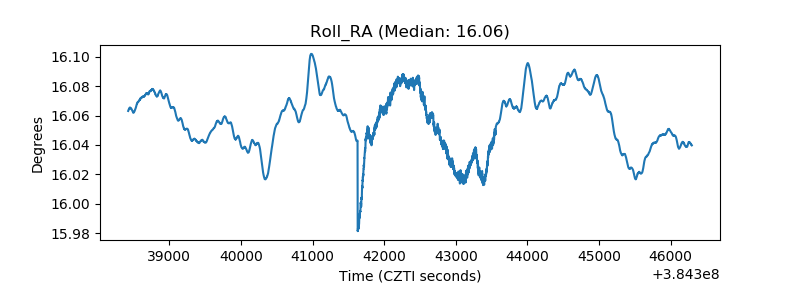 |
| Veto Counter | 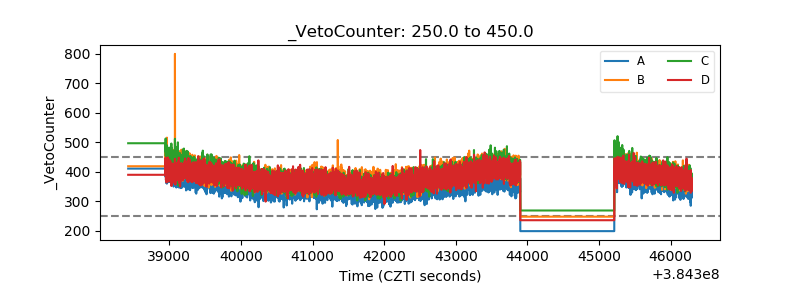 |