| Param | Original file | Final file |
|---|---|---|
| Filename | modeM0/AS1C07_005T01_9000004992_34816cztM0_level2.evt | modeM0/AS1C07_005T01_9000004992_34816cztM0_level2_quad_clean.evt |
| Size (bytes) | 762,704,640 | 84,568,320 |
| Size | 727.4 MB | 80.7 MB |
| Events in quadrant A | 3,335,606 | 676,040 |
| Events in quadrant B | 12,677,010 | 203,154 |
| Events in quadrant C | 3,117,350 | 674,557 |
| Events in quadrant D | 3,617,620 | 641,164 |
| Mode M9 | |||
|---|---|---|---|
| Quadrant | BADHDUFLAG | Total packets | Discarded packets |
| A | 0 | 23 | 0 |
| B | 0 | 23 | 0 |
| C | 0 | 23 | 0 |
| D | 0 | 24 | 0 |
| Mode M0 | |||
|---|---|---|---|
| Quadrant | BADHDUFLAG | Total packets | Discarded packets |
| A | 0 | 13205 | 3 |
| B | 0 | 41134 | 2 |
| C | 0 | 12287 | 2 |
| D | 0 | 14349 | 2 |
| Mode SS | |||
|---|---|---|---|
| Quadrant | BADHDUFLAG | Total packets | Discarded packets |
| A | 0 | 106 | 0 |
| B | 0 | 106 | 0 |
| C | 0 | 106 | 0 |
| D | 0 | 106 | 0 |
| Quadrant | Total seconds | Saturated seconds | Saturation percentage |
|---|---|---|---|
| A | 5189 | 32 | 0.616689% |
| B | 5189 | 4878 | 94.006552% |
| C | 5189 | 131 | 2.524571% |
| D | 5189 | 135 | 2.601657% |
Noise dominated data is calculated using 1-second bins in cleaned event files. If a bin has >2000 counts, and if more than 50% of those come from <1% of pixels, then it is considered to be noise-dominated and hence unusable.
| Quadrant | # 1 sec bins | Bins with >0 counts | Bins with >2000 counts | High rate bins dominated by noise | Noise dominated (total time) | Noise dominated (detector-on time) | Marked lightcurve |
|---|---|---|---|---|---|---|---|
| A | 7042 | 5190 | 16 | 16 | 0.23% | 0.31% | 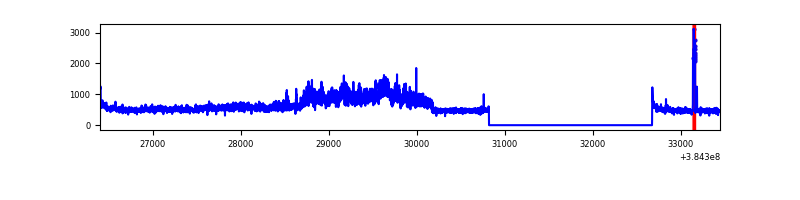 |
| B | 7042 | 5190 | 4667 | 4667 | 66.27% | 89.92% |  |
| C | 7042 | 5190 | 102 | 102 | 1.45% | 1.97% | 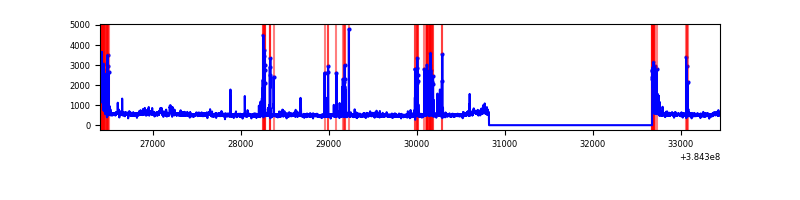 |
| D | 7042 | 5190 | 125 | 125 | 1.78% | 2.41% | 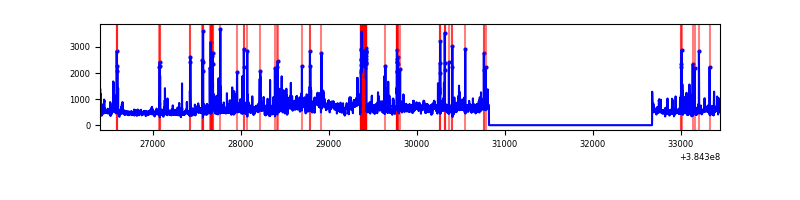 |
Top three noisy pixels from each quadrant. If the there are fewer than three noisy pixels in the level2.evt file, extra rows are filled as -1
| Pixel properties | Quadrant properties | ||||||
|---|---|---|---|---|---|---|---|
| Quadrant | DetID | PixID | Counts | Sigma | Mean | Median | Sigma |
| A | 15 | 169 | 891617 | 7324.63 | 602 | 591 | 121.6 |
| A | 15 | 174 | 53636 | 436.05 | 602 | 591 | 121.6 |
| A | 10 | 83 | 51160 | 415.7 | 602 | 591 | 121.6 |
| B | 4 | 251 | 11505577 | 270133.96 | 220 | 215 | 42.6 |
| B | 5 | 255 | 145611 | 3413.75 | 220 | 215 | 42.6 |
| B | 15 | 222 | 78227 | 1831.64 | 220 | 215 | 42.6 |
| C | 15 | 214 | 241211 | 1789.84 | 584 | 586 | 134.4 |
| C | 0 | 207 | 228978 | 1698.85 | 584 | 586 | 134.4 |
| C | 0 | 10 | 189140 | 1402.52 | 584 | 586 | 134.4 |
| D | 8 | 195 | 584777 | 3812.95 | 581 | 569 | 153.2 |
| D | 13 | 249 | 235172 | 1531.18 | 581 | 569 | 153.2 |
| D | 12 | 233 | 91711 | 594.86 | 581 | 569 | 153.2 |
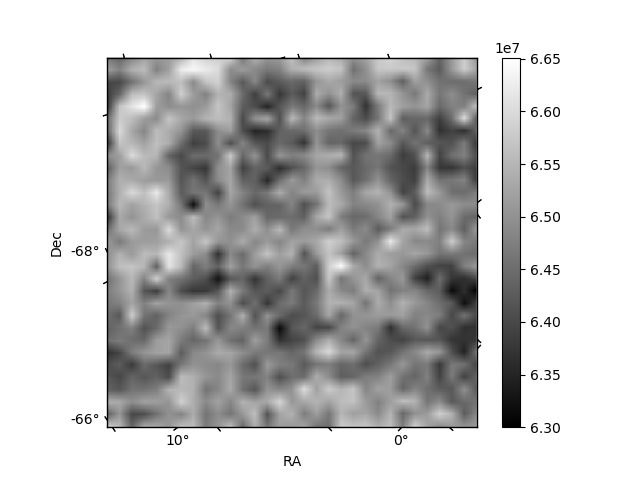
Histogram calculated using DETX and DETY for each event in the final _common_clean file
| Quadrant A |  |
 |
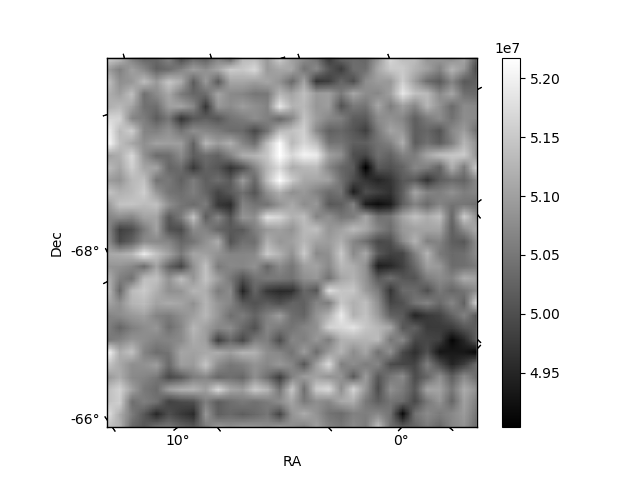
Quadrant B |
|---|---|---|---|
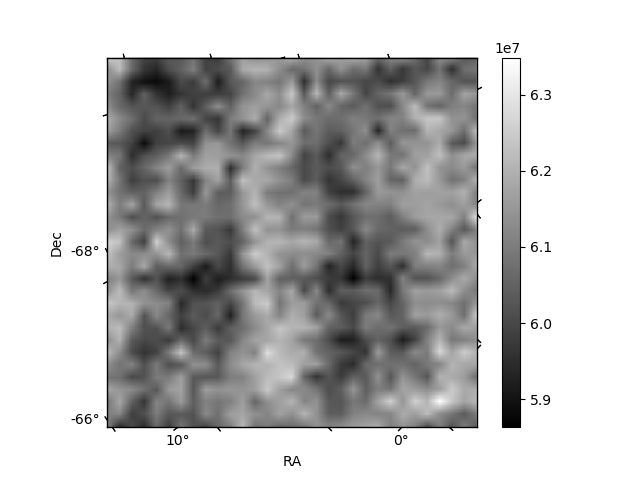
| Quadrant D | 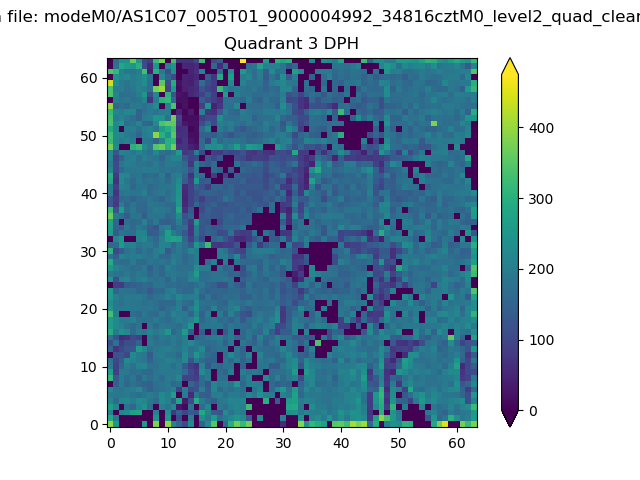 |
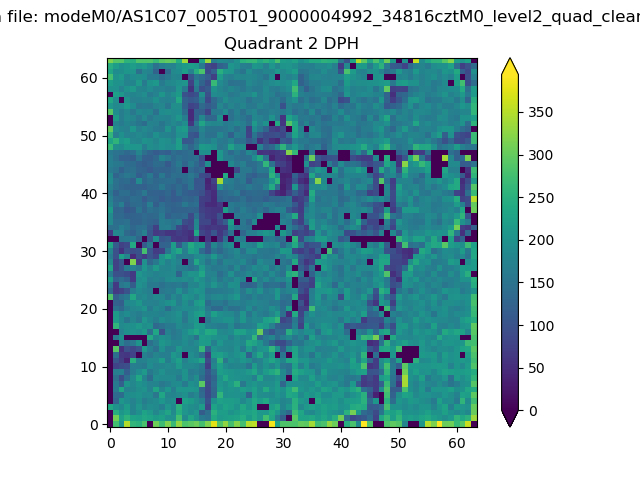 |
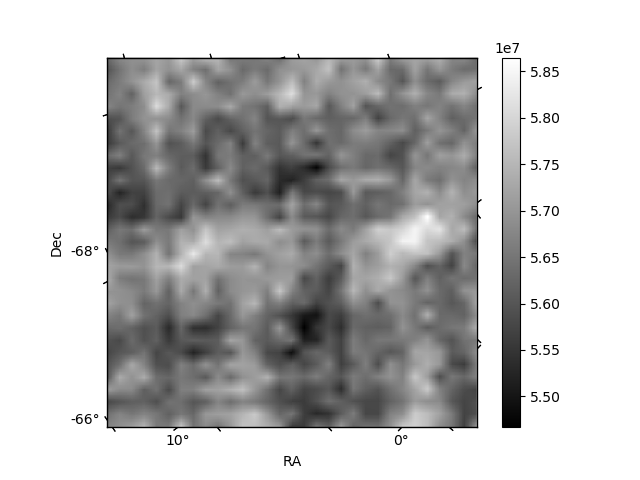
Quadrant C |
| Plot type | Count rate plots | Images |
|---|---|---|
| Comparison with Poisson distribution Blue bars denote a histogram of data divided into 1 sec bins. Red curve is a Poisson curve with rate = median count rate of data. |
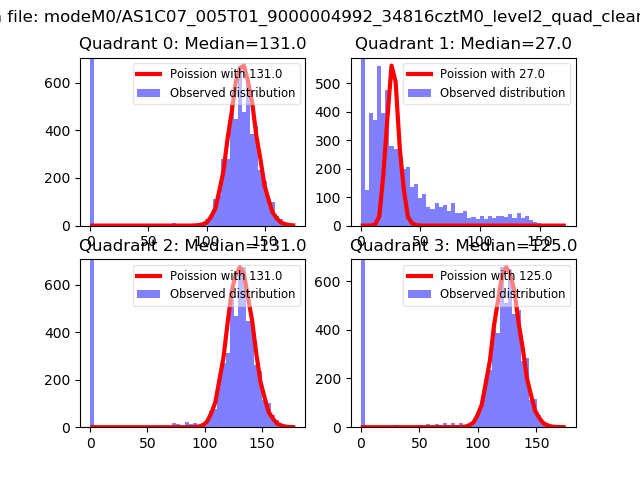 |
 |
| Quadrant-wise count rates Data is divided into 100 sec bins |
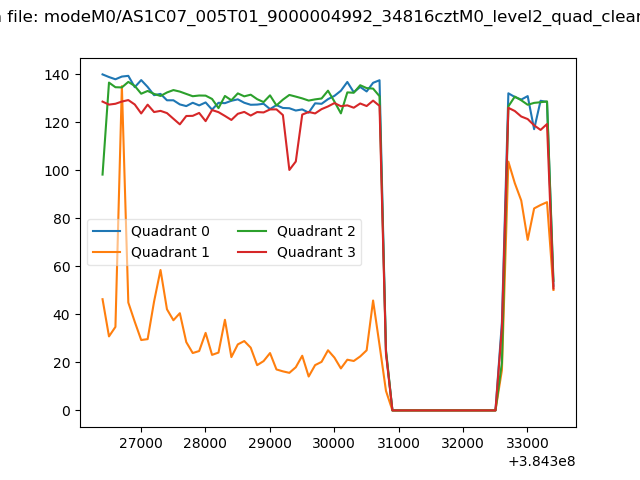 |
|
| Module-wise count rates for Quadrant A Data is divided into 100 sec bins |
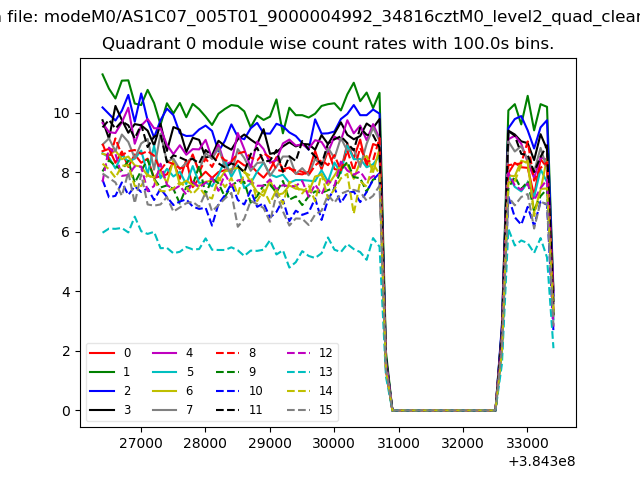 |
 |
| Module-wise count rates for Quadrant B Data is divided into 100 sec bins |
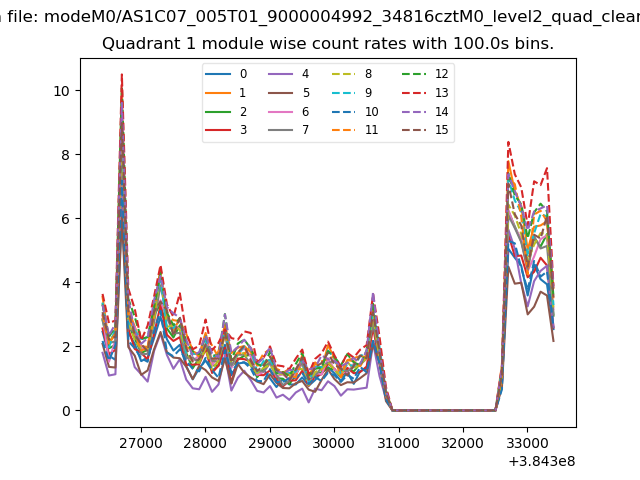 |
 |
| Module-wise count rates for Quadrant C Data is divided into 100 sec bins |
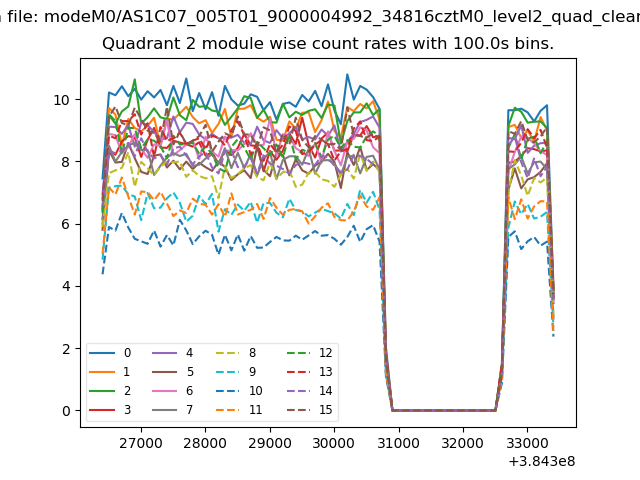 |
 |
| Module-wise count rates for Quadrant D Data is divided into 100 sec bins |
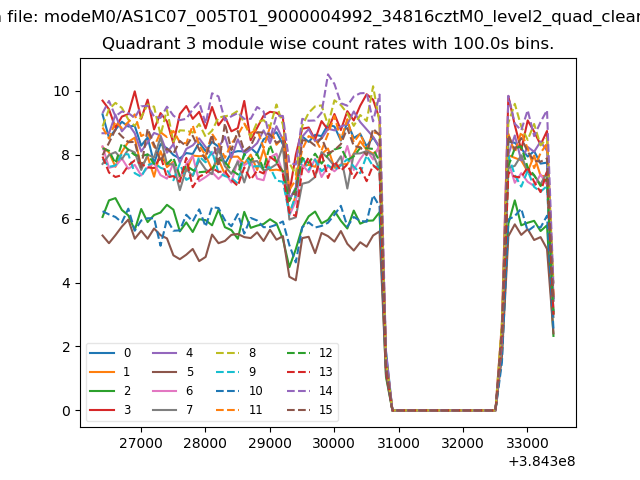 |
 |
| Parameter | Plot |
|---|---|
| CZT HV Monitor | 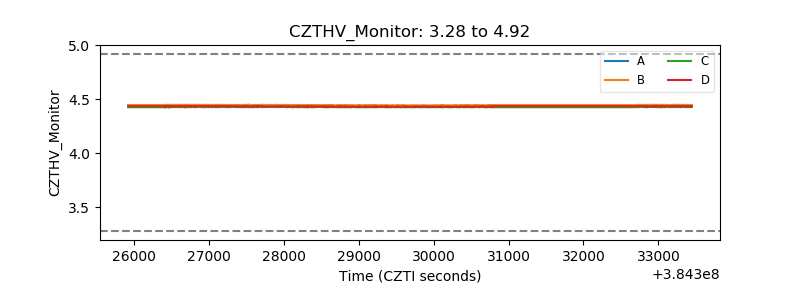 |
| D_VDD | 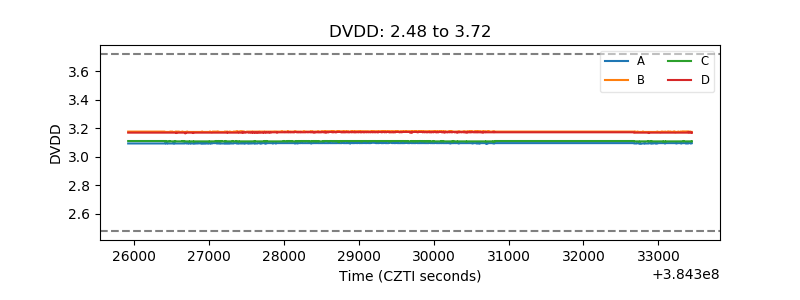 |
| Temperature 1 | 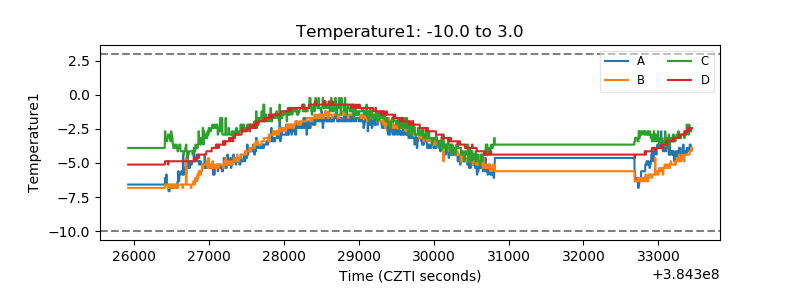 |
| Veto HV Monitor | 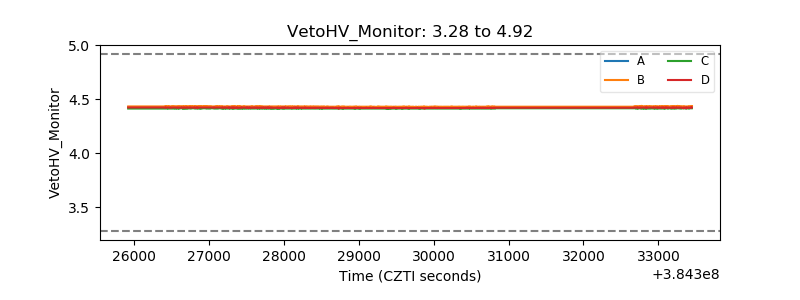 |
| Veto LLD | 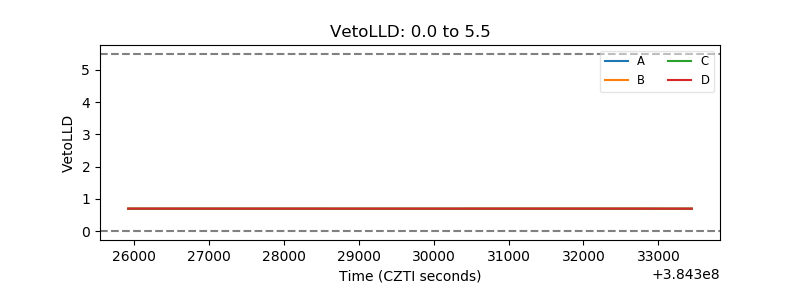 |
| Alpha Counter | 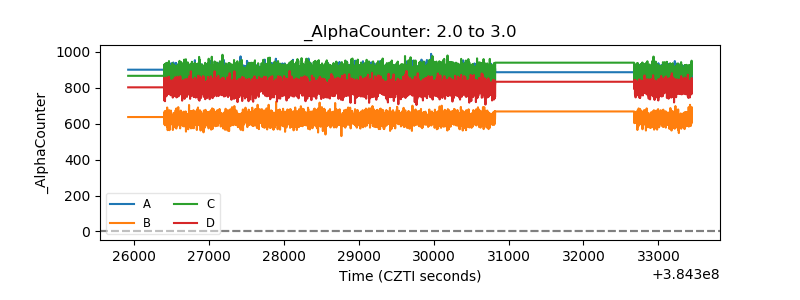 |
| _CPM_Rate | 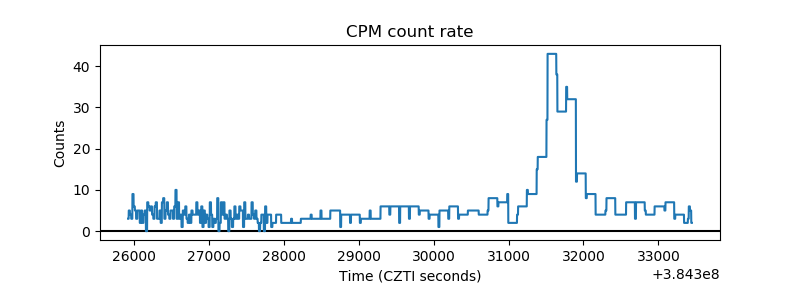 |
| CZT Counter | 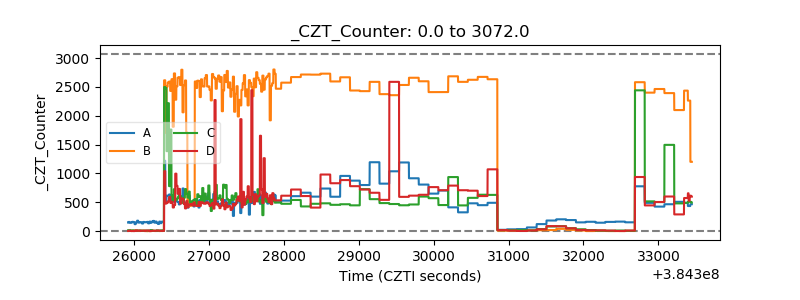 |
| +2.5 Volts monitor | 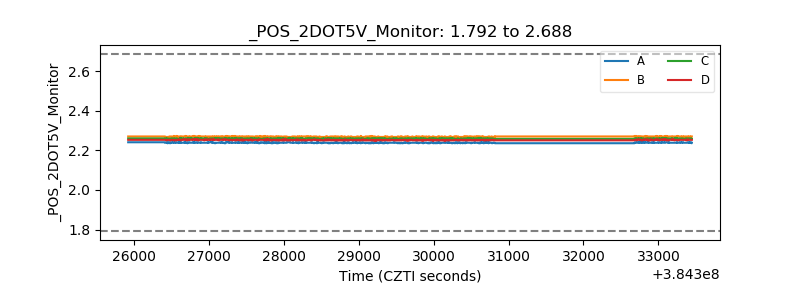 |
| +5 Volts monitor | 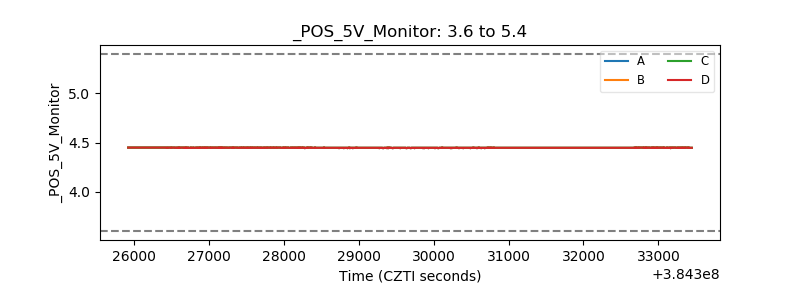 |
| _ROLL_ROT | 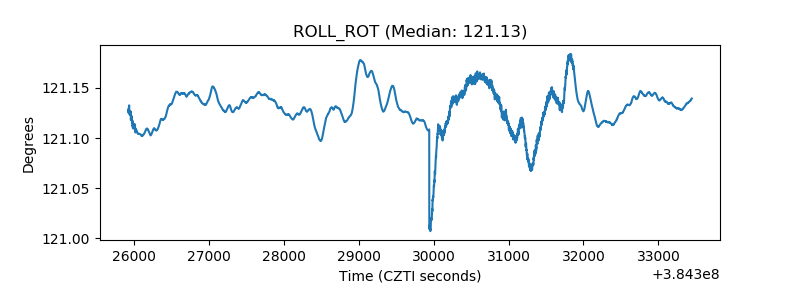 |
| _Roll_DEC | 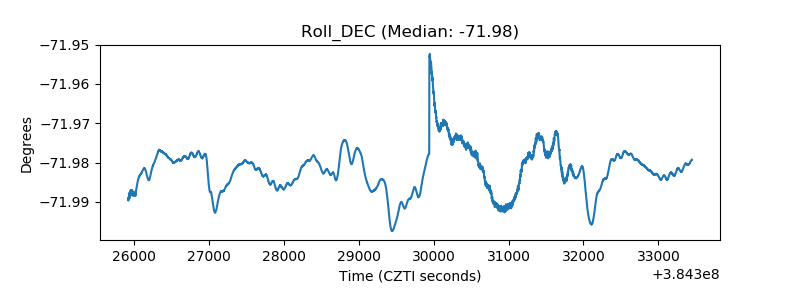 |
| _Roll_RA | 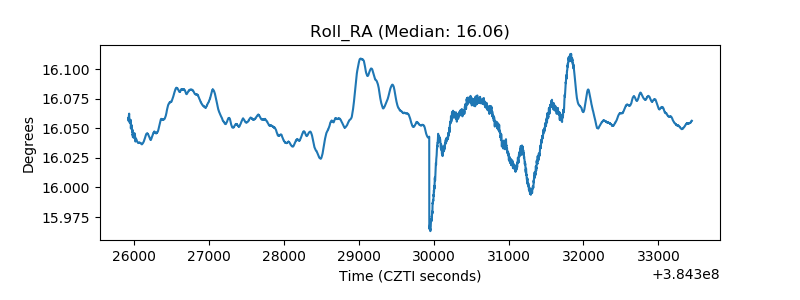 |
| Veto Counter |  |