| Param | Original file | Final file |
|---|---|---|
| Filename | modeM0/AS1C07_005T01_9000004992_34815cztM0_level2.evt | modeM0/AS1C07_005T01_9000004992_34815cztM0_level2_quad_clean.evt |
| Size (bytes) | 737,262,720 | 87,569,280 |
| Size | 703.1 MB | 83.5 MB |
| Events in quadrant A | 2,995,479 | 707,589 |
| Events in quadrant B | 12,241,645 | 207,164 |
| Events in quadrant C | 3,038,190 | 708,452 |
| Events in quadrant D | 3,708,396 | 669,790 |
| Mode M9 | |||
|---|---|---|---|
| Quadrant | BADHDUFLAG | Total packets | Discarded packets |
| A | 0 | 28 | 0 |
| B | 0 | 28 | 0 |
| C | 0 | 28 | 0 |
| D | 0 | 29 | 0 |
| Mode M0 | |||
|---|---|---|---|
| Quadrant | BADHDUFLAG | Total packets | Discarded packets |
| A | 0 | 12144 | 3 |
| B | 0 | 39754 | 2 |
| C | 0 | 11939 | 2 |
| D | 0 | 14617 | 2 |
| Mode SS | |||
|---|---|---|---|
| Quadrant | BADHDUFLAG | Total packets | Discarded packets |
| A | 0 | 104 | 0 |
| B | 0 | 104 | 0 |
| C | 0 | 104 | 0 |
| D | 0 | 104 | 0 |
| Quadrant | Total seconds | Saturated seconds | Saturation percentage |
|---|---|---|---|
| A | 5089 | 13 | 0.255453% |
| B | 5089 | 4771 | 93.751228% |
| C | 5089 | 100 | 1.965023% |
| D | 5089 | 94 | 1.847121% |
Noise dominated data is calculated using 1-second bins in cleaned event files. If a bin has >2000 counts, and if more than 50% of those come from <1% of pixels, then it is considered to be noise-dominated and hence unusable.
| Quadrant | # 1 sec bins | Bins with >0 counts | Bins with >2000 counts | High rate bins dominated by noise | Noise dominated (total time) | Noise dominated (detector-on time) | Marked lightcurve |
|---|---|---|---|---|---|---|---|
| A | 7152 | 5090 | 1 | 1 | 0.01% | 0.02% | 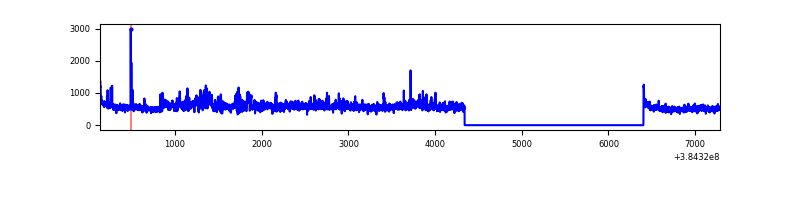 |
| B | 7151 | 5088 | 4623 | 4623 | 64.65% | 90.86% |  |
| C | 7152 | 5090 | 66 | 66 | 0.92% | 1.30% |  |
| D | 7152 | 5090 | 85 | 85 | 1.19% | 1.67% |  |
Top three noisy pixels from each quadrant. If the there are fewer than three noisy pixels in the level2.evt file, extra rows are filled as -1
| Pixel properties | Quadrant properties | ||||||
|---|---|---|---|---|---|---|---|
| Quadrant | DetID | PixID | Counts | Sigma | Mean | Median | Sigma |
| A | 15 | 169 | 289980 | 2357.29 | 616 | 605 | 122.8 |
| A | 0 | 247 | 233851 | 1900.06 | 616 | 605 | 122.8 |
| A | 10 | 83 | 50299 | 404.81 | 616 | 605 | 122.8 |
| B | 4 | 251 | 11279343 | 266595.09 | 218 | 213 | 42.3 |
| B | 5 | 172 | 56208 | 1323.51 | 218 | 213 | 42.3 |
| B | 5 | 255 | 20779 | 486.1 | 218 | 213 | 42.3 |
| C | 0 | 10 | 249502 | 1793.83 | 602 | 606 | 138.8 |
| C | 15 | 214 | 234022 | 1682.26 | 602 | 606 | 138.8 |
| C | 14 | 67 | 173837 | 1248.5 | 602 | 606 | 138.8 |
| D | 8 | 195 | 552107 | 3430.3 | 597 | 585 | 160.8 |
| D | 12 | 227 | 431917 | 2682.76 | 597 | 585 | 160.8 |
| D | 12 | 233 | 99789 | 617.02 | 597 | 585 | 160.8 |
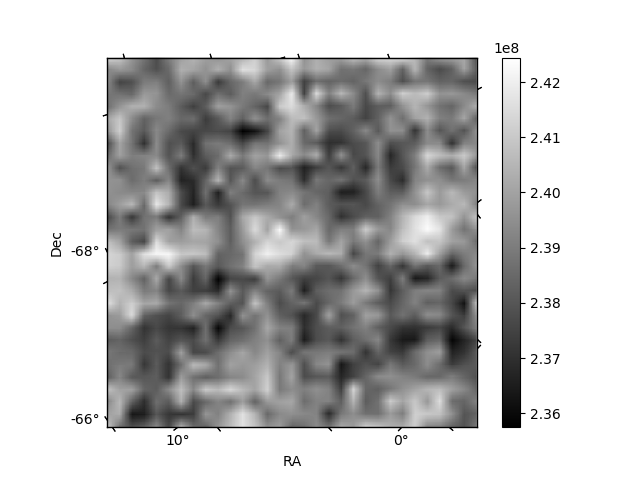
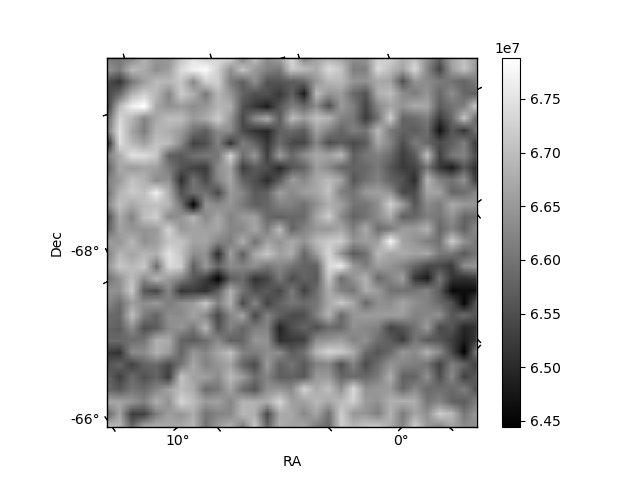
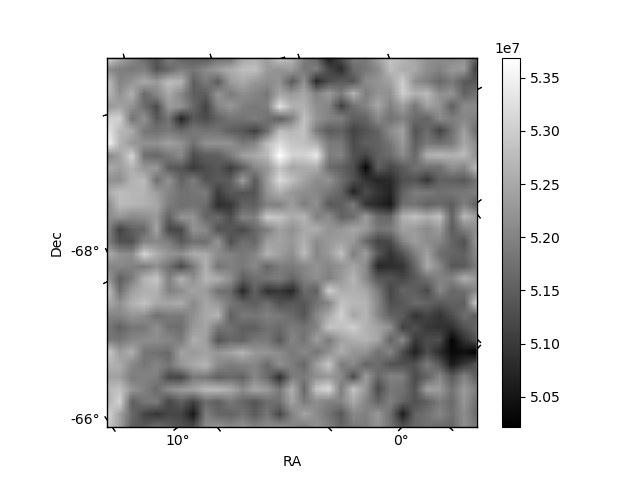
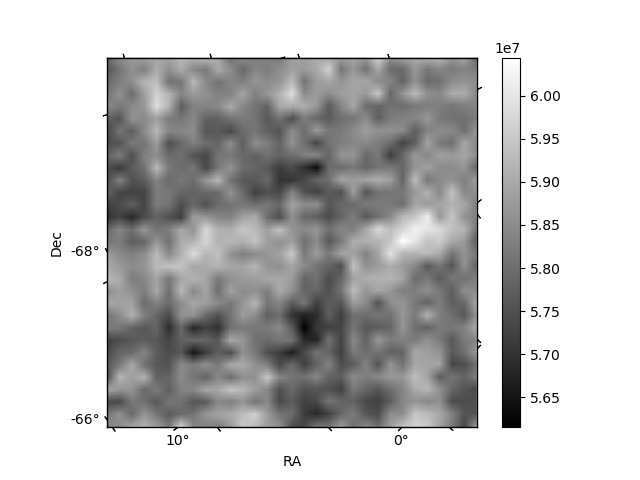
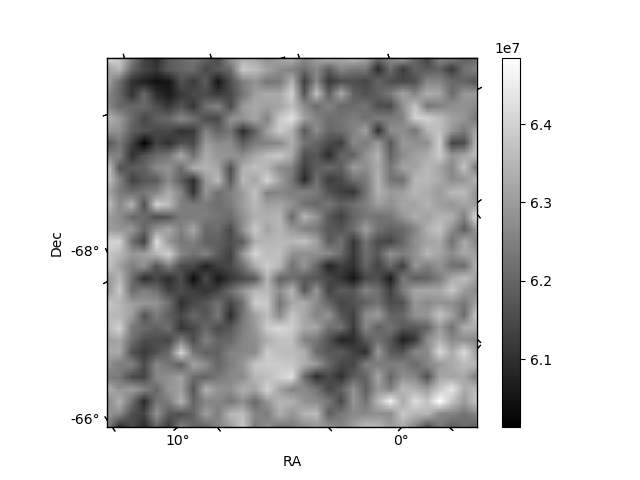
Histogram calculated using DETX and DETY for each event in the final _common_clean file
| Quadrant A | 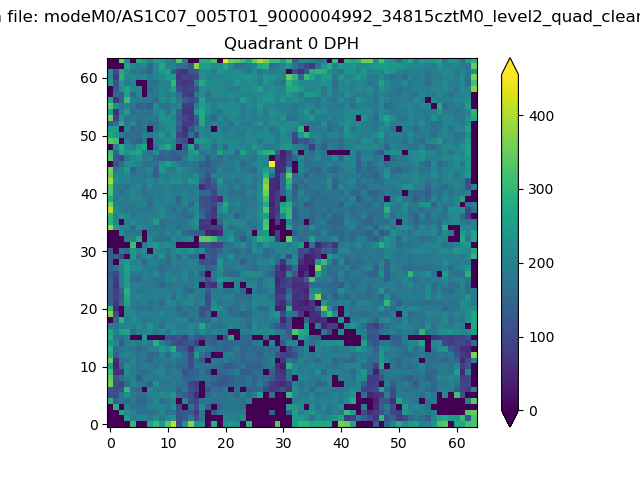 |
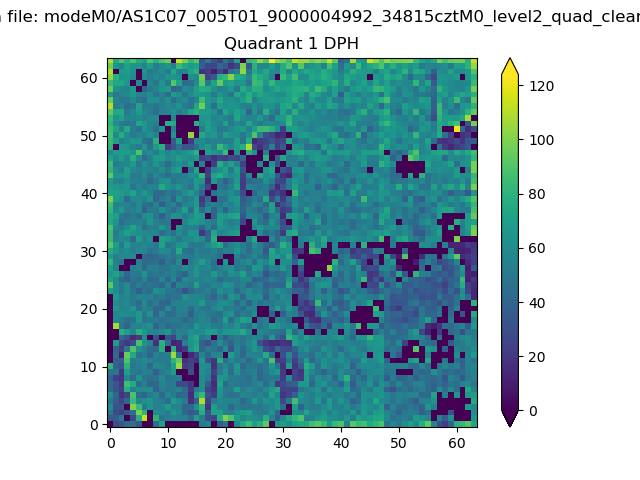 |
Quadrant B |
|---|---|---|---|
| Quadrant D | 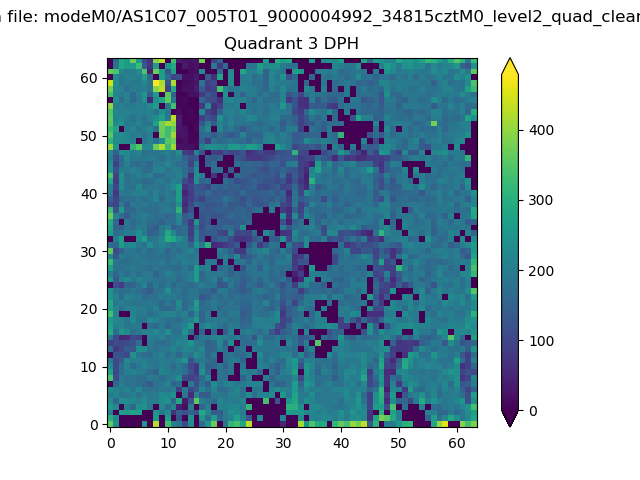 |
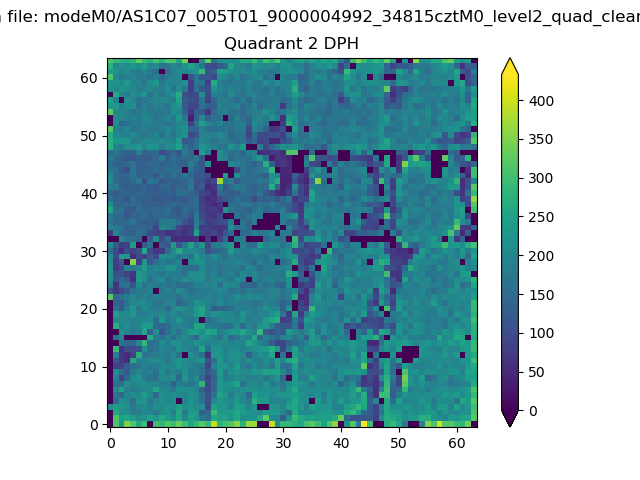 |
Quadrant C |
| Plot type | Count rate plots | Images |
|---|---|---|
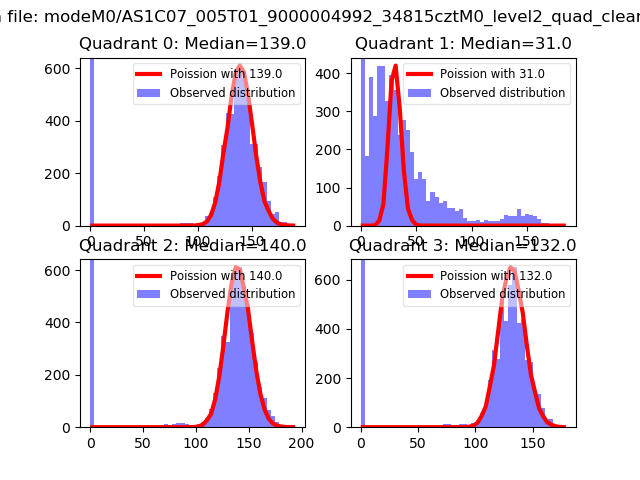
| Comparison with Poisson distribution Blue bars denote a histogram of data divided into 1 sec bins. Red curve is a Poisson curve with rate = median count rate of data. |
 |
 |
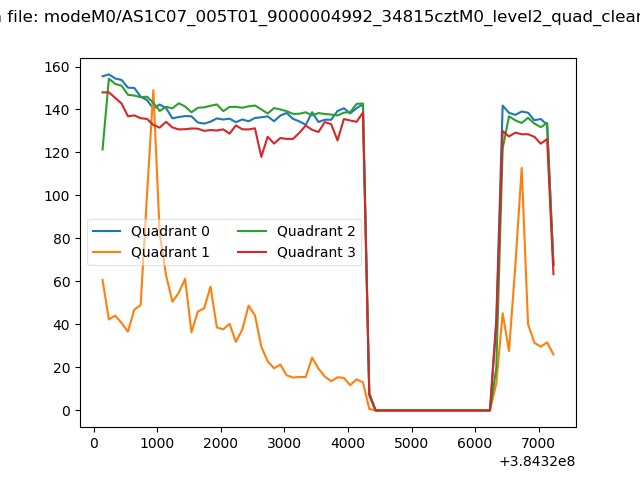
| Quadrant-wise count rates Data is divided into 100 sec bins |
 |
|
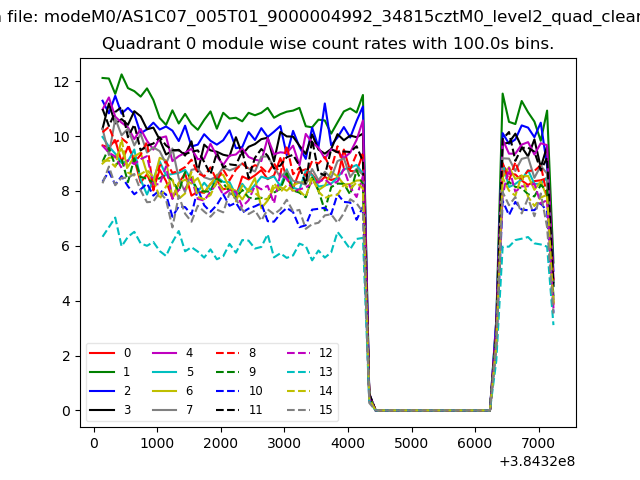
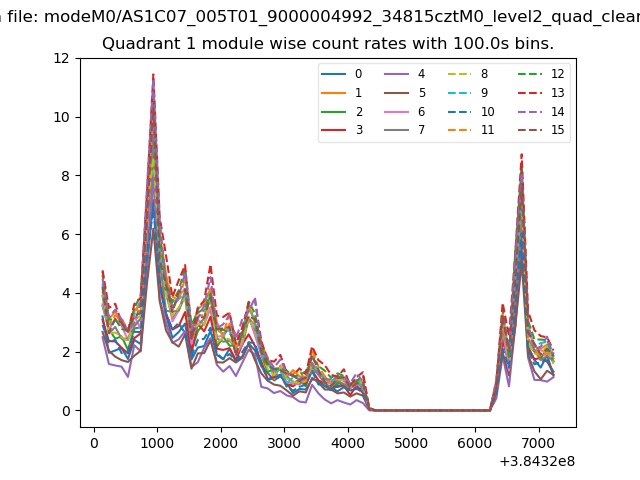
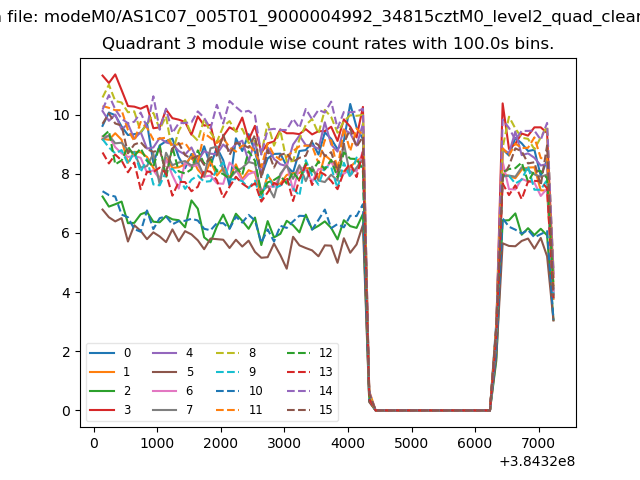
| Module-wise count rates for Quadrant A Data is divided into 100 sec bins |
 |
 |
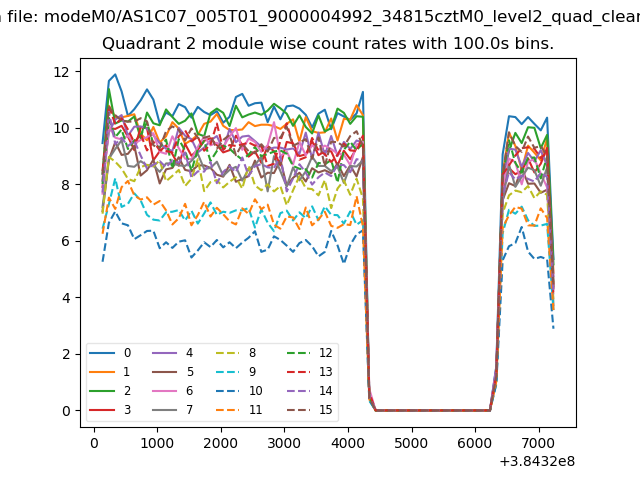
| Module-wise count rates for Quadrant B Data is divided into 100 sec bins |
 |
 |
| Module-wise count rates for Quadrant C Data is divided into 100 sec bins |
 |
 |
| Module-wise count rates for Quadrant D Data is divided into 100 sec bins |
 |
 |
| Parameter | Plot |
|---|---|
| CZT HV Monitor | 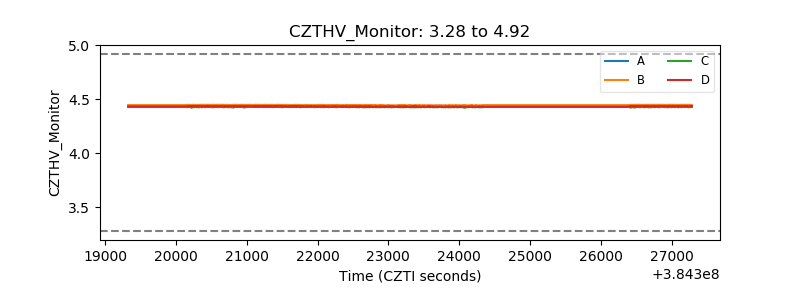 |
| D_VDD | 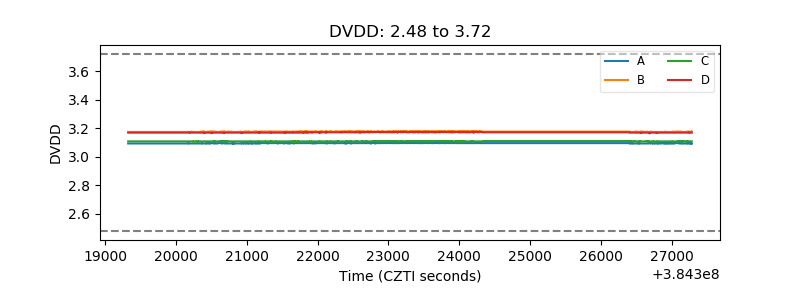 |
| Temperature 1 | 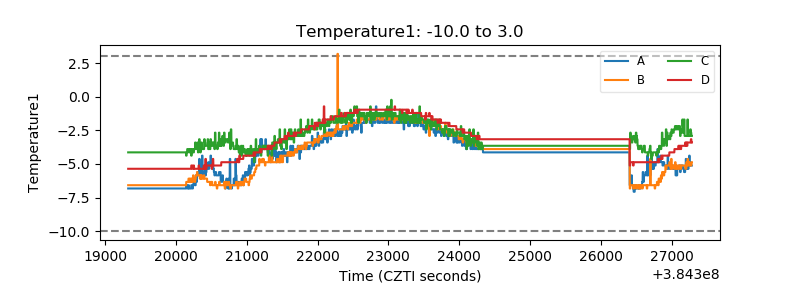 |
| Veto HV Monitor | 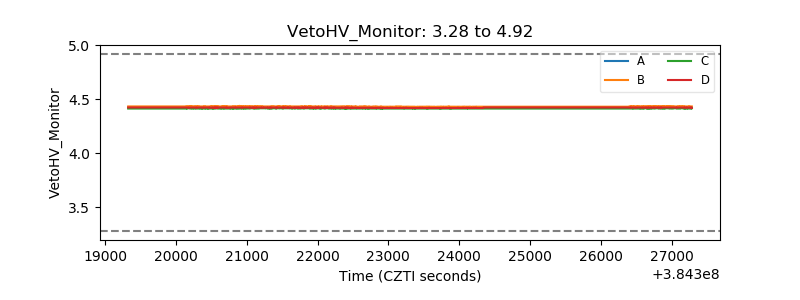 |
| Veto LLD | 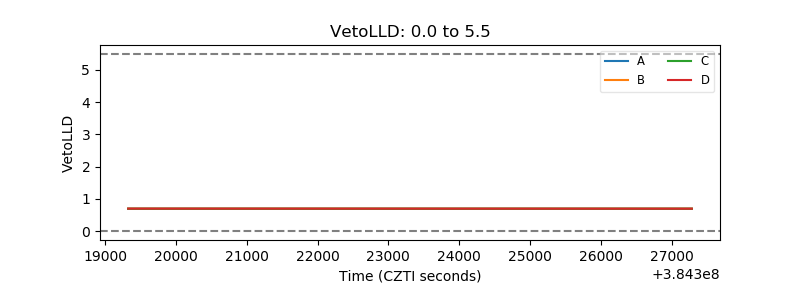 |
| Alpha Counter | 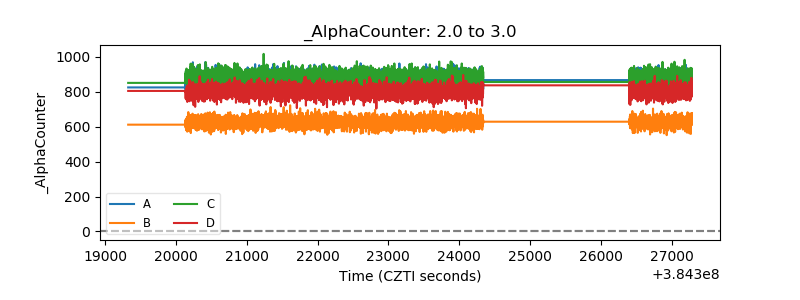 |
| _CPM_Rate | 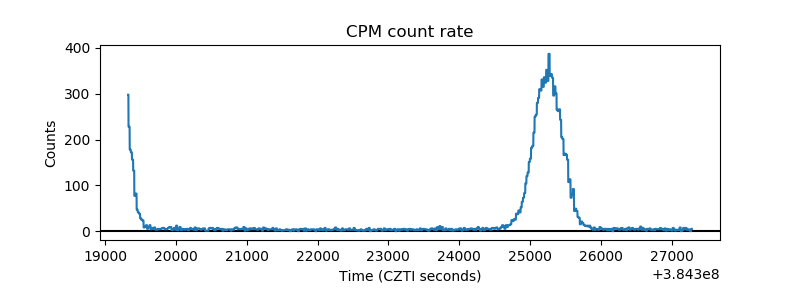 |
| CZT Counter | 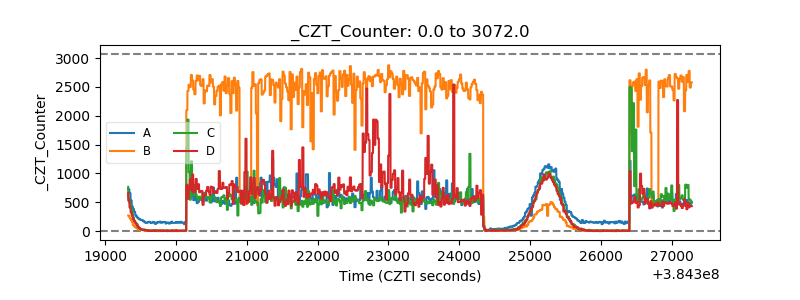 |
| +2.5 Volts monitor | 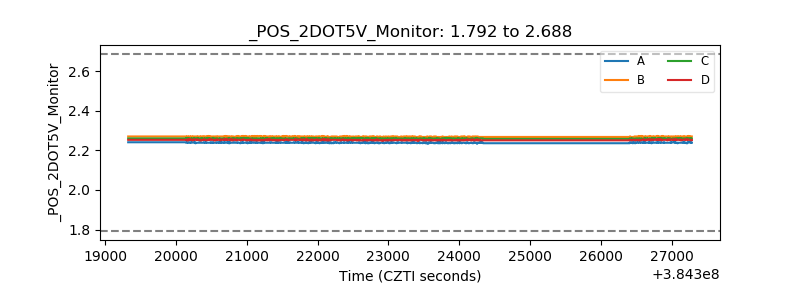 |
| +5 Volts monitor | 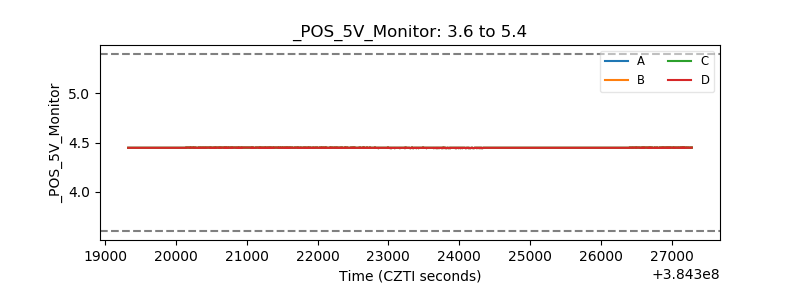 |
| _ROLL_ROT | 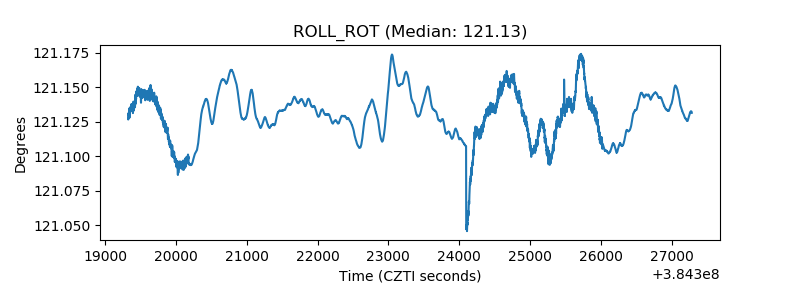 |
| _Roll_DEC | 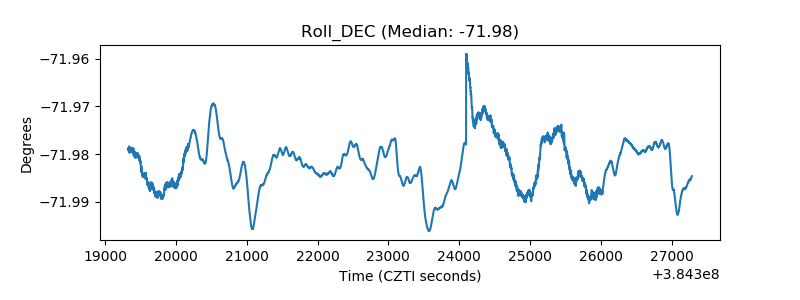 |
| _Roll_RA | 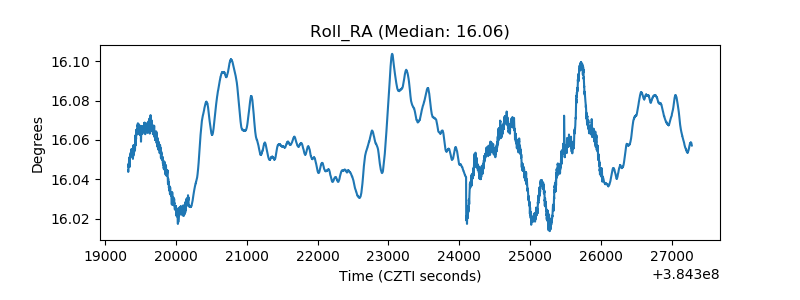 |
| Veto Counter |  |