| Param | Original file | Final file |
|---|---|---|
| Filename | modeM0/AS1C07_005T01_9000004992_34814cztM0_level2.evt | modeM0/AS1C07_005T01_9000004992_34814cztM0_level2_quad_clean.evt |
| Size (bytes) | 477,624,960 | 97,064,640 |
| Size | 455.5 MB | 92.6 MB |
| Events in quadrant A | 3,048,685 | 681,681 |
| Events in quadrant B | 4,673,786 | 584,663 |
| Events in quadrant C | 2,891,453 | 688,425 |
| Events in quadrant D | 3,522,273 | 644,337 |
| Mode M9 | |||
|---|---|---|---|
| Quadrant | BADHDUFLAG | Total packets | Discarded packets |
| A | 0 | 22 | 0 |
| B | 0 | 22 | 0 |
| C | 0 | 22 | 0 |
| D | 0 | 22 | 0 |
| Mode M0 | |||
|---|---|---|---|
| Quadrant | BADHDUFLAG | Total packets | Discarded packets |
| A | 0 | 12456 | 2 |
| B | 0 | 16780 | 1 |
| C | 0 | 11527 | 1 |
| D | 0 | 14173 | 1 |
| Mode SS | |||
|---|---|---|---|
| Quadrant | BADHDUFLAG | Total packets | Discarded packets |
| A | 0 | 96 | 0 |
| B | 0 | 96 | 0 |
| C | 0 | 96 | 0 |
| D | 0 | 96 | 0 |
| Quadrant | Total seconds | Saturated seconds | Saturation percentage |
|---|---|---|---|
| A | 4856 | 11 | 0.226524% |
| B | 4856 | 1073 | 22.096376% |
| C | 4856 | 49 | 1.009061% |
| D | 4856 | 42 | 0.864909% |
Noise dominated data is calculated using 1-second bins in cleaned event files. If a bin has >2000 counts, and if more than 50% of those come from <1% of pixels, then it is considered to be noise-dominated and hence unusable.
| Quadrant | # 1 sec bins | Bins with >0 counts | Bins with >2000 counts | High rate bins dominated by noise | Noise dominated (total time) | Noise dominated (detector-on time) | Marked lightcurve |
|---|---|---|---|---|---|---|---|
| A | 6978 | 4857 | 2 | 2 | 0.03% | 0.04% | 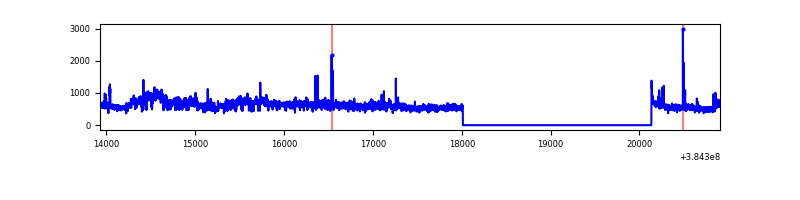 |
| B | 6978 | 4856 | 1025 | 1025 | 14.69% | 21.11% | 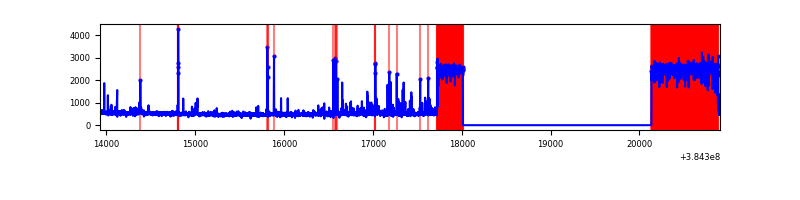 |
| C | 6978 | 4857 | 33 | 33 | 0.47% | 0.68% | 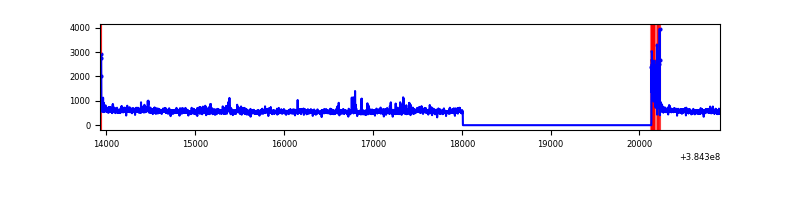 |
| D | 6978 | 4857 | 33 | 33 | 0.47% | 0.68% | 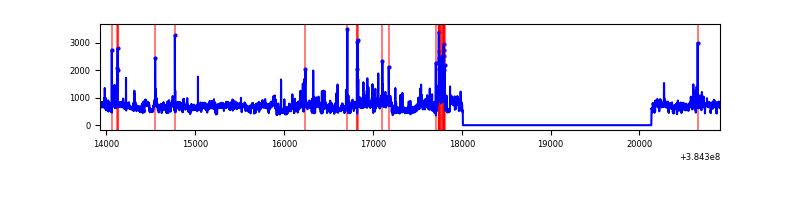 |
Top three noisy pixels from each quadrant. If the there are fewer than three noisy pixels in the level2.evt file, extra rows are filled as -1
| Pixel properties | Quadrant properties | ||||||
|---|---|---|---|---|---|---|---|
| Quadrant | DetID | PixID | Counts | Sigma | Mean | Median | Sigma |
| A | 0 | 247 | 463786 | 3836.34 | 608 | 599 | 120.7 |
| A | 15 | 169 | 136340 | 1124.27 | 608 | 599 | 120.7 |
| A | 10 | 83 | 37291 | 303.9 | 608 | 599 | 120.7 |
| B | 4 | 251 | 2417746 | 25136.66 | 517 | 504 | 96.2 |
| B | 5 | 172 | 100419 | 1039.01 | 517 | 504 | 96.2 |
| B | 15 | 222 | 52731 | 543.1 | 517 | 504 | 96.2 |
| C | 15 | 214 | 223082 | 1641.16 | 601 | 605 | 135.6 |
| C | 14 | 67 | 155599 | 1143.35 | 601 | 605 | 135.6 |
| C | 0 | 10 | 141771 | 1041.35 | 601 | 605 | 135.6 |
| D | 8 | 195 | 845352 | 5888.6 | 599 | 583 | 143.5 |
| D | 2 | 249 | 121408 | 842.23 | 599 | 583 | 143.5 |
| D | 12 | 227 | 88518 | 612.97 | 599 | 583 | 143.5 |
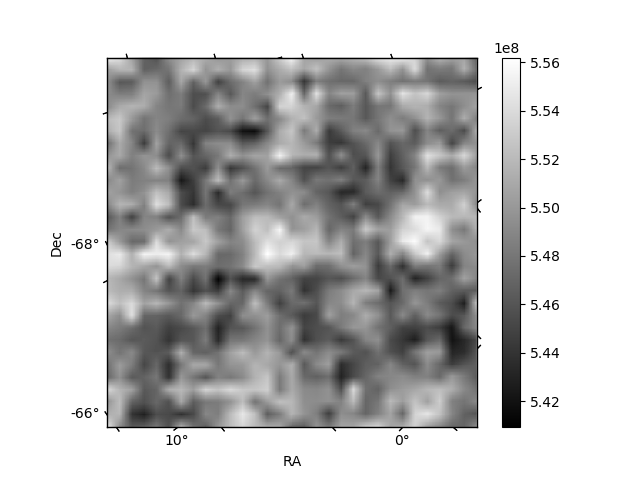
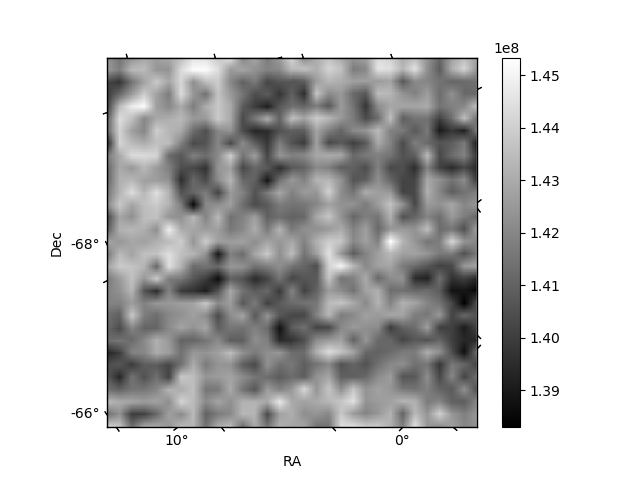
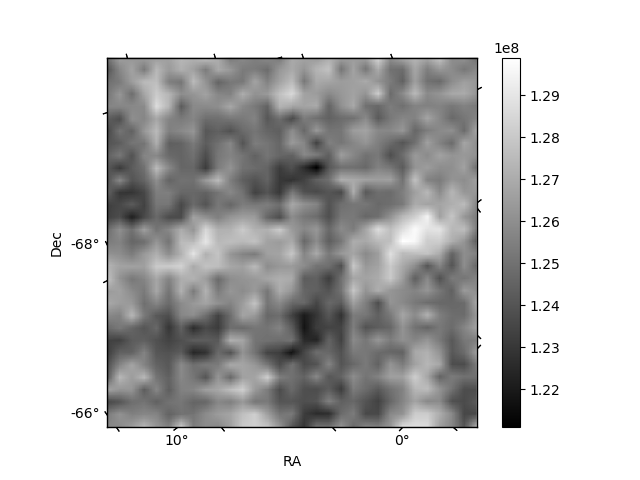
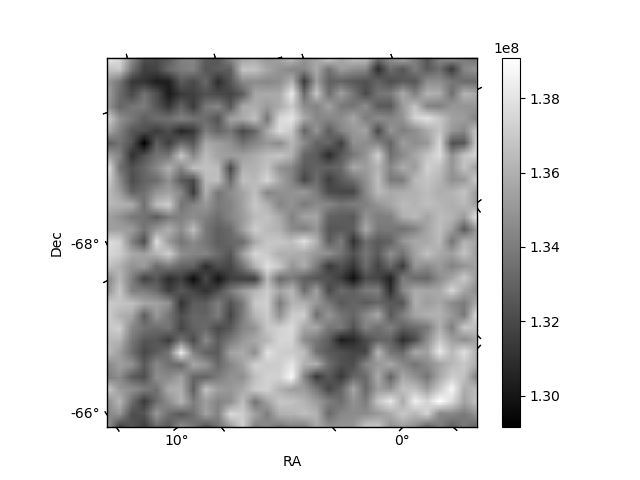
Histogram calculated using DETX and DETY for each event in the final _common_clean file
| Quadrant A | 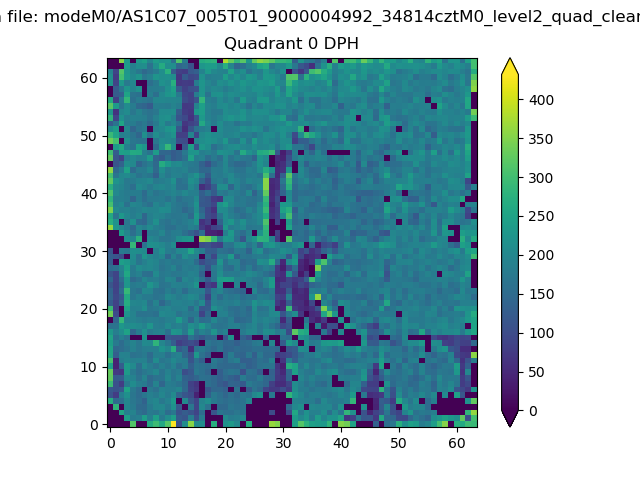 |
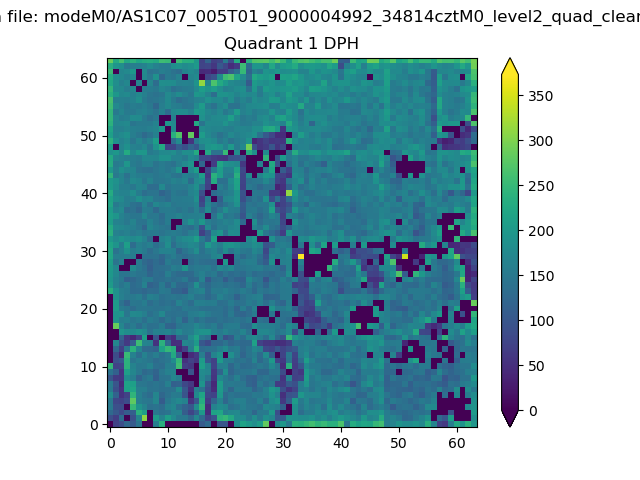 |
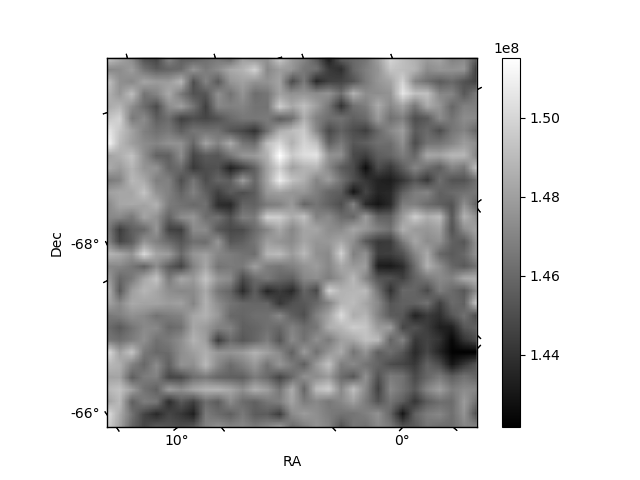
Quadrant B |
|---|---|---|---|
| Quadrant D | 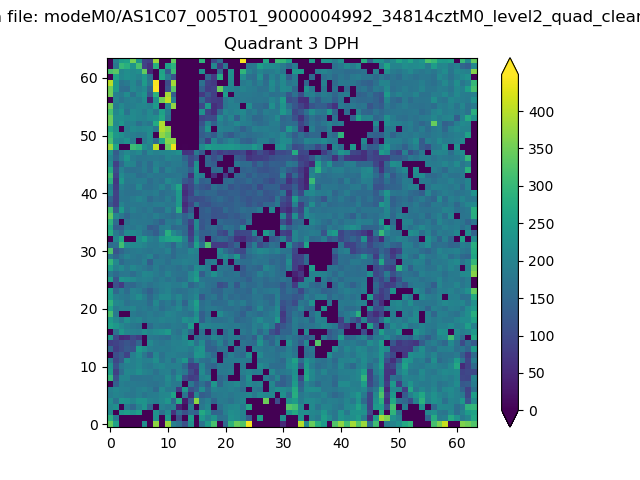 |
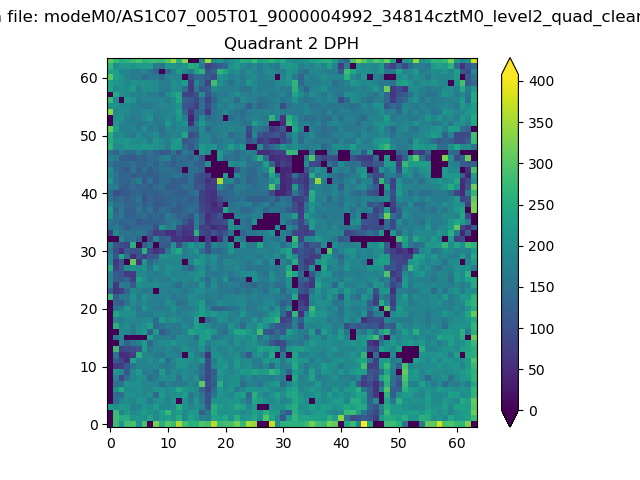 |
Quadrant C |
| Plot type | Count rate plots | Images |
|---|---|---|
| Comparison with Poisson distribution Blue bars denote a histogram of data divided into 1 sec bins. Red curve is a Poisson curve with rate = median count rate of data. |
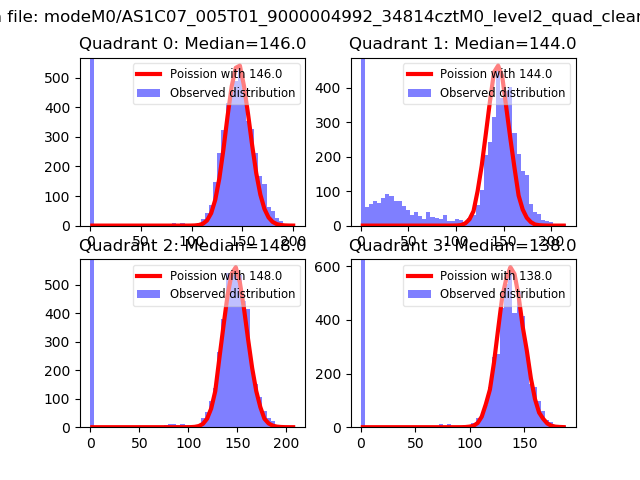 |
 |
| Quadrant-wise count rates Data is divided into 100 sec bins |
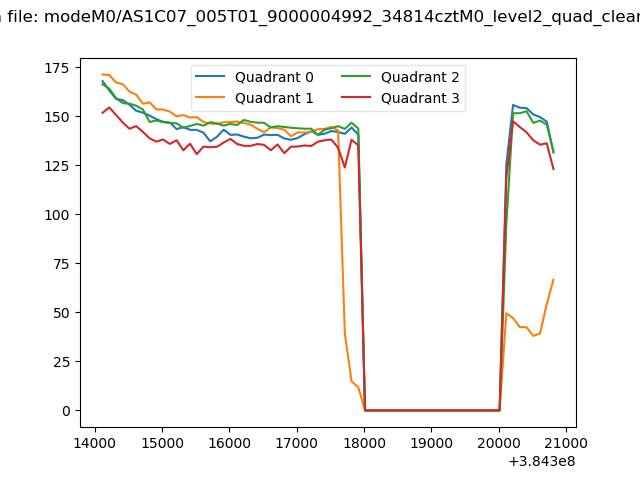 |
|
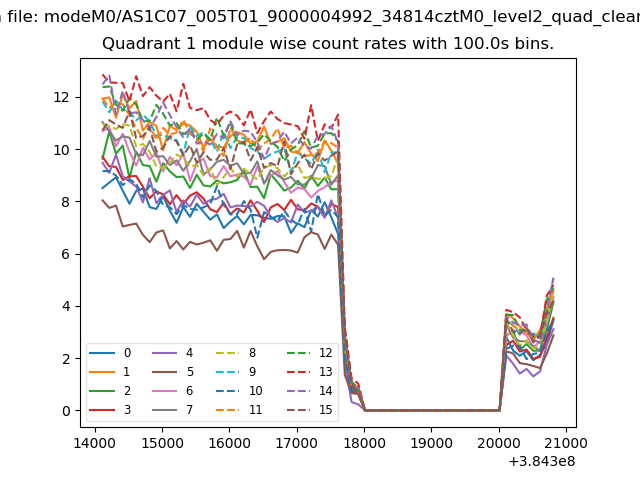
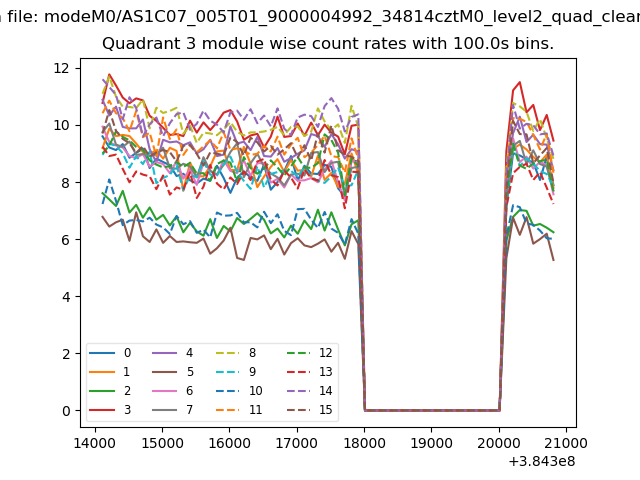
| Module-wise count rates for Quadrant A Data is divided into 100 sec bins |
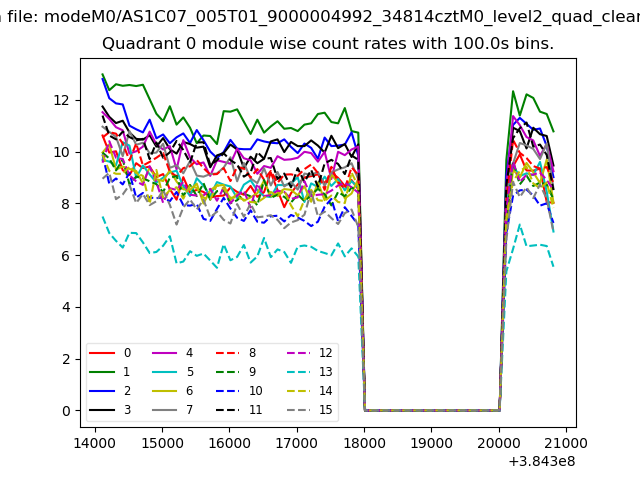 |
 |
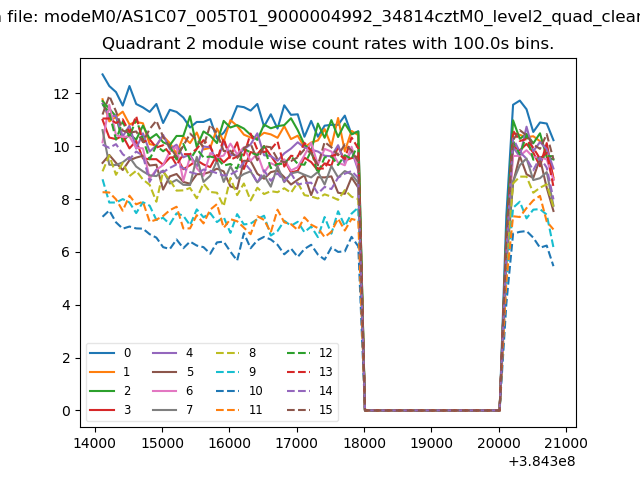
| Module-wise count rates for Quadrant B Data is divided into 100 sec bins |
 |
 |
| Module-wise count rates for Quadrant C Data is divided into 100 sec bins |
 |
 |
| Module-wise count rates for Quadrant D Data is divided into 100 sec bins |
 |
 |
| Parameter | Plot |
|---|---|
| CZT HV Monitor | 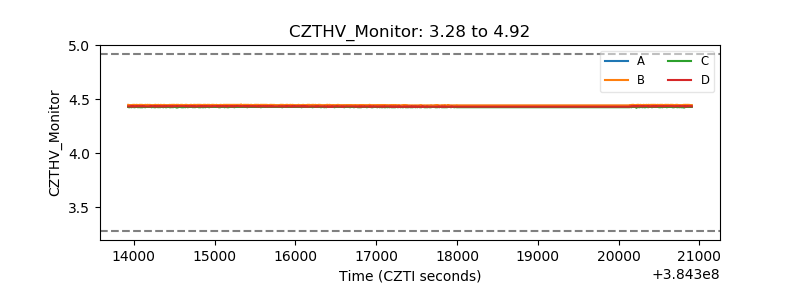 |
| D_VDD | 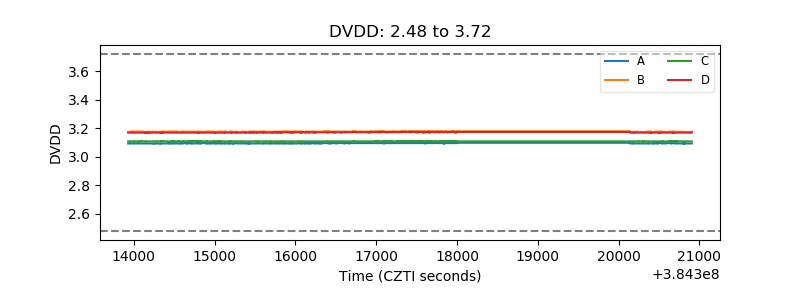 |
| Temperature 1 | 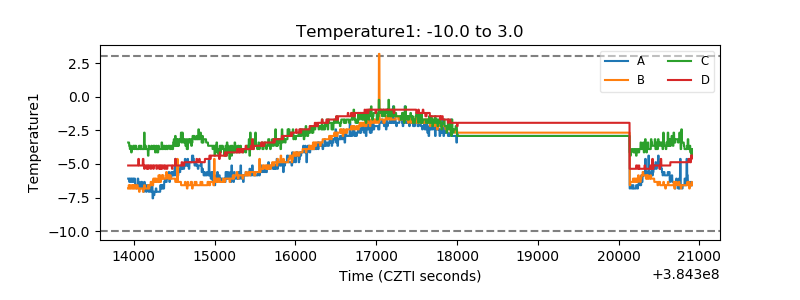 |
| Veto HV Monitor | 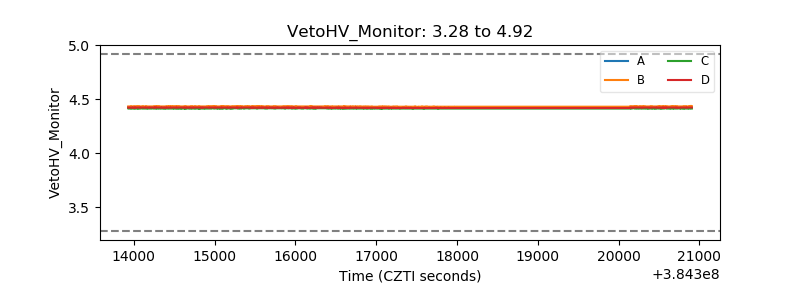 |
| Veto LLD | 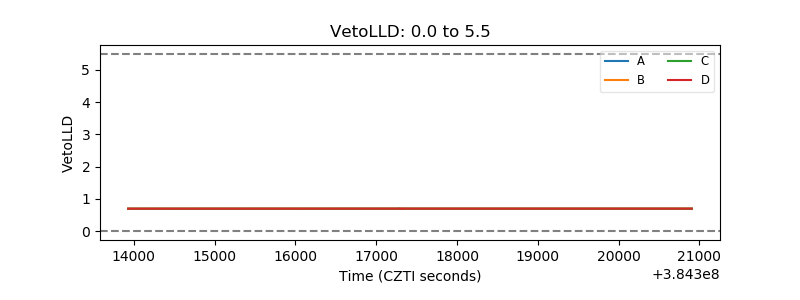 |
| Alpha Counter | 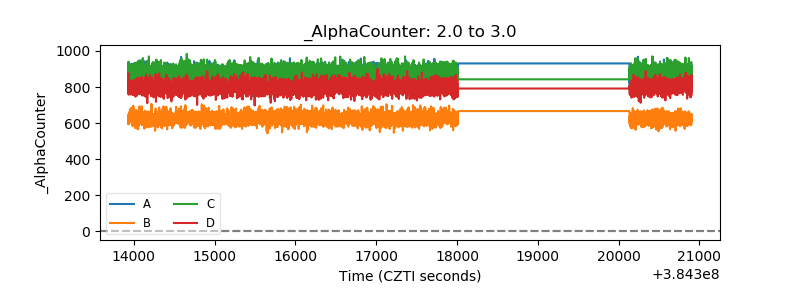 |
| _CPM_Rate | 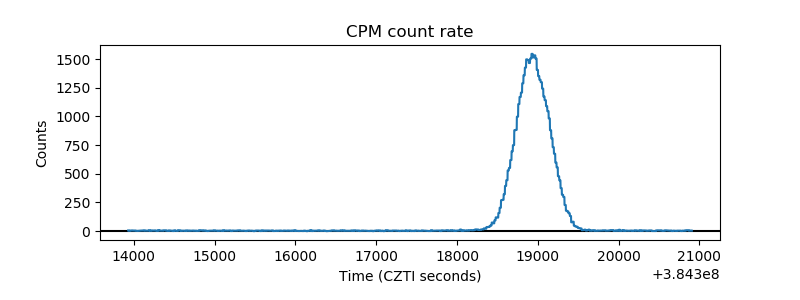 |
| CZT Counter | 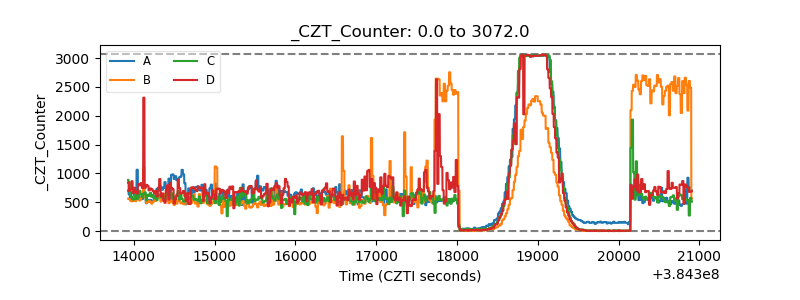 |
| +2.5 Volts monitor | 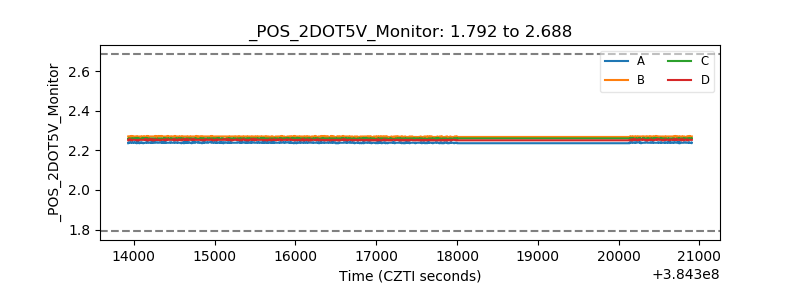 |
| +5 Volts monitor | 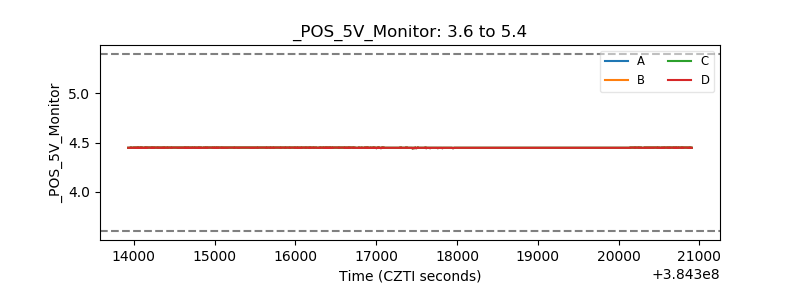 |
| _ROLL_ROT | 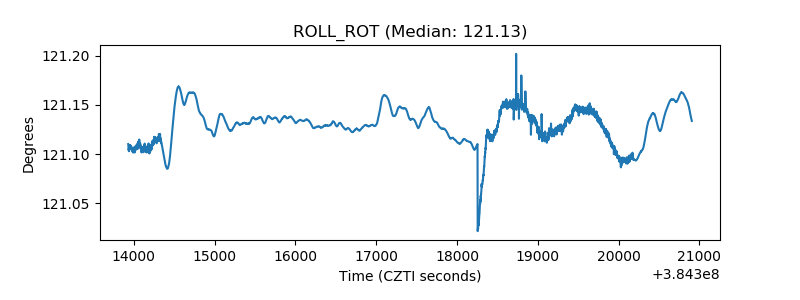 |
| _Roll_DEC | 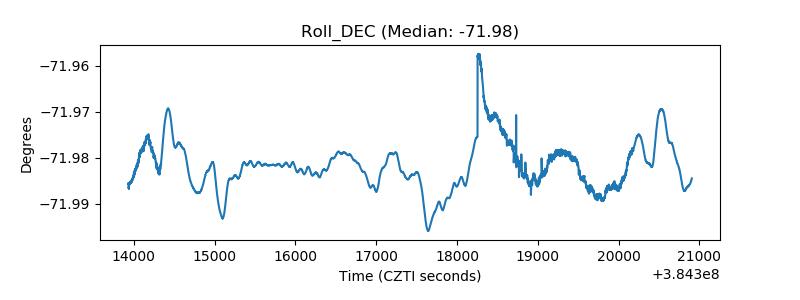 |
| _Roll_RA | 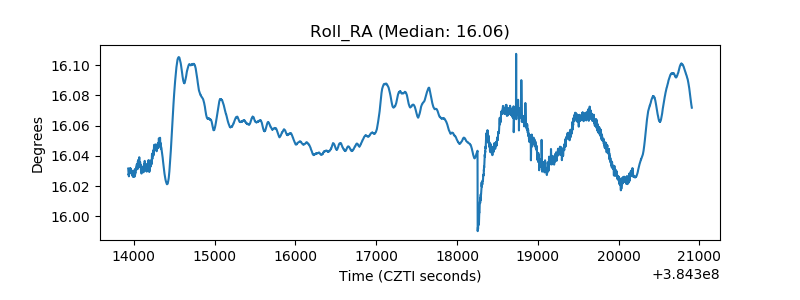 |
| Veto Counter | 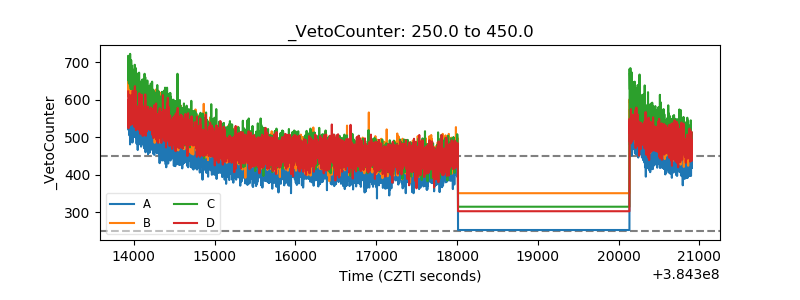 |