| Param | Original file | Final file |
|---|---|---|
| Filename | modeM0/AS1C07_005T01_9000004992_34812cztM0_level2.evt | modeM0/AS1C07_005T01_9000004992_34812cztM0_level2_quad_clean.evt |
| Size (bytes) | 397,653,120 | 98,861,760 |
| Size | 379.2 MB | 94.3 MB |
| Events in quadrant A | 2,734,593 | 672,458 |
| Events in quadrant B | 2,725,404 | 691,120 |
| Events in quadrant C | 2,837,291 | 661,322 |
| Events in quadrant D | 3,407,820 | 620,435 |
| Mode M9 | |||
|---|---|---|---|
| Quadrant | BADHDUFLAG | Total packets | Discarded packets |
| A | 0 | 37 | 0 |
| B | 0 | 37 | 0 |
| C | 0 | 37 | 0 |
| D | 0 | 38 | 0 |
| Mode M0 | |||
|---|---|---|---|
| Quadrant | BADHDUFLAG | Total packets | Discarded packets |
| A | 0 | 11150 | 2 |
| B | 0 | 11036 | 1 |
| C | 0 | 11125 | 1 |
| D | 0 | 13573 | 1 |
| Mode SS | |||
|---|---|---|---|
| Quadrant | BADHDUFLAG | Total packets | Discarded packets |
| A | 0 | 100 | 0 |
| B | 0 | 100 | 0 |
| C | 0 | 100 | 0 |
| D | 0 | 100 | 0 |
| Quadrant | Total seconds | Saturated seconds | Saturation percentage |
|---|---|---|---|
| A | 4977 | 15 | 0.301386% |
| B | 4977 | 41 | 0.823789% |
| C | 4977 | 76 | 1.527024% |
| D | 4977 | 144 | 2.893309% |
Noise dominated data is calculated using 1-second bins in cleaned event files. If a bin has >2000 counts, and if more than 50% of those come from <1% of pixels, then it is considered to be noise-dominated and hence unusable.
| Quadrant | # 1 sec bins | Bins with >0 counts | Bins with >2000 counts | High rate bins dominated by noise | Noise dominated (total time) | Noise dominated (detector-on time) | Marked lightcurve |
|---|---|---|---|---|---|---|---|
| A | 6979 | 4978 | 6 | 6 | 0.09% | 0.12% | 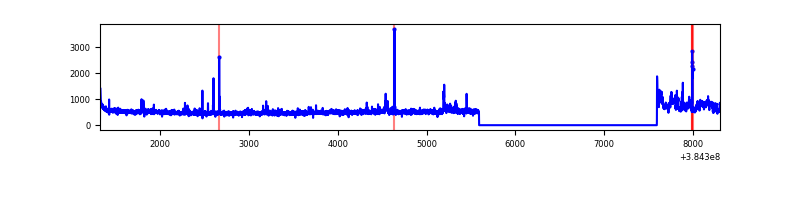 |
| B | 6979 | 4978 | 21 | 21 | 0.30% | 0.42% | 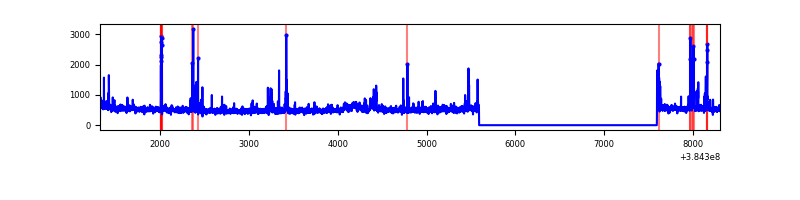 |
| C | 6979 | 4978 | 51 | 51 | 0.73% | 1.02% | 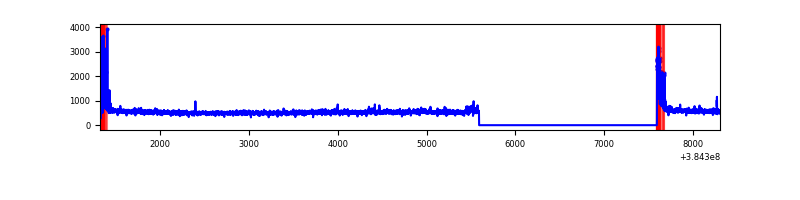 |
| D | 6979 | 4978 | 115 | 115 | 1.65% | 2.31% | 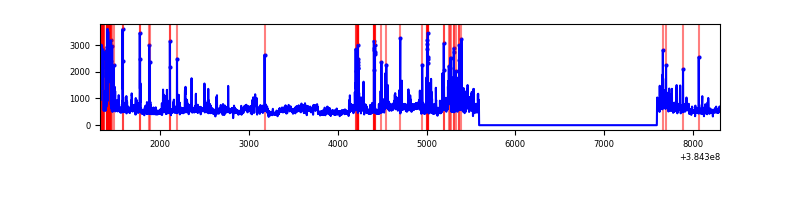 |
Top three noisy pixels from each quadrant. If the there are fewer than three noisy pixels in the level2.evt file, extra rows are filled as -1
| Pixel properties | Quadrant properties | ||||||
|---|---|---|---|---|---|---|---|
| Quadrant | DetID | PixID | Counts | Sigma | Mean | Median | Sigma |
| A | 0 | 247 | 160844 | 1302.82 | 620 | 611 | 123.0 |
| A | 15 | 169 | 53002 | 425.98 | 620 | 611 | 123.0 |
| A | 10 | 83 | 48876 | 392.43 | 620 | 611 | 123.0 |
| B | 5 | 172 | 189463 | 1662.32 | 621 | 608 | 113.6 |
| B | 4 | 232 | 42760 | 371.03 | 621 | 608 | 113.6 |
| B | 5 | 255 | 20899 | 178.6 | 621 | 608 | 113.6 |
| C | 15 | 214 | 225576 | 1631.1 | 604 | 611 | 137.9 |
| C | 0 | 10 | 204360 | 1477.27 | 604 | 611 | 137.9 |
| C | 14 | 67 | 43064 | 307.8 | 604 | 611 | 137.9 |
| D | 8 | 195 | 536973 | 3596.41 | 593 | 580 | 149.1 |
| D | 2 | 249 | 212764 | 1422.65 | 593 | 580 | 149.1 |
| D | 13 | 249 | 105083 | 700.67 | 593 | 580 | 149.1 |
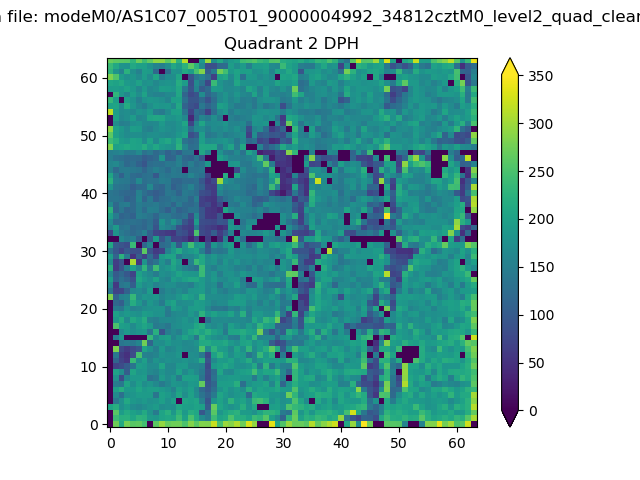
Histogram calculated using DETX and DETY for each event in the final _common_clean file
| Quadrant A | 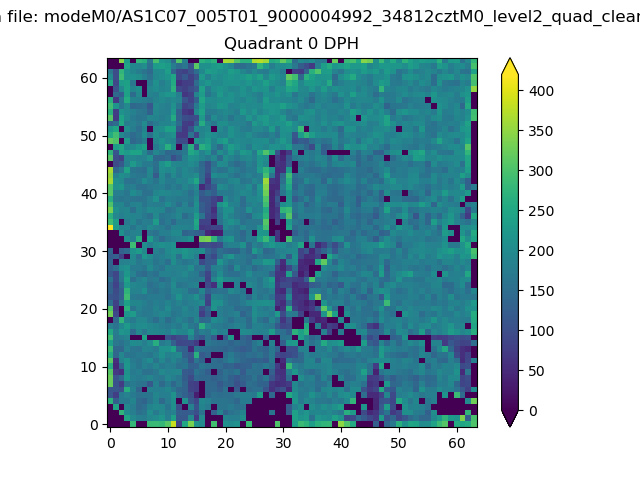 |
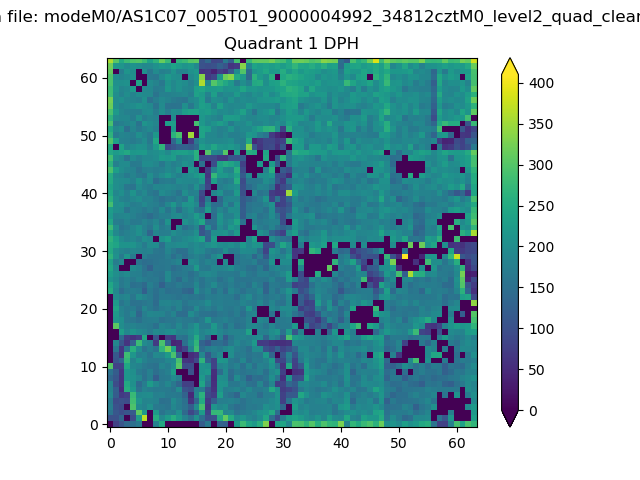 |
Quadrant B |
|---|---|---|---|
| Quadrant D | 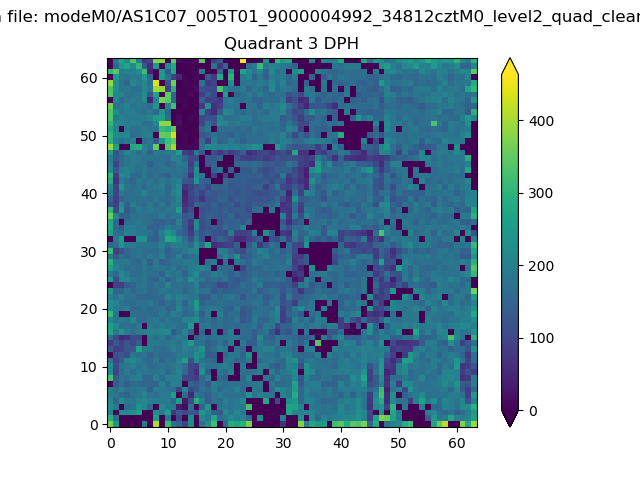 |
 |
Quadrant C |
| Plot type | Count rate plots | Images |
|---|---|---|
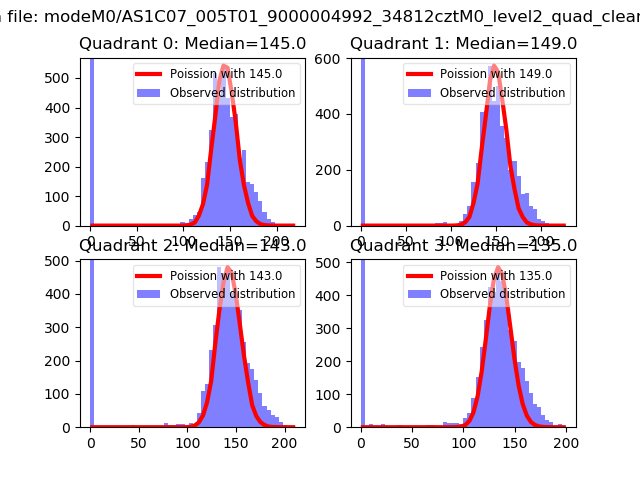
| Comparison with Poisson distribution Blue bars denote a histogram of data divided into 1 sec bins. Red curve is a Poisson curve with rate = median count rate of data. |
 |
 |
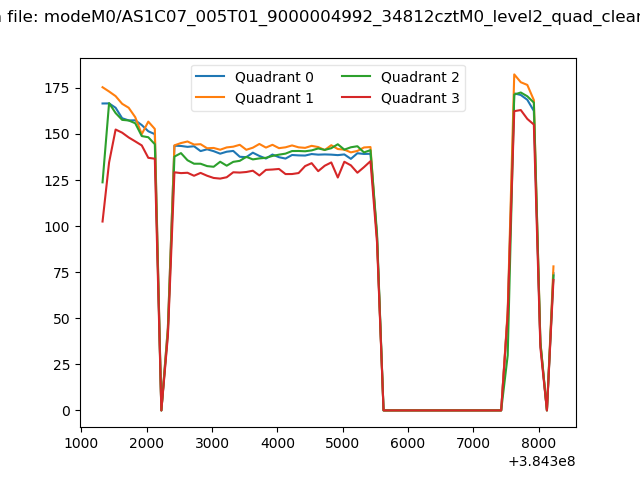
| Quadrant-wise count rates Data is divided into 100 sec bins |
 |
|
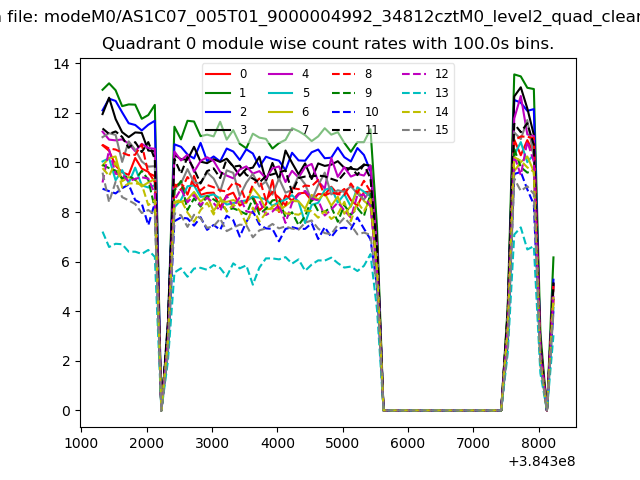
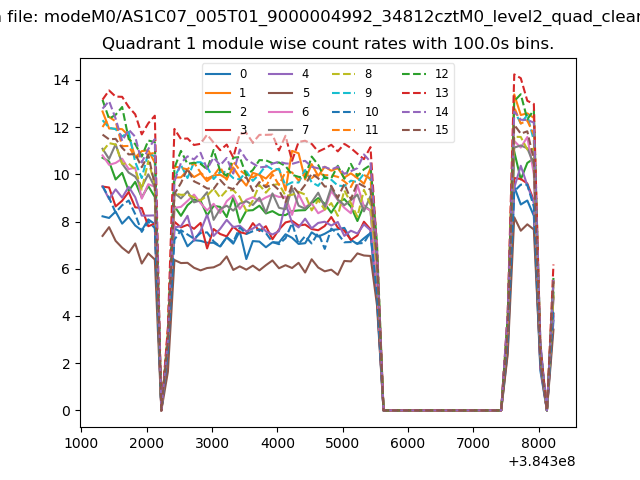
| Module-wise count rates for Quadrant A Data is divided into 100 sec bins |
 |
 |
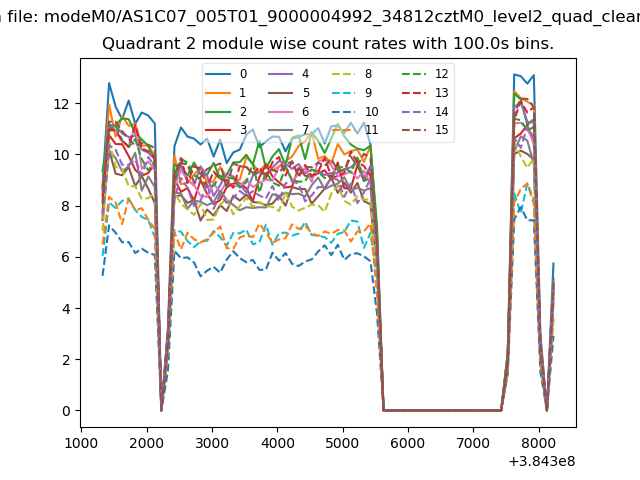
| Module-wise count rates for Quadrant B Data is divided into 100 sec bins |
 |
 |
| Module-wise count rates for Quadrant C Data is divided into 100 sec bins |
 |
 |
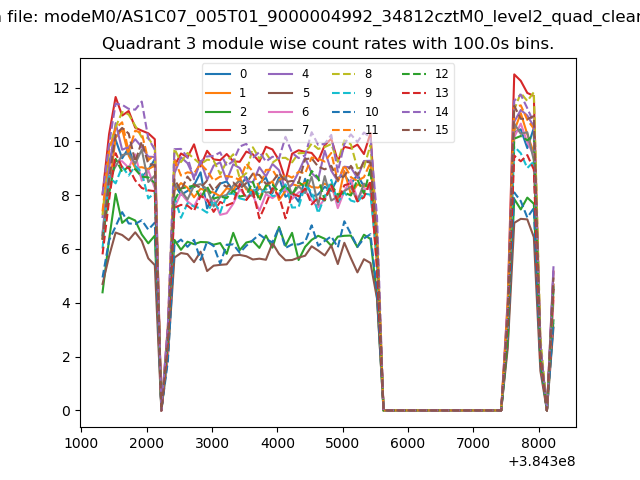
| Module-wise count rates for Quadrant D Data is divided into 100 sec bins |
 |
 |
| Parameter | Plot |
|---|---|
| CZT HV Monitor | 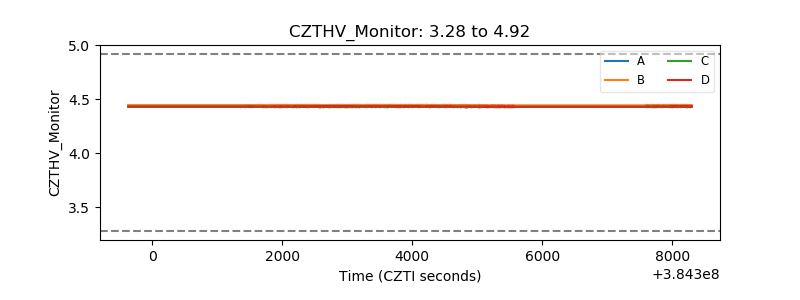 |
| D_VDD | 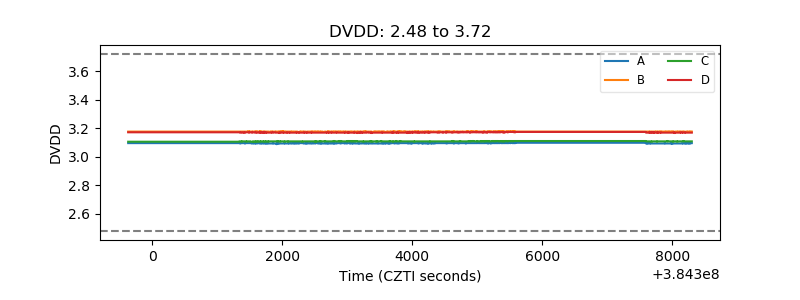 |
| Temperature 1 | 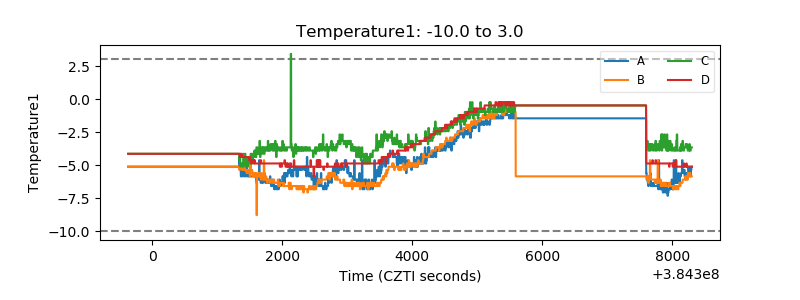 |
| Veto HV Monitor | 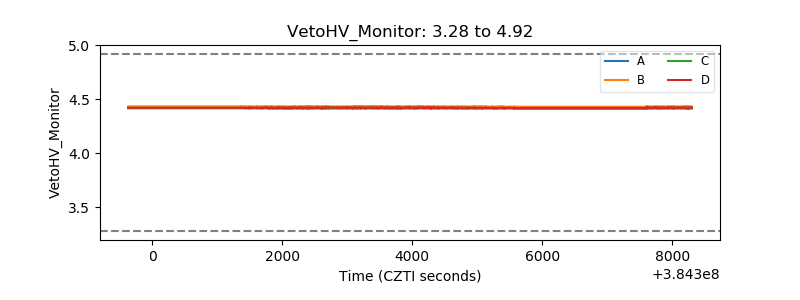 |
| Veto LLD | 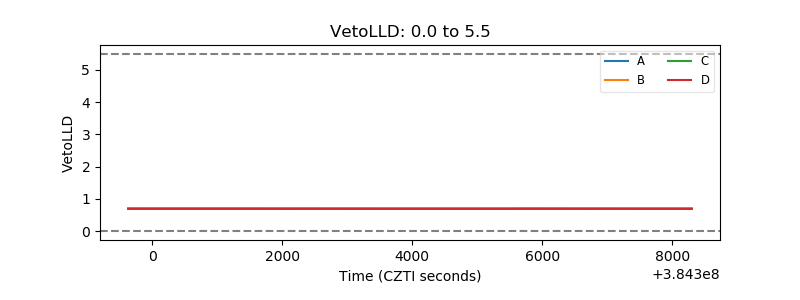 |
| Alpha Counter | 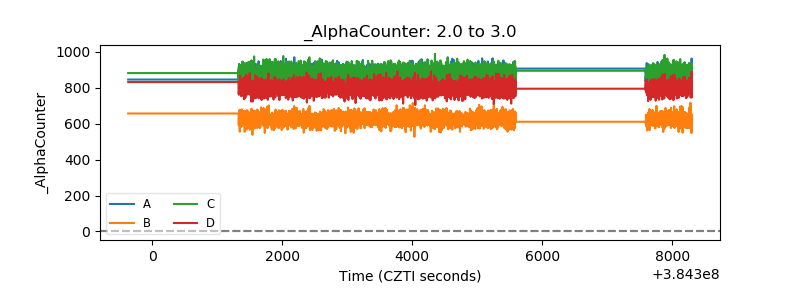 |
| _CPM_Rate | 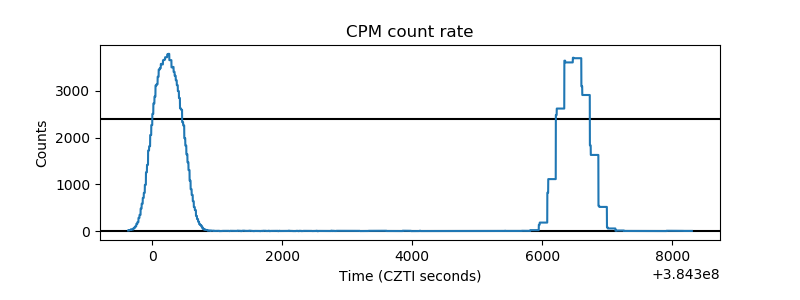 |
| CZT Counter | 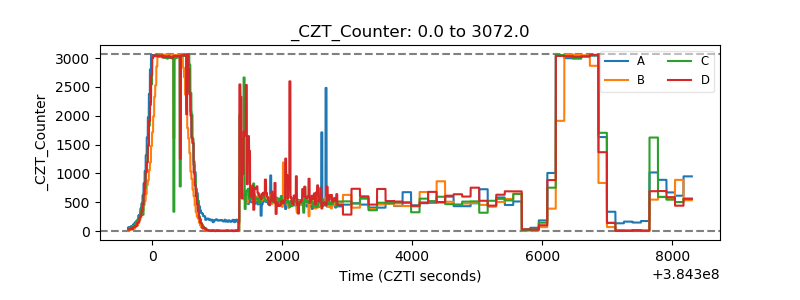 |
| +2.5 Volts monitor | 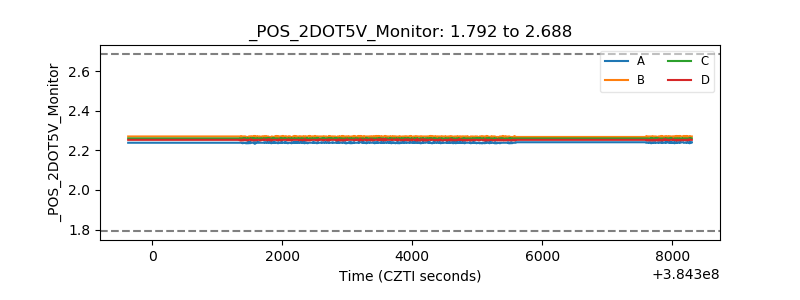 |
| +5 Volts monitor | 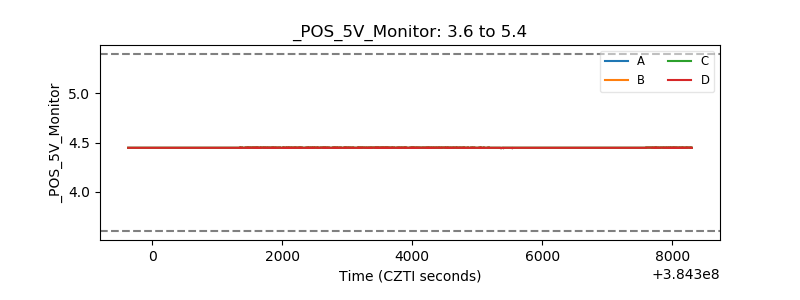 |
| _ROLL_ROT | 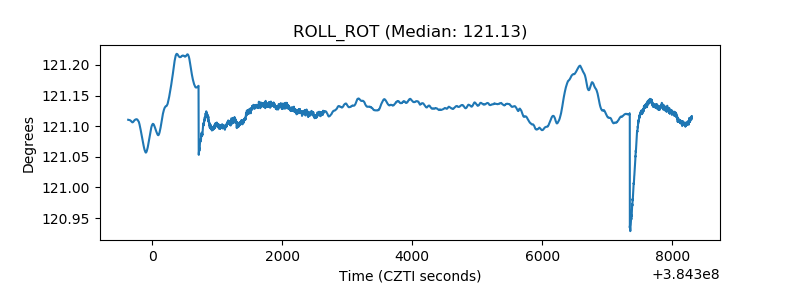 |
| _Roll_DEC | 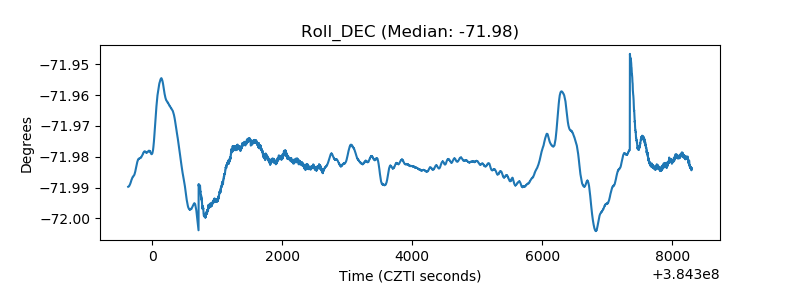 |
| _Roll_RA | 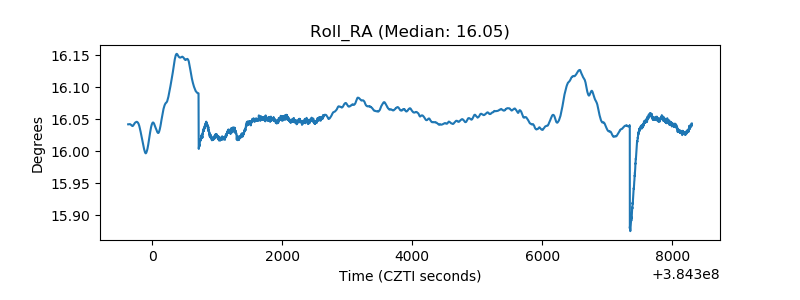 |
| Veto Counter | 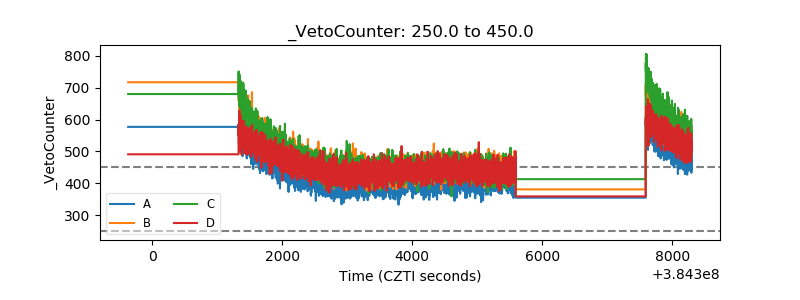 |