| Param | Original file | Final file |
|---|---|---|
| Filename | modeM0/AS1C07_005T01_9000004992_34811cztM0_level2.evt | modeM0/AS1C07_005T01_9000004992_34811cztM0_level2_quad_clean.evt |
| Size (bytes) | 415,635,840 | 104,290,560 |
| Size | 396.4 MB | 99.5 MB |
| Events in quadrant A | 2,584,369 | 715,632 |
| Events in quadrant B | 2,916,167 | 724,035 |
| Events in quadrant C | 2,794,559 | 699,299 |
| Events in quadrant D | 3,936,036 | 652,215 |
| Mode M9 | |||
|---|---|---|---|
| Quadrant | BADHDUFLAG | Total packets | Discarded packets |
| A | 0 | 34 | 0 |
| B | 0 | 34 | 0 |
| C | 0 | 34 | 0 |
| D | 0 | 35 | 0 |
| Mode M0 | |||
|---|---|---|---|
| Quadrant | BADHDUFLAG | Total packets | Discarded packets |
| A | 0 | 10998 | 2 |
| B | 0 | 11923 | 1 |
| C | 0 | 11196 | 1 |
| D | 0 | 15579 | 1 |
| Mode SS | |||
|---|---|---|---|
| Quadrant | BADHDUFLAG | Total packets | Discarded packets |
| A | 0 | 106 | 0 |
| B | 0 | 106 | 0 |
| C | 0 | 106 | 0 |
| D | 0 | 106 | 0 |
| Quadrant | Total seconds | Saturated seconds | Saturation percentage |
|---|---|---|---|
| A | 5249 | 25 | 0.476281% |
| B | 5249 | 96 | 1.828920% |
| C | 5249 | 55 | 1.047819% |
| D | 5249 | 205 | 3.905506% |
Noise dominated data is calculated using 1-second bins in cleaned event files. If a bin has >2000 counts, and if more than 50% of those come from <1% of pixels, then it is considered to be noise-dominated and hence unusable.
| Quadrant | # 1 sec bins | Bins with >0 counts | Bins with >2000 counts | High rate bins dominated by noise | Noise dominated (total time) | Noise dominated (detector-on time) | Marked lightcurve |
|---|---|---|---|---|---|---|---|
| A | 7132 | 5250 | 17 | 17 | 0.24% | 0.32% | 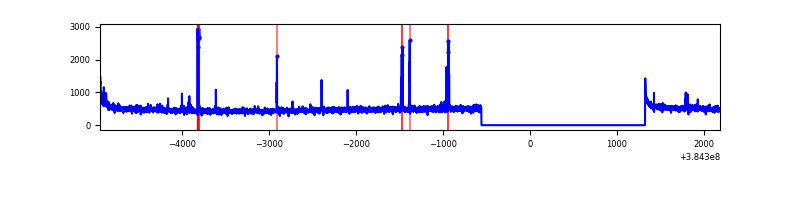 |
| B | 7132 | 5250 | 70 | 70 | 0.98% | 1.33% | 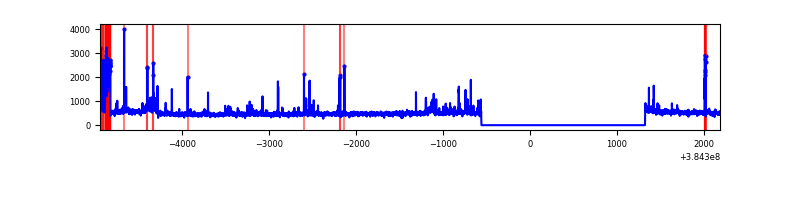 |
| C | 7132 | 5250 | 30 | 30 | 0.42% | 0.57% | 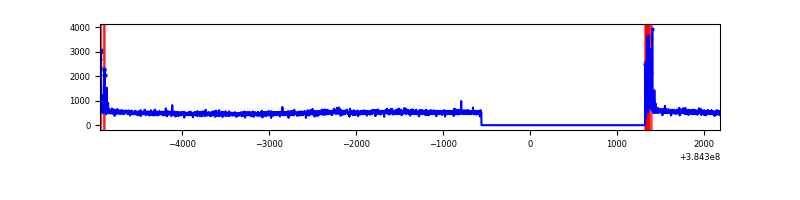 |
| D | 7132 | 5250 | 174 | 174 | 2.44% | 3.31% | 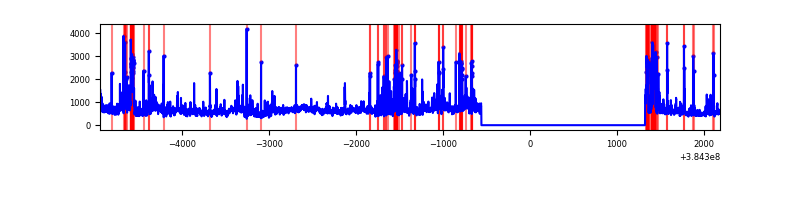 |
Top three noisy pixels from each quadrant. If the there are fewer than three noisy pixels in the level2.evt file, extra rows are filled as -1
| Pixel properties | Quadrant properties | ||||||
|---|---|---|---|---|---|---|---|
| Quadrant | DetID | PixID | Counts | Sigma | Mean | Median | Sigma |
| A | 15 | 174 | 60900 | 484.43 | 627 | 615 | 124.4 |
| A | 10 | 83 | 50748 | 402.85 | 627 | 615 | 124.4 |
| A | 7 | 16 | 21803 | 170.26 | 627 | 615 | 124.4 |
| B | 5 | 172 | 249568 | 2126.05 | 626 | 612 | 117.1 |
| B | 5 | 63 | 66925 | 566.3 | 626 | 612 | 117.1 |
| B | 0 | 190 | 26746 | 223.18 | 626 | 612 | 117.1 |
| C | 15 | 214 | 237791 | 1705.93 | 609 | 615 | 139.0 |
| C | 0 | 10 | 145894 | 1044.94 | 609 | 615 | 139.0 |
| C | 14 | 67 | 19894 | 138.67 | 609 | 615 | 139.0 |
| D | 8 | 195 | 792110 | 4993.05 | 590 | 579 | 158.5 |
| D | 2 | 249 | 359053 | 2261.29 | 590 | 579 | 158.5 |
| D | 13 | 249 | 226933 | 1427.86 | 590 | 579 | 158.5 |
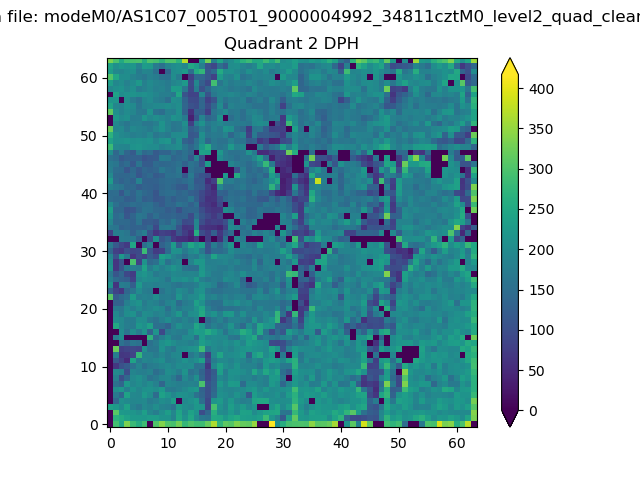
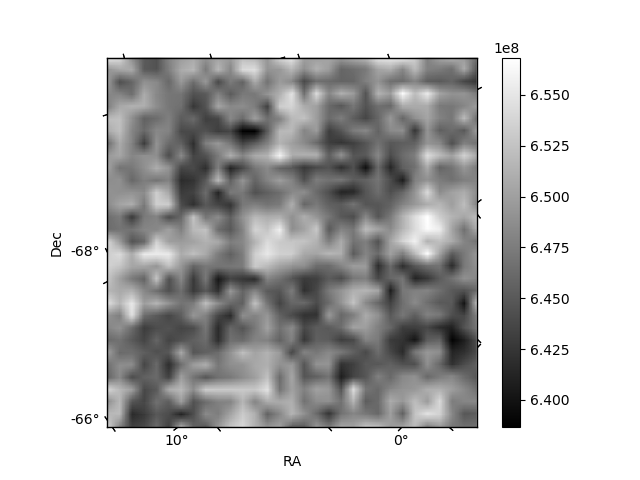
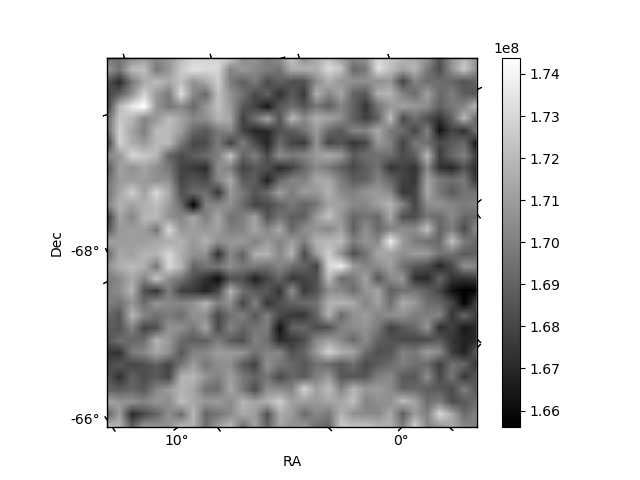
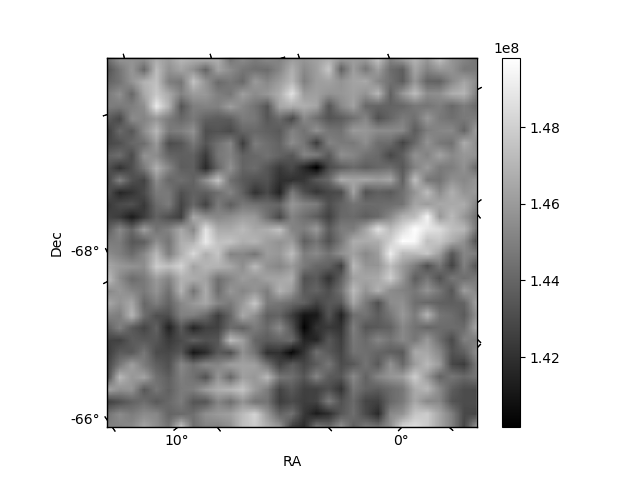
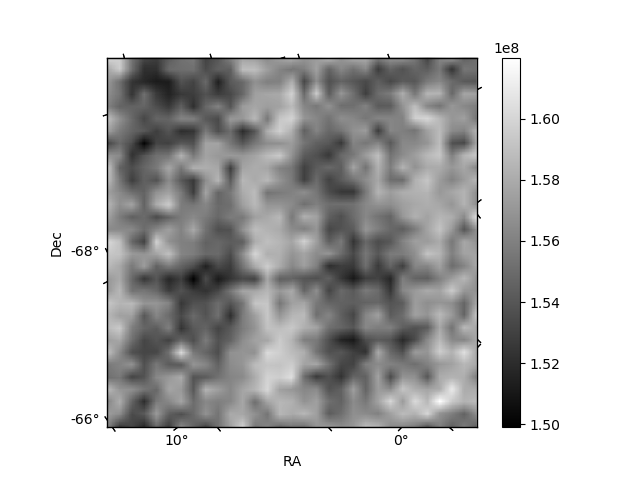
Histogram calculated using DETX and DETY for each event in the final _common_clean file
| Quadrant A | 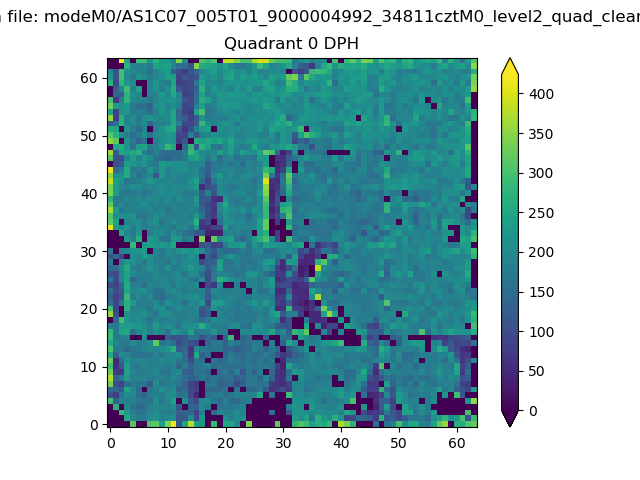 |
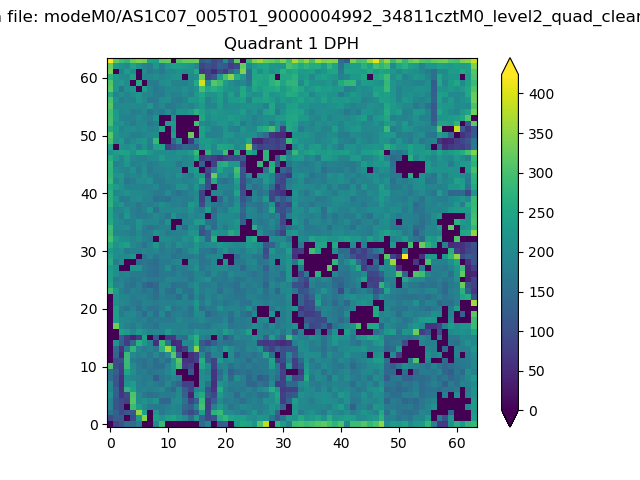 |
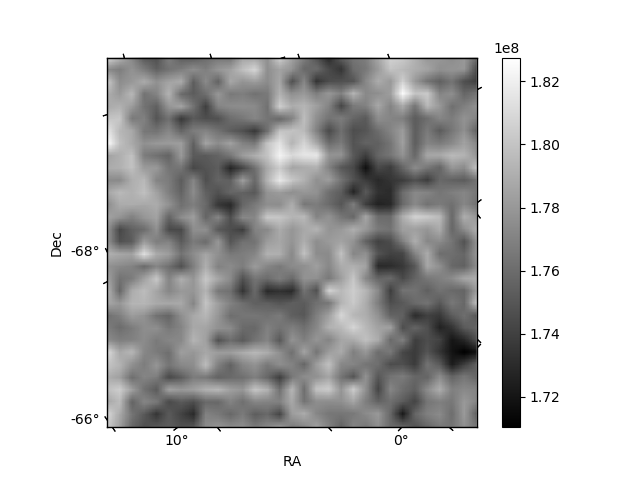
Quadrant B |
|---|---|---|---|
| Quadrant D | 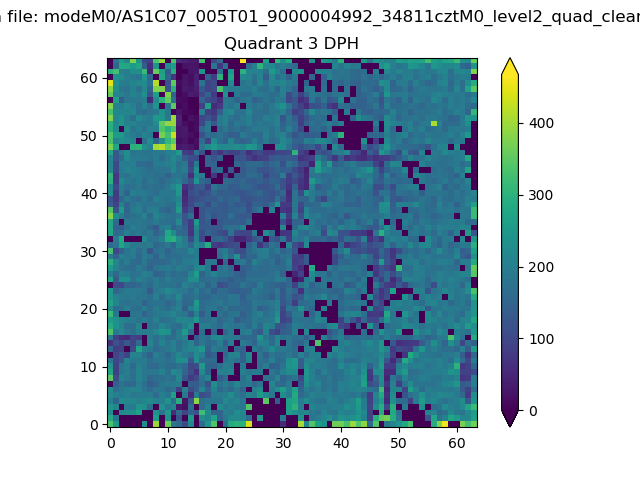 |
 |
Quadrant C |
| Plot type | Count rate plots | Images |
|---|---|---|
| Comparison with Poisson distribution Blue bars denote a histogram of data divided into 1 sec bins. Red curve is a Poisson curve with rate = median count rate of data. |
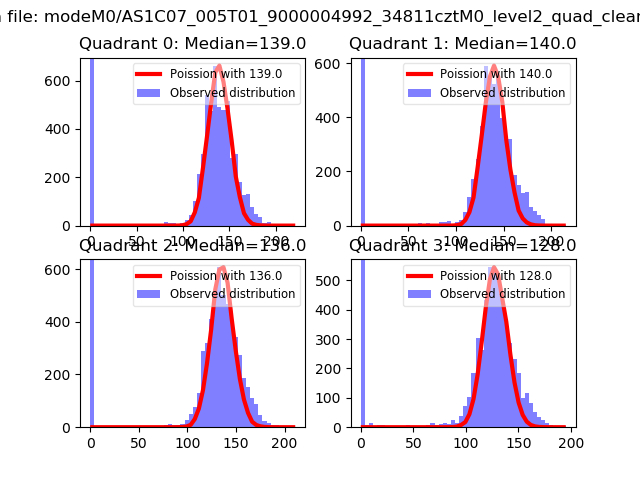 |
 |
| Quadrant-wise count rates Data is divided into 100 sec bins |
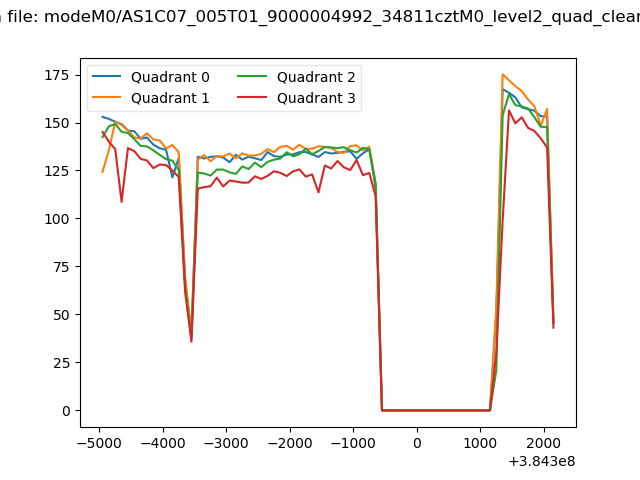 |
|
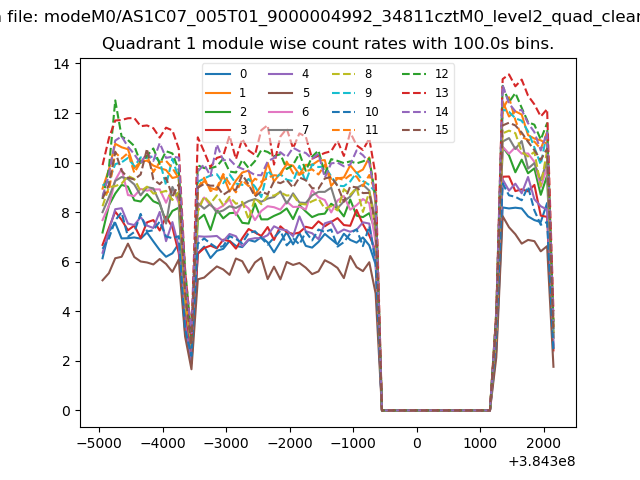
| Module-wise count rates for Quadrant A Data is divided into 100 sec bins |
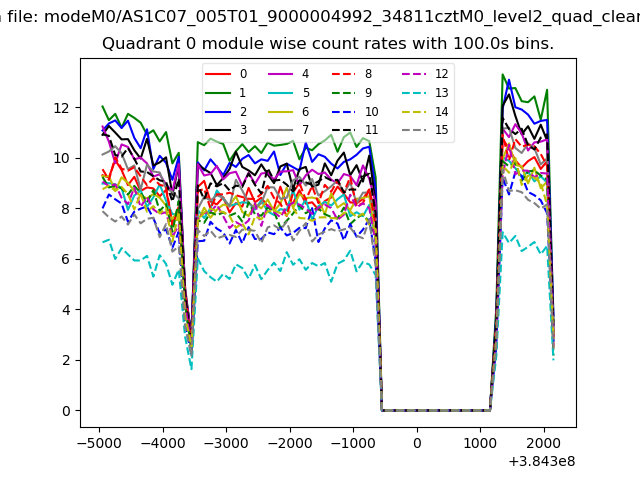 |
 |
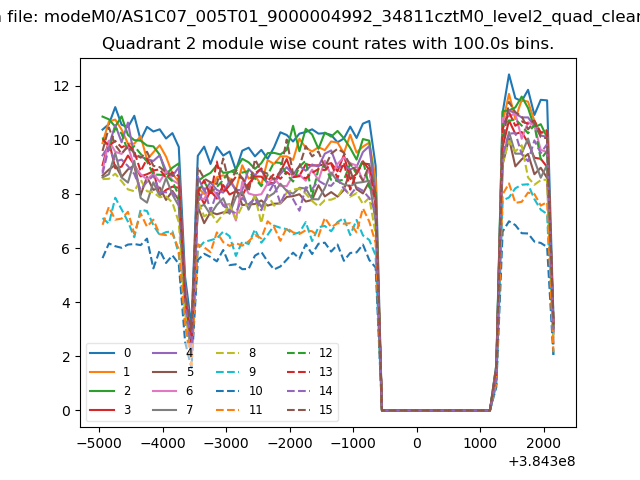
| Module-wise count rates for Quadrant B Data is divided into 100 sec bins |
 |
 |
| Module-wise count rates for Quadrant C Data is divided into 100 sec bins |
 |
 |
| Module-wise count rates for Quadrant D Data is divided into 100 sec bins |
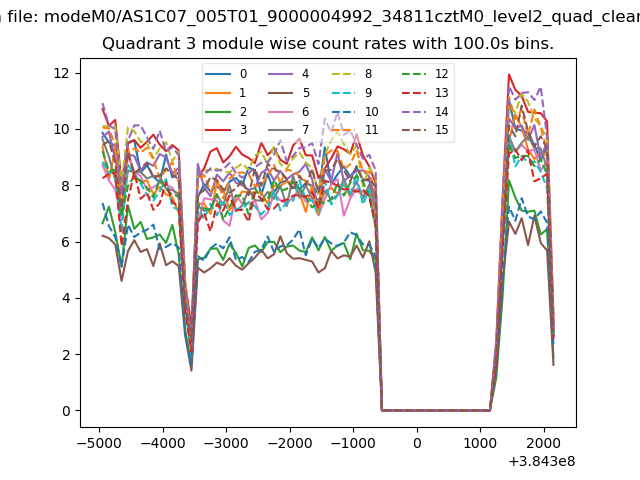 |
 |
| Parameter | Plot |
|---|---|
| CZT HV Monitor | 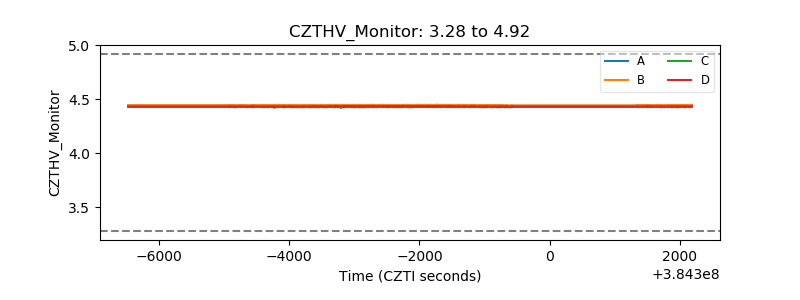 |
| D_VDD | 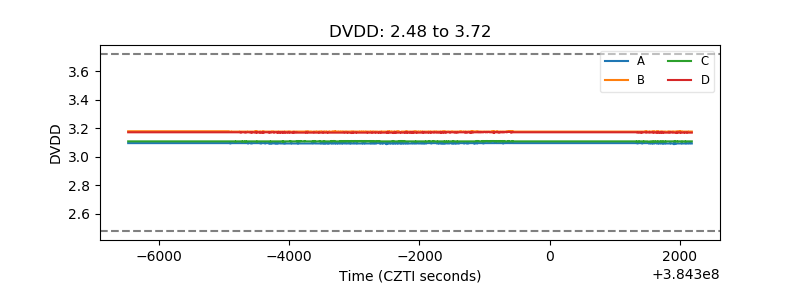 |
| Temperature 1 | 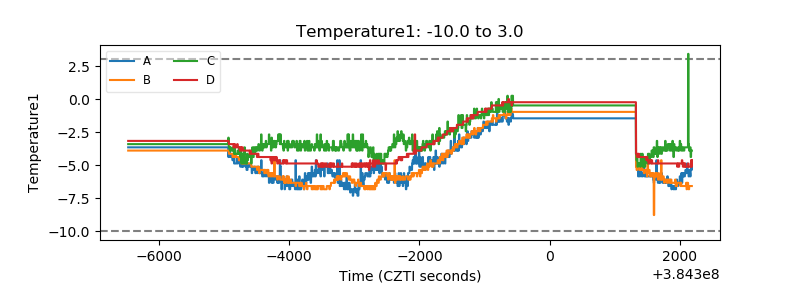 |
| Veto HV Monitor | 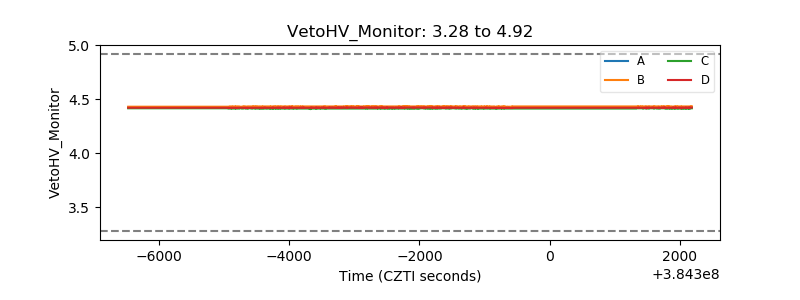 |
| Veto LLD | 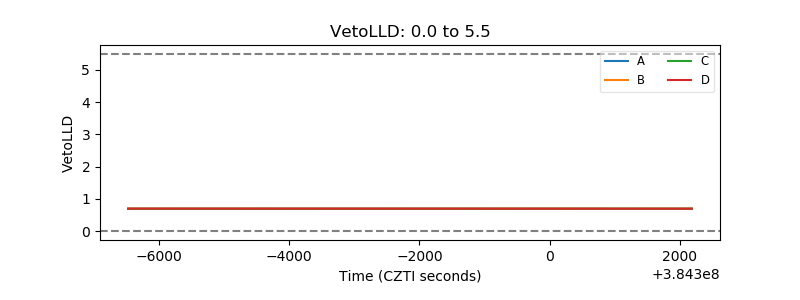 |
| Alpha Counter | 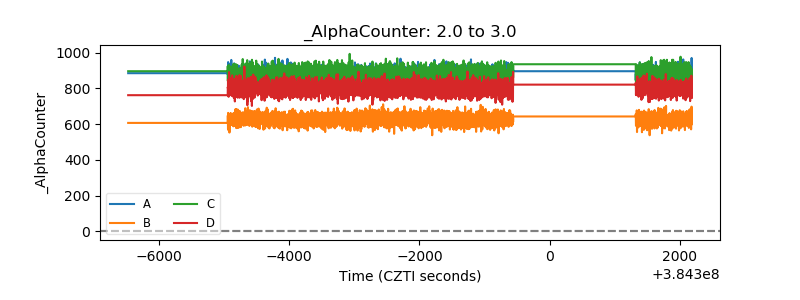 |
| _CPM_Rate | 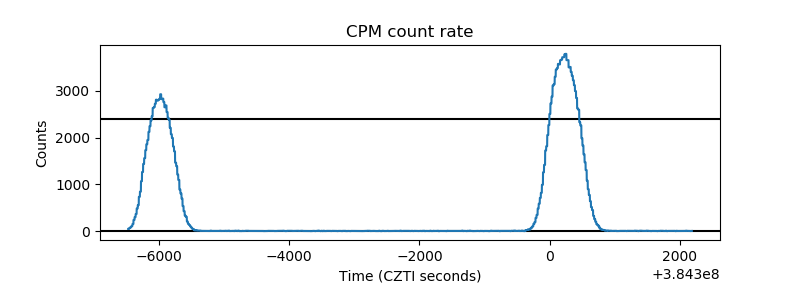 |
| CZT Counter | 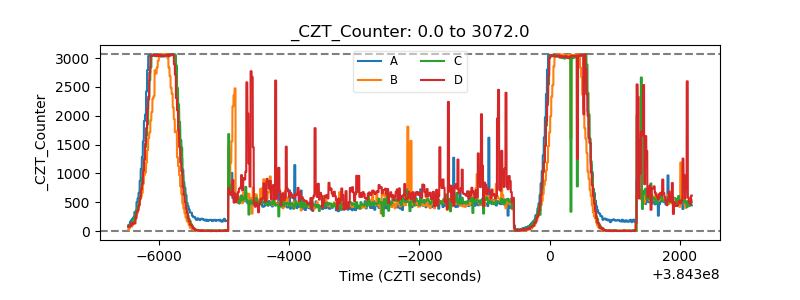 |
| +2.5 Volts monitor | 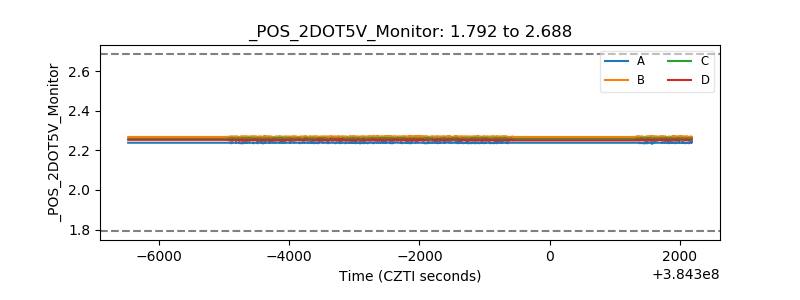 |
| +5 Volts monitor | 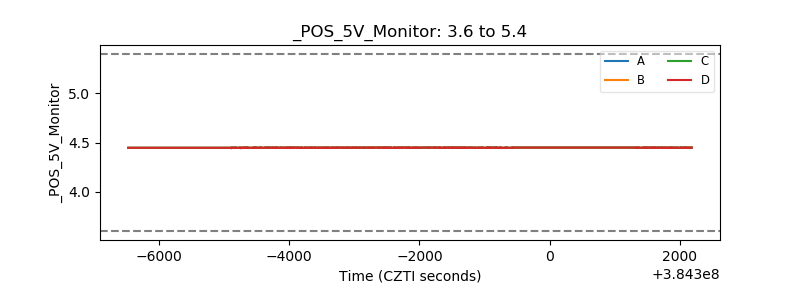 |
| _ROLL_ROT | 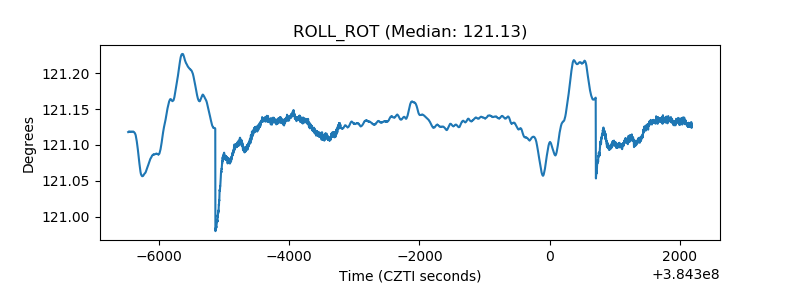 |
| _Roll_DEC | 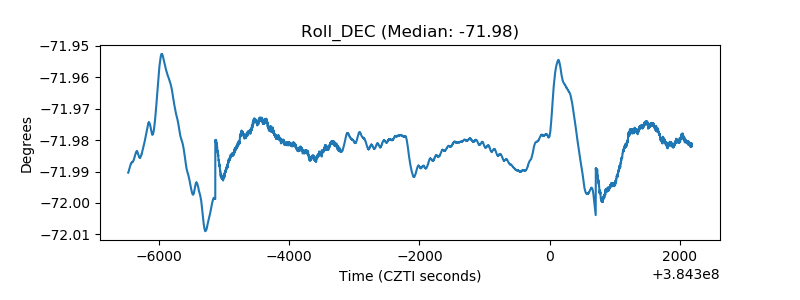 |
| _Roll_RA | 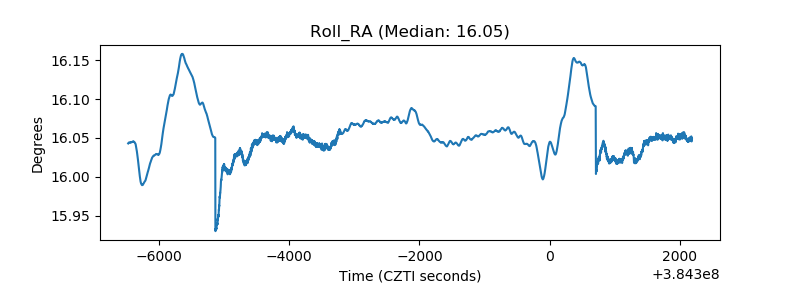 |
| Veto Counter | 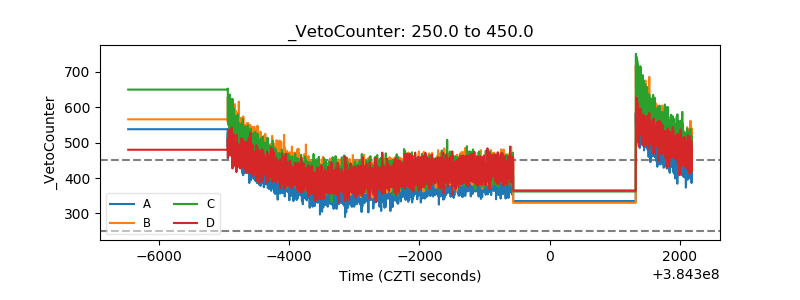 |