| Param | Original file | Final file |
|---|---|---|
| Filename | modeM0/AS1C07_005T01_9000004992_34810cztM0_level2.evt | modeM0/AS1C07_005T01_9000004992_34810cztM0_level2_quad_clean.evt |
| Size (bytes) | 432,881,280 | 103,161,600 |
| Size | 412.8 MB | 98.4 MB |
| Events in quadrant A | 2,543,306 | 709,332 |
| Events in quadrant B | 3,117,346 | 706,531 |
| Events in quadrant C | 2,833,436 | 688,716 |
| Events in quadrant D | 4,250,193 | 643,109 |
| Mode M9 | |||
|---|---|---|---|
| Quadrant | BADHDUFLAG | Total packets | Discarded packets |
| A | 0 | 29 | 0 |
| B | 0 | 29 | 0 |
| C | 0 | 29 | 0 |
| D | 0 | 30 | 0 |
| Mode M0 | |||
|---|---|---|---|
| Quadrant | BADHDUFLAG | Total packets | Discarded packets |
| A | 0 | 11150 | 3 |
| B | 0 | 12771 | 2 |
| C | 0 | 11437 | 2 |
| D | 0 | 16544 | 2 |
| Mode SS | |||
|---|---|---|---|
| Quadrant | BADHDUFLAG | Total packets | Discarded packets |
| A | 0 | 110 | 0 |
| B | 0 | 110 | 0 |
| C | 0 | 110 | 0 |
| D | 0 | 110 | 0 |
| Quadrant | Total seconds | Saturated seconds | Saturation percentage |
|---|---|---|---|
| A | 5378 | 12 | 0.223131% |
| B | 5378 | 158 | 2.937895% |
| C | 5378 | 40 | 0.743771% |
| D | 5378 | 220 | 4.090740% |
Noise dominated data is calculated using 1-second bins in cleaned event files. If a bin has >2000 counts, and if more than 50% of those come from <1% of pixels, then it is considered to be noise-dominated and hence unusable.
| Quadrant | # 1 sec bins | Bins with >0 counts | Bins with >2000 counts | High rate bins dominated by noise | Noise dominated (total time) | Noise dominated (detector-on time) | Marked lightcurve |
|---|---|---|---|---|---|---|---|
| A | 7140 | 5379 | 3 | 3 | 0.04% | 0.06% | 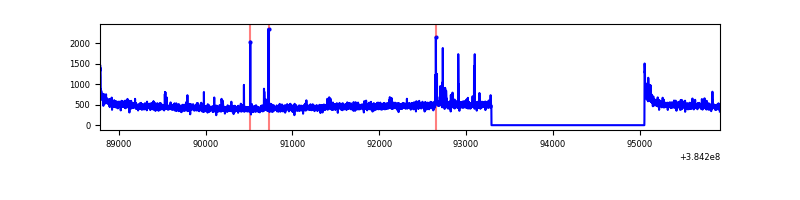 |
| B | 7140 | 5379 | 105 | 105 | 1.47% | 1.95% |  |
| C | 7140 | 5379 | 25 | 25 | 0.35% | 0.46% | 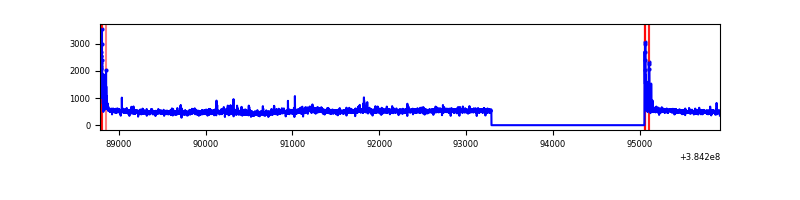 |
| D | 7140 | 5378 | 185 | 185 | 2.59% | 3.44% |  |
Top three noisy pixels from each quadrant. If the there are fewer than three noisy pixels in the level2.evt file, extra rows are filled as -1
| Pixel properties | Quadrant properties | ||||||
|---|---|---|---|---|---|---|---|
| Quadrant | DetID | PixID | Counts | Sigma | Mean | Median | Sigma |
| A | 10 | 83 | 52690 | 414.43 | 624 | 611 | 125.7 |
| A | 15 | 174 | 49516 | 389.17 | 624 | 611 | 125.7 |
| A | 7 | 3 | 10170 | 76.07 | 624 | 611 | 125.7 |
| B | 5 | 172 | 480234 | 4118.27 | 616 | 601 | 116.5 |
| B | 5 | 63 | 61122 | 519.65 | 616 | 601 | 116.5 |
| B | 5 | 255 | 49009 | 415.65 | 616 | 601 | 116.5 |
| C | 15 | 214 | 246731 | 1768.88 | 602 | 606 | 139.1 |
| C | 0 | 10 | 117864 | 842.73 | 602 | 606 | 139.1 |
| C | 14 | 67 | 92040 | 657.13 | 602 | 606 | 139.1 |
| D | 8 | 195 | 894377 | 5596.0 | 585 | 573 | 159.7 |
| D | 13 | 249 | 283119 | 1768.99 | 585 | 573 | 159.7 |
| D | 2 | 249 | 243831 | 1523.01 | 585 | 573 | 159.7 |
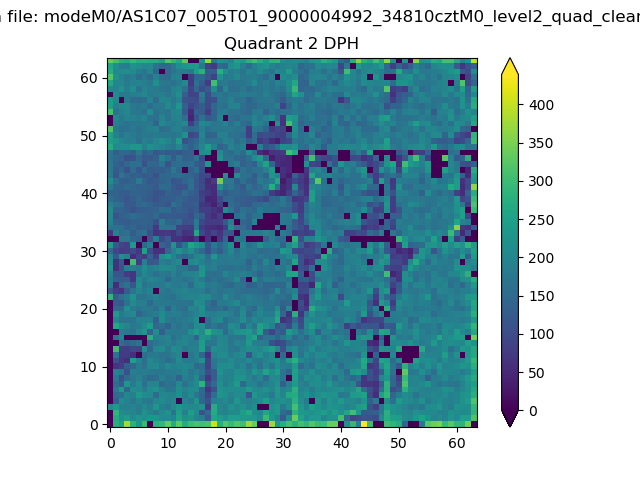
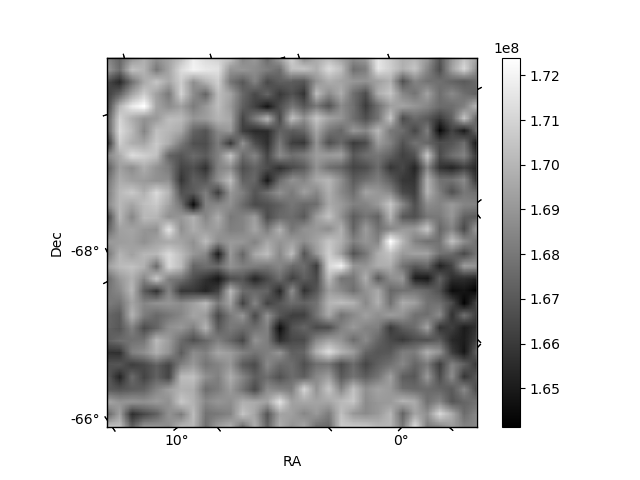
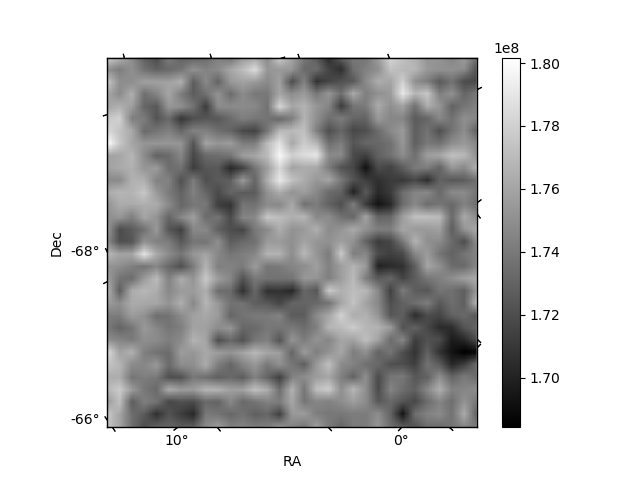
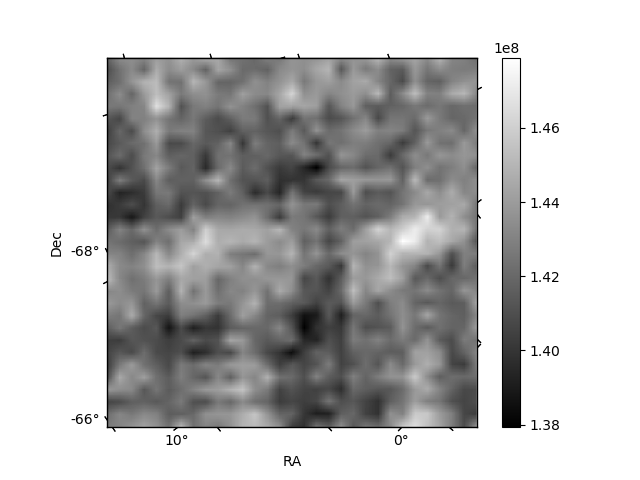
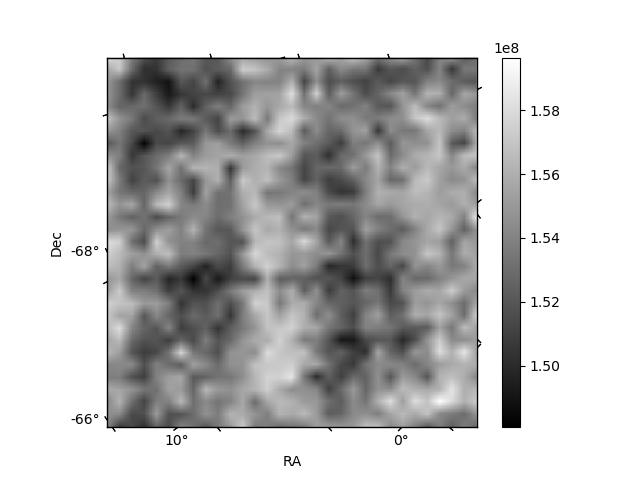
Histogram calculated using DETX and DETY for each event in the final _common_clean file
| Quadrant A | 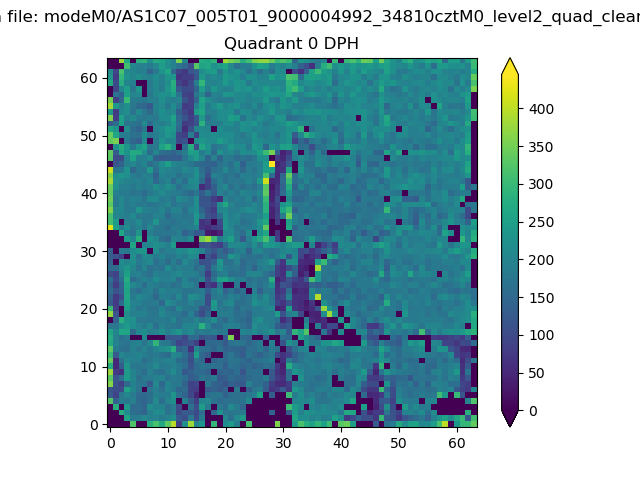 |
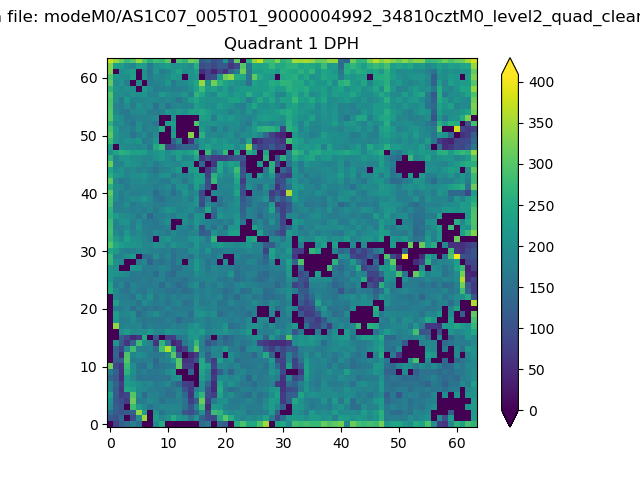 |
Quadrant B |
|---|---|---|---|
| Quadrant D | 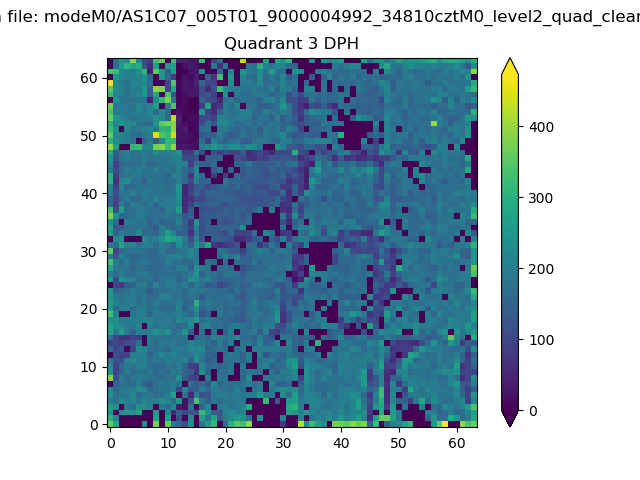 |
 |
Quadrant C |
| Plot type | Count rate plots | Images |
|---|---|---|
| Comparison with Poisson distribution Blue bars denote a histogram of data divided into 1 sec bins. Red curve is a Poisson curve with rate = median count rate of data. |
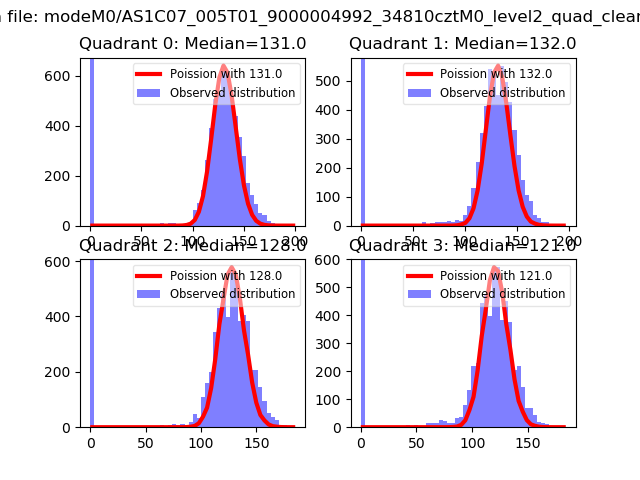 |
 |
| Quadrant-wise count rates Data is divided into 100 sec bins |
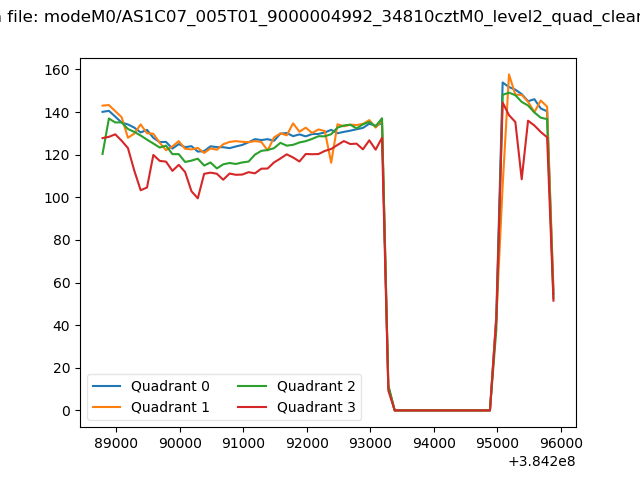 |
|
| Module-wise count rates for Quadrant A Data is divided into 100 sec bins |
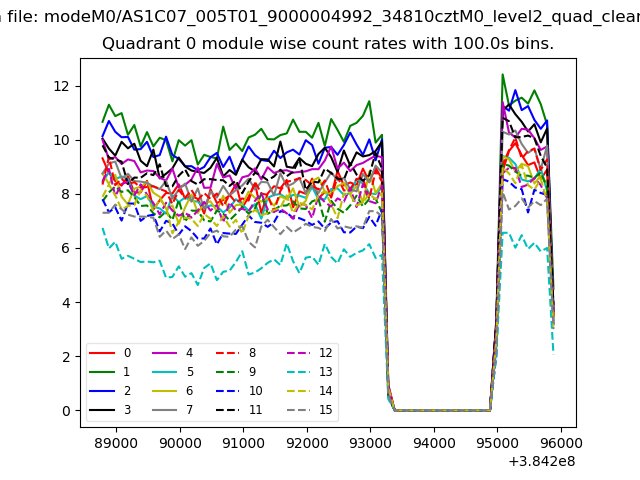 |
 |
| Module-wise count rates for Quadrant B Data is divided into 100 sec bins |
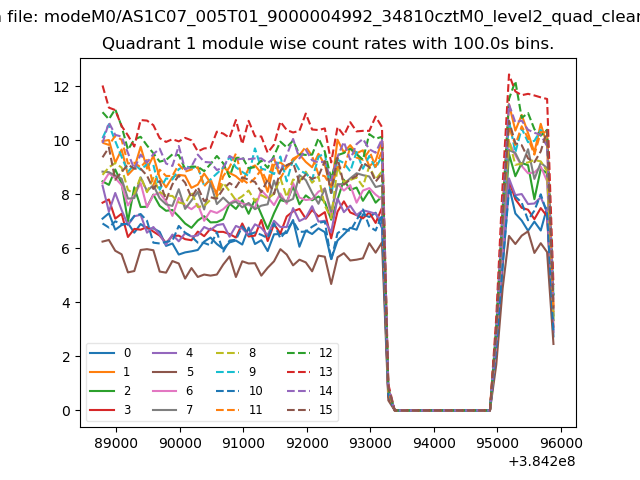 |
 |
| Module-wise count rates for Quadrant C Data is divided into 100 sec bins |
 |
 |
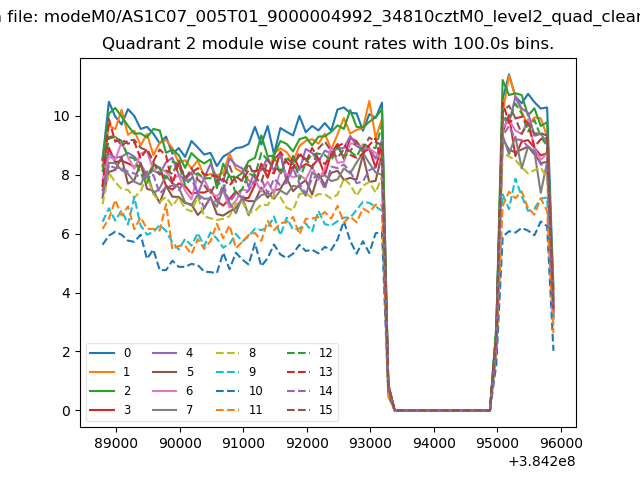
| Module-wise count rates for Quadrant D Data is divided into 100 sec bins |
 |
 |
| Parameter | Plot |
|---|---|
| CZT HV Monitor | 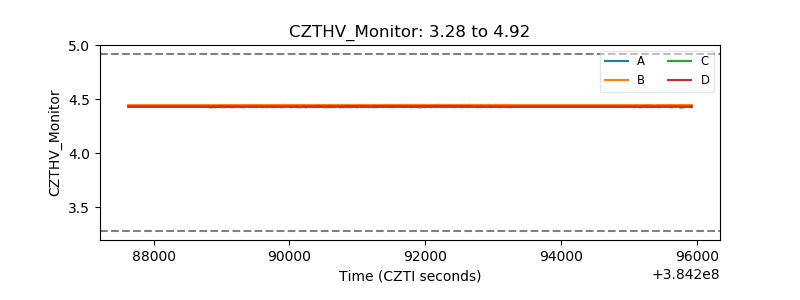 |
| D_VDD | 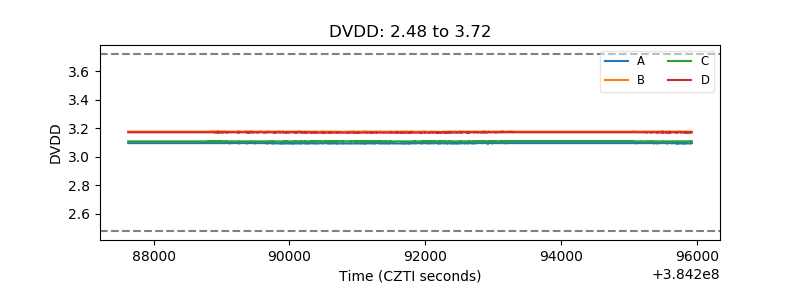 |
| Temperature 1 | 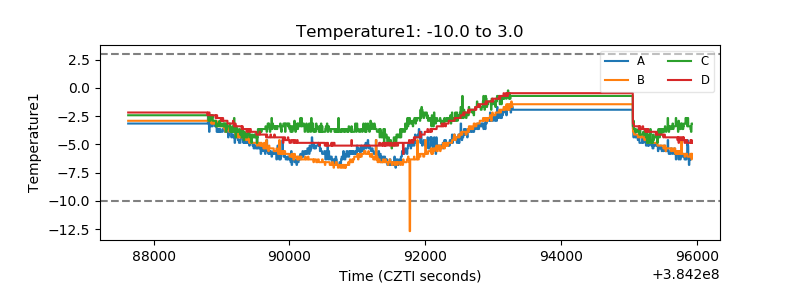 |
| Veto HV Monitor | 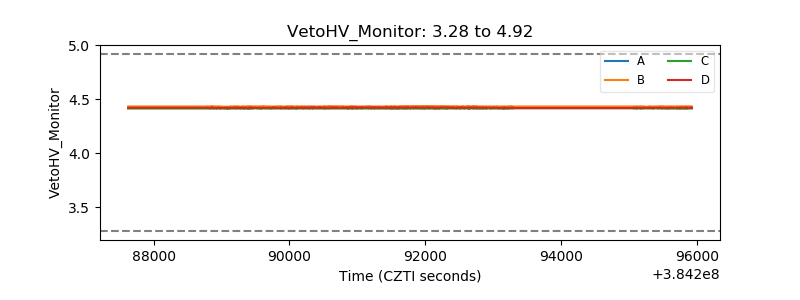 |
| Veto LLD |  |
| Alpha Counter | 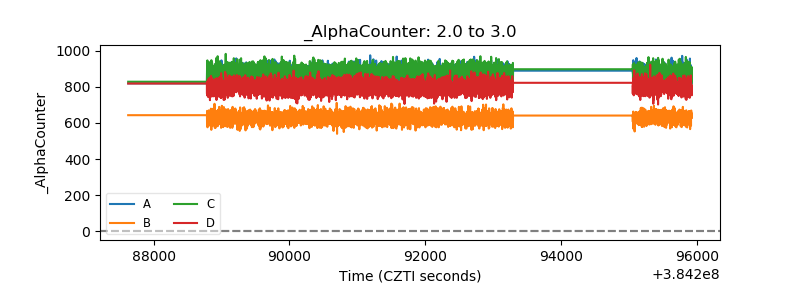 |
| _CPM_Rate | 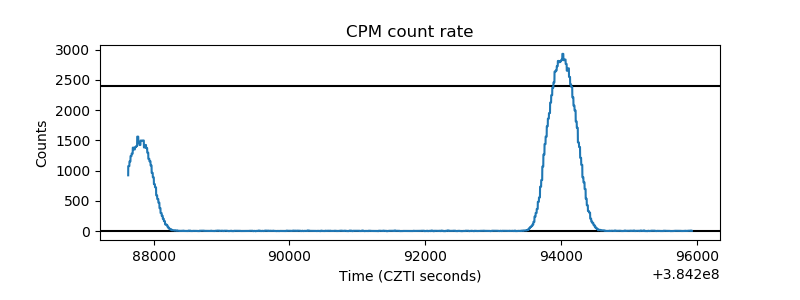 |
| CZT Counter | 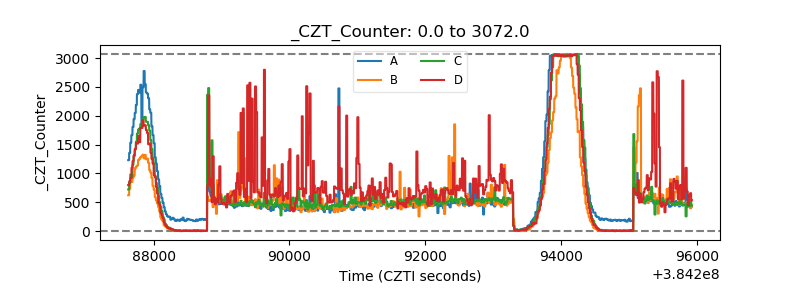 |
| +2.5 Volts monitor | 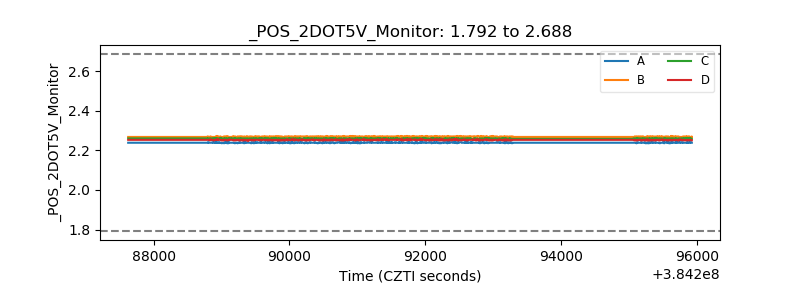 |
| +5 Volts monitor | 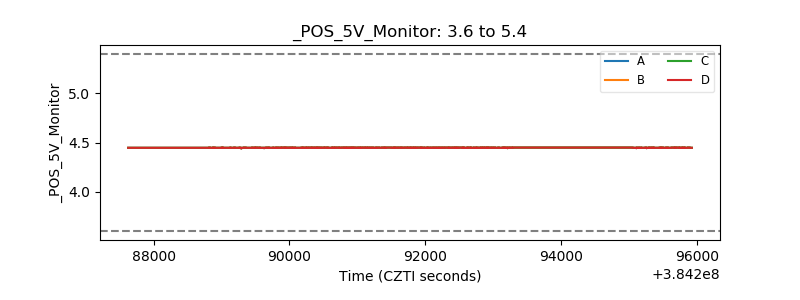 |
| _ROLL_ROT | 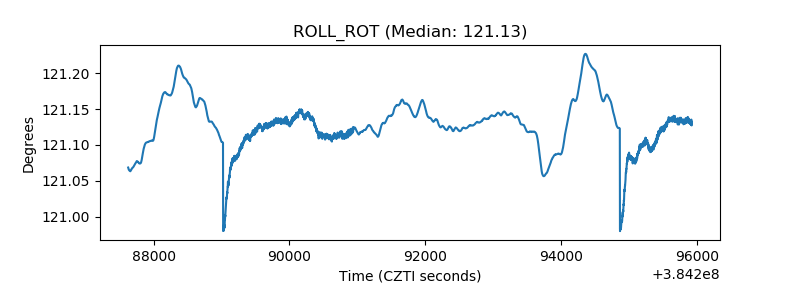 |
| _Roll_DEC | 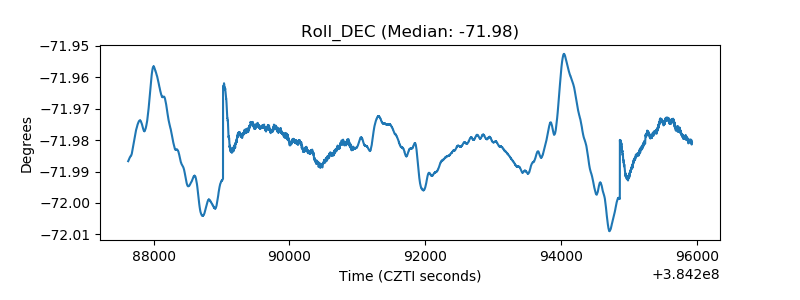 |
| _Roll_RA | 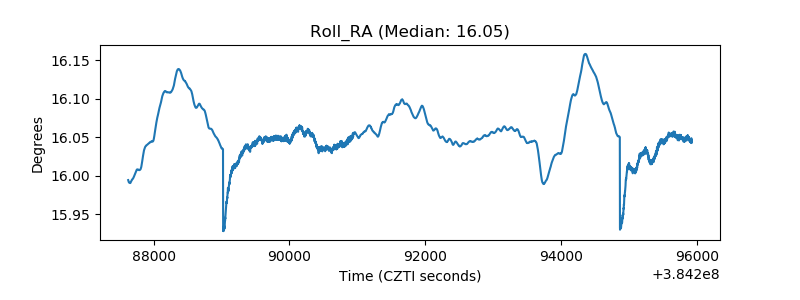 |
| Veto Counter | 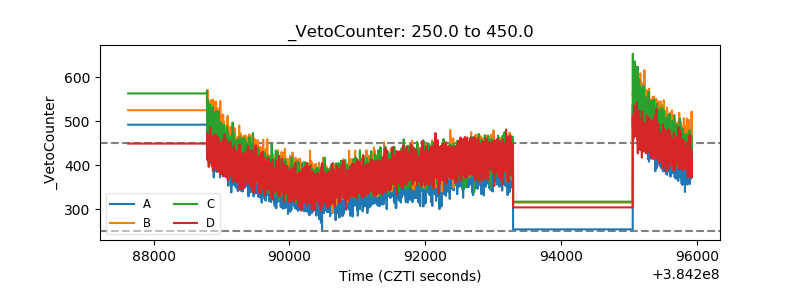 |