| Param | Original file | Final file |
|---|---|---|
| Filename | modeM0/AS1C07_005T01_9000004992_34808cztM0_level2.evt | modeM0/AS1C07_005T01_9000004992_34808cztM0_level2_quad_clean.evt |
| Size (bytes) | 438,675,840 | 103,253,760 |
| Size | 418.4 MB | 98.5 MB |
| Events in quadrant A | 2,588,792 | 703,855 |
| Events in quadrant B | 3,067,710 | 706,477 |
| Events in quadrant C | 2,867,591 | 686,458 |
| Events in quadrant D | 4,382,893 | 640,547 |
| Mode M9 | |||
|---|---|---|---|
| Quadrant | BADHDUFLAG | Total packets | Discarded packets |
| A | 0 | 24 | 0 |
| B | 0 | 24 | 0 |
| C | 0 | 24 | 0 |
| D | 0 | 25 | 0 |
| Mode M0 | |||
|---|---|---|---|
| Quadrant | BADHDUFLAG | Total packets | Discarded packets |
| A | 0 | 11504 | 3 |
| B | 0 | 12797 | 2 |
| C | 0 | 11874 | 2 |
| D | 0 | 17029 | 2 |
| Mode SS | |||
|---|---|---|---|
| Quadrant | BADHDUFLAG | Total packets | Discarded packets |
| A | 0 | 114 | 0 |
| B | 0 | 114 | 0 |
| C | 0 | 114 | 0 |
| D | 0 | 114 | 0 |
| Quadrant | Total seconds | Saturated seconds | Saturation percentage |
|---|---|---|---|
| A | 5567 | 11 | 0.197593% |
| B | 5567 | 99 | 1.778337% |
| C | 5567 | 45 | 0.808335% |
| D | 5567 | 308 | 5.532603% |
Noise dominated data is calculated using 1-second bins in cleaned event files. If a bin has >2000 counts, and if more than 50% of those come from <1% of pixels, then it is considered to be noise-dominated and hence unusable.
| Quadrant | # 1 sec bins | Bins with >0 counts | Bins with >2000 counts | High rate bins dominated by noise | Noise dominated (total time) | Noise dominated (detector-on time) | Marked lightcurve |
|---|---|---|---|---|---|---|---|
| A | 7179 | 5568 | 5 | 5 | 0.07% | 0.09% | 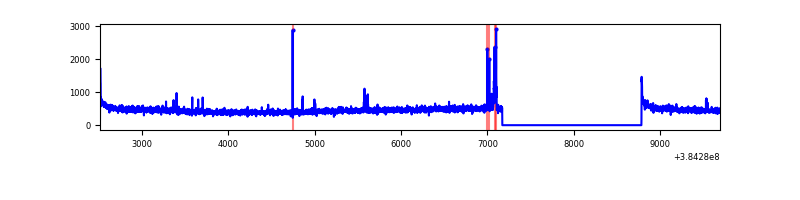 |
| B | 7179 | 5568 | 60 | 60 | 0.84% | 1.08% | 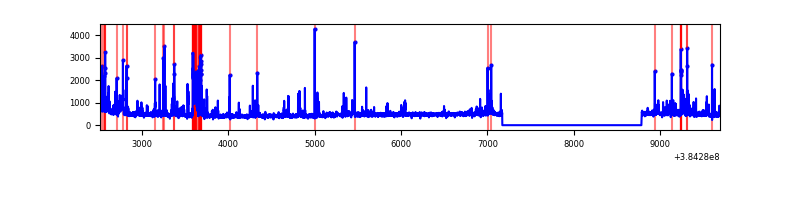 |
| C | 7179 | 5568 | 30 | 30 | 0.42% | 0.54% | 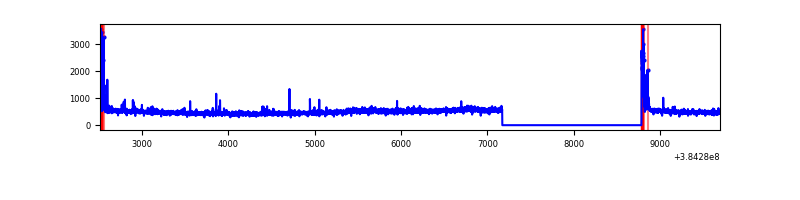 |
| D | 7179 | 5568 | 267 | 267 | 3.72% | 4.80% | 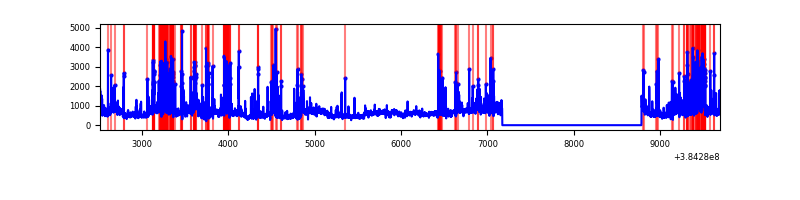 |
Top three noisy pixels from each quadrant. If the there are fewer than three noisy pixels in the level2.evt file, extra rows are filled as -1
| Pixel properties | Quadrant properties | ||||||
|---|---|---|---|---|---|---|---|
| Quadrant | DetID | PixID | Counts | Sigma | Mean | Median | Sigma |
| A | 10 | 83 | 53848 | 417.22 | 634 | 623 | 127.6 |
| A | 15 | 174 | 51942 | 402.28 | 634 | 623 | 127.6 |
| A | 7 | 3 | 12521 | 93.27 | 634 | 623 | 127.6 |
| B | 5 | 172 | 352901 | 2932.6 | 631 | 615 | 120.1 |
| B | 5 | 255 | 113032 | 935.81 | 631 | 615 | 120.1 |
| B | 4 | 232 | 35252 | 288.33 | 631 | 615 | 120.1 |
| C | 15 | 214 | 254193 | 1810.91 | 609 | 613 | 140.0 |
| C | 0 | 10 | 144046 | 1024.31 | 609 | 613 | 140.0 |
| C | 14 | 67 | 61019 | 431.38 | 609 | 613 | 140.0 |
| D | 8 | 195 | 741604 | 4962.64 | 596 | 580 | 149.3 |
| D | 2 | 249 | 437147 | 2923.69 | 596 | 580 | 149.3 |
| D | 10 | 118 | 360567 | 2410.84 | 596 | 580 | 149.3 |
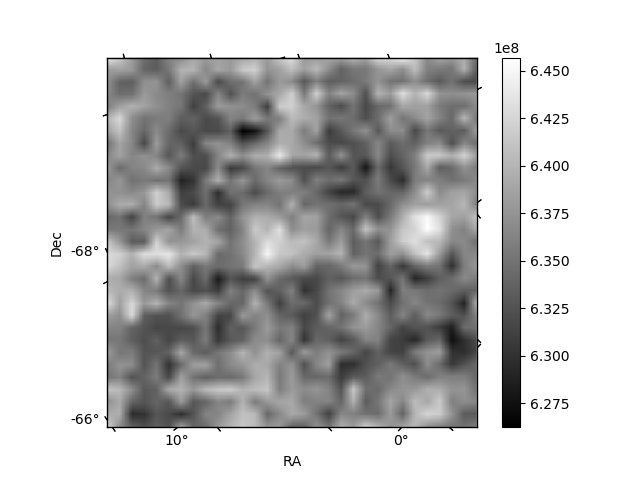
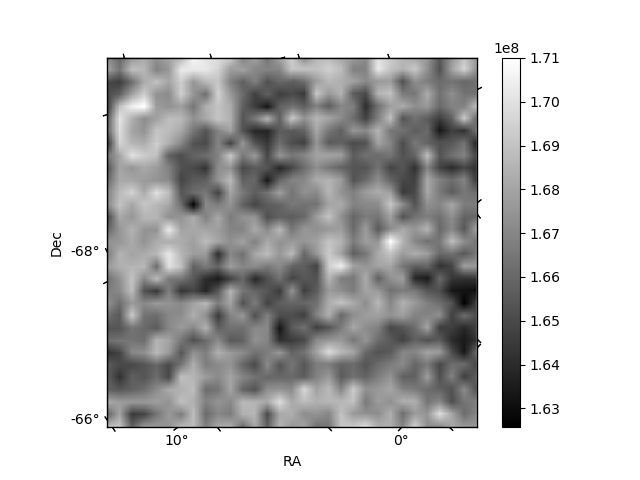
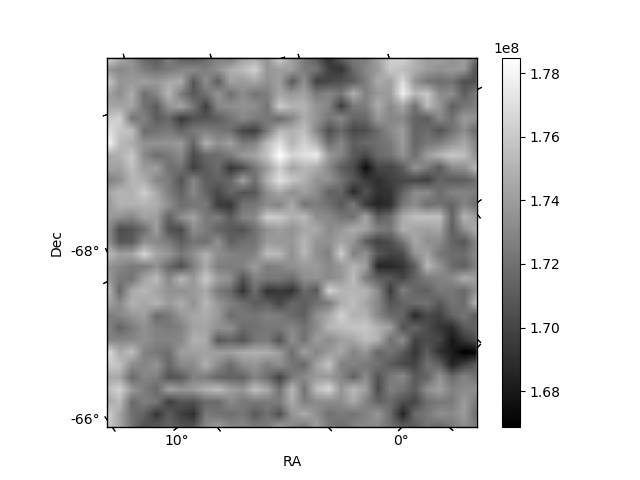
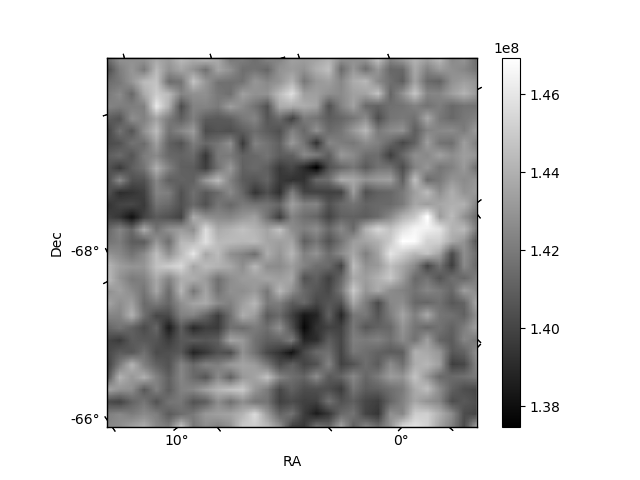
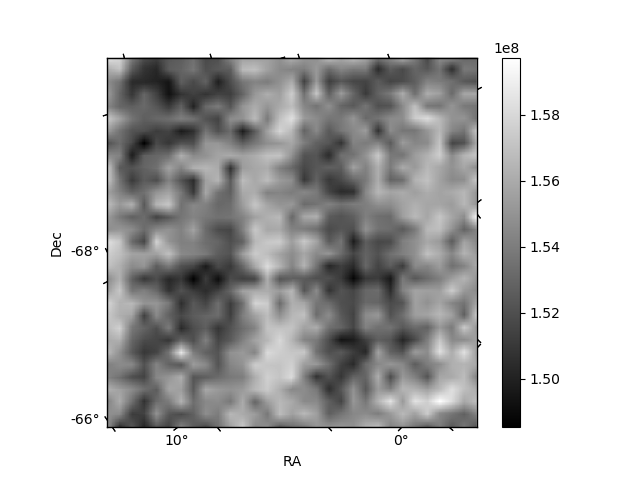
Histogram calculated using DETX and DETY for each event in the final _common_clean file
| Quadrant A | 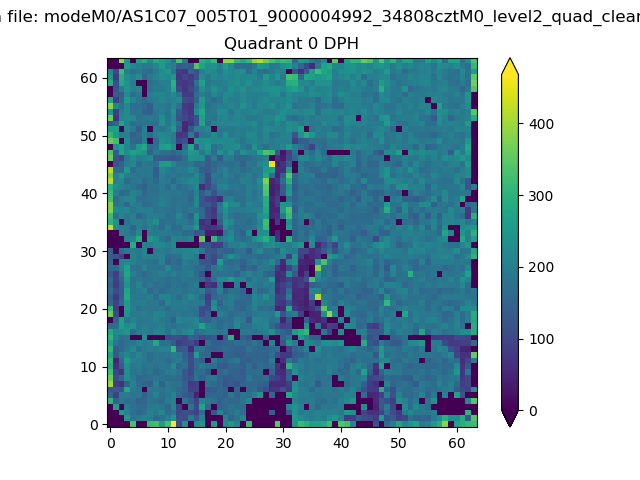 |
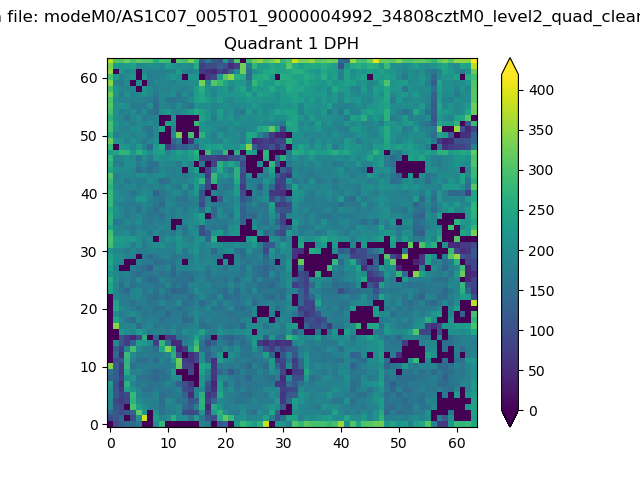 |
Quadrant B |
|---|---|---|---|
| Quadrant D | 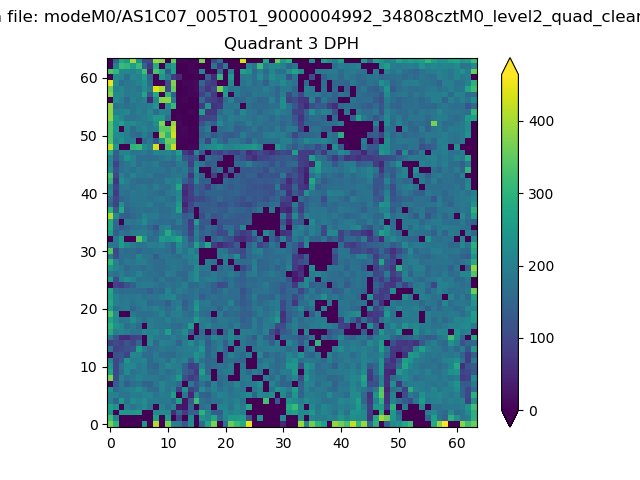 |
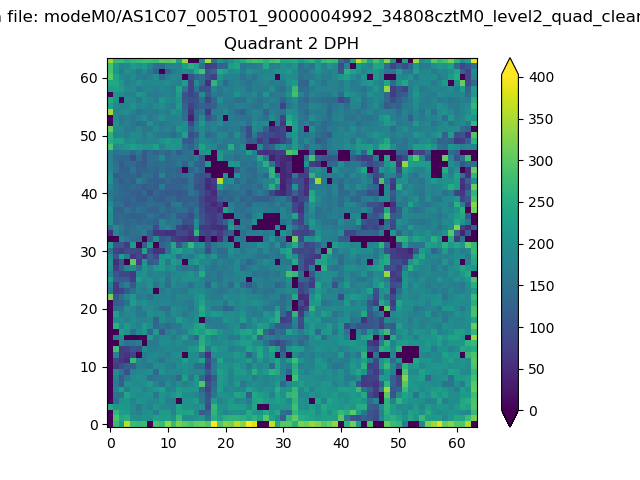 |
Quadrant C |
| Plot type | Count rate plots | Images |
|---|---|---|
| Comparison with Poisson distribution Blue bars denote a histogram of data divided into 1 sec bins. Red curve is a Poisson curve with rate = median count rate of data. |
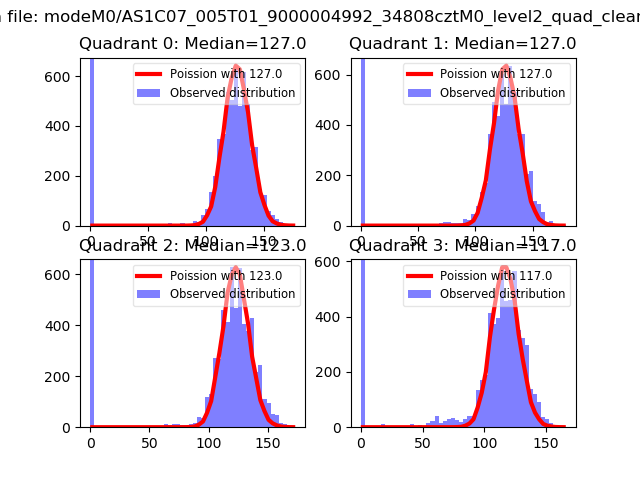 |
 |
| Quadrant-wise count rates Data is divided into 100 sec bins |
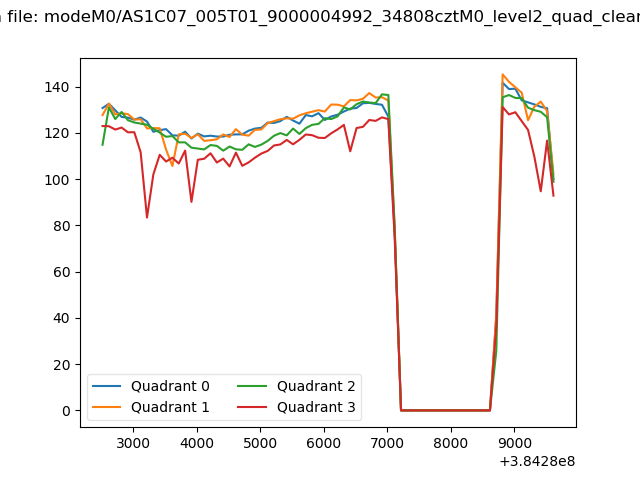 |
|
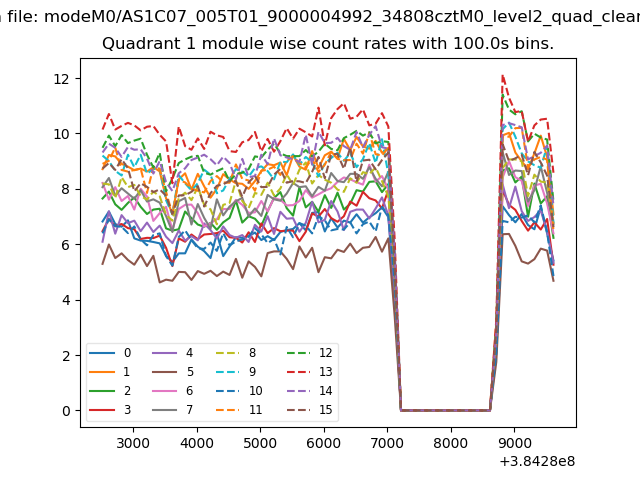
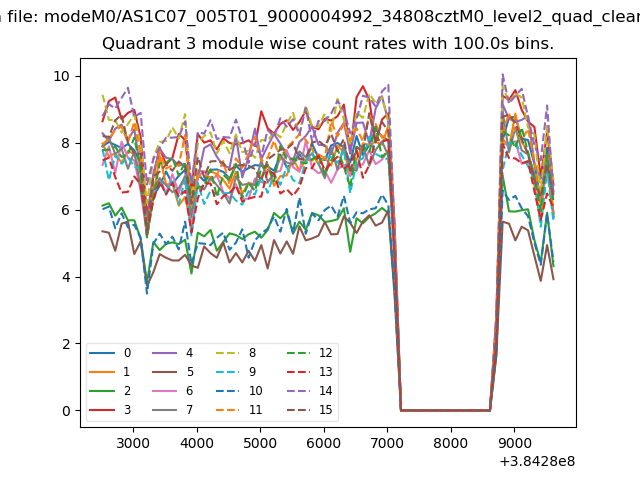
| Module-wise count rates for Quadrant A Data is divided into 100 sec bins |
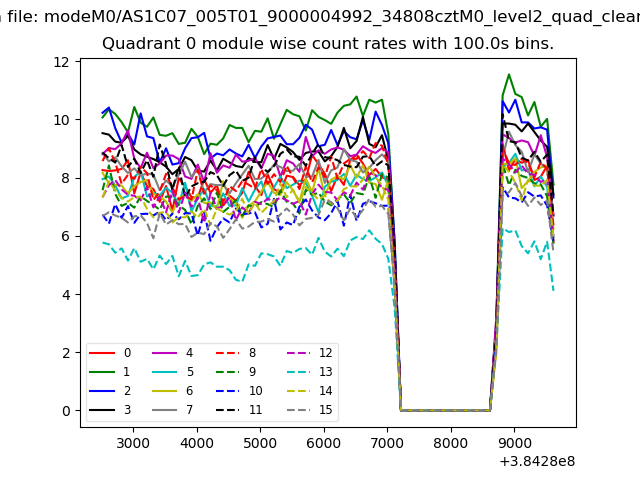 |
 |
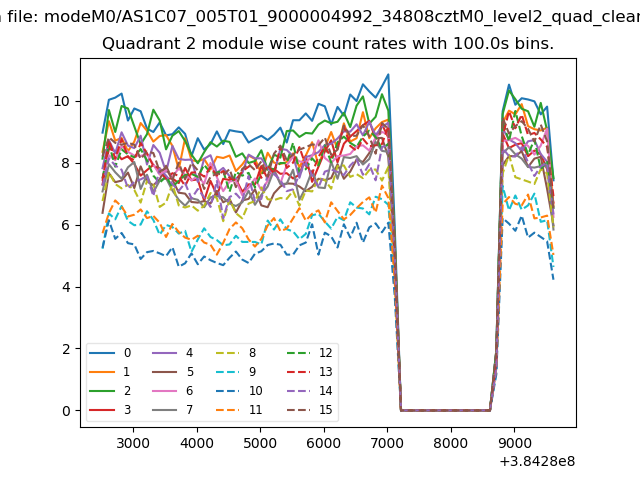
| Module-wise count rates for Quadrant B Data is divided into 100 sec bins |
 |
 |
| Module-wise count rates for Quadrant C Data is divided into 100 sec bins |
 |
 |
| Module-wise count rates for Quadrant D Data is divided into 100 sec bins |
 |
 |
| Parameter | Plot |
|---|---|
| CZT HV Monitor | 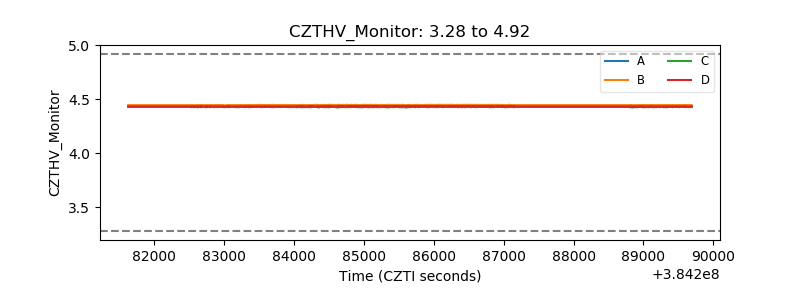 |
| D_VDD | 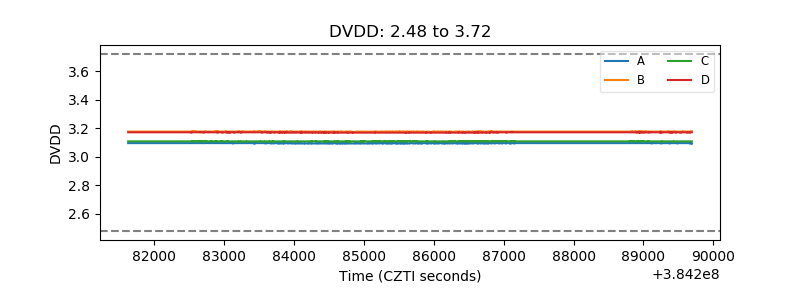 |
| Temperature 1 | 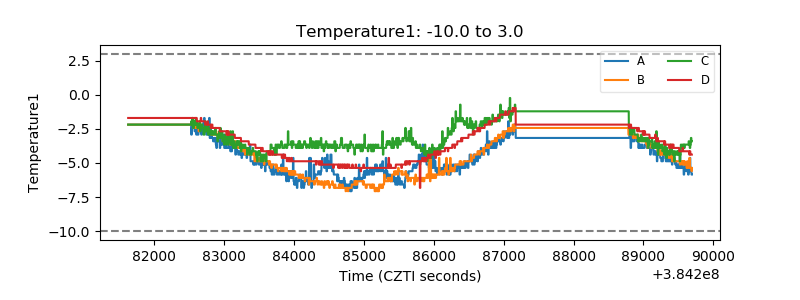 |
| Veto HV Monitor | 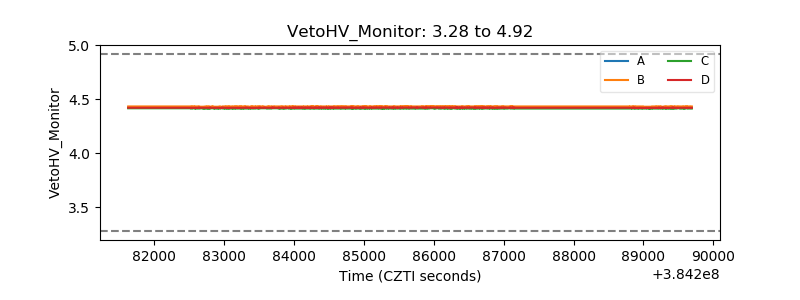 |
| Veto LLD | 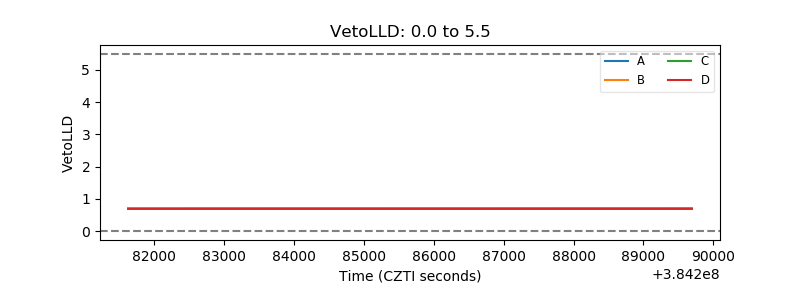 |
| Alpha Counter | 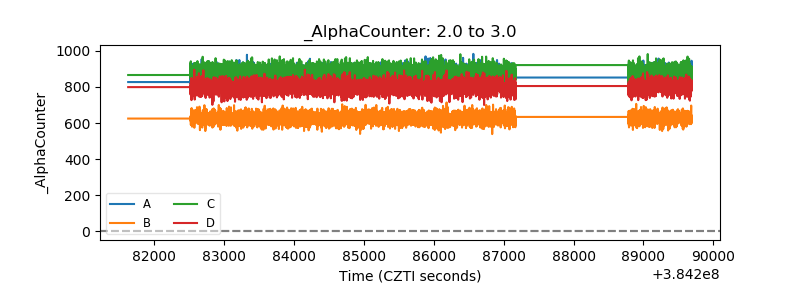 |
| _CPM_Rate | 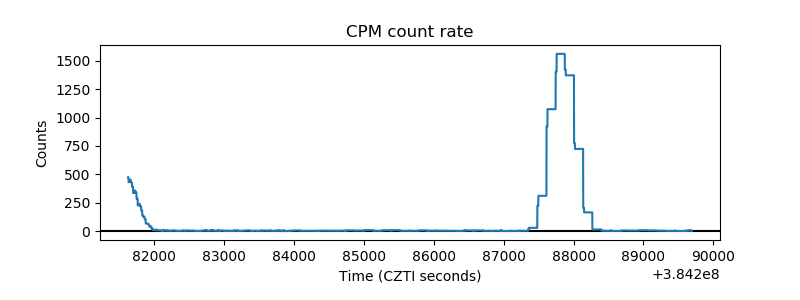 |
| CZT Counter | 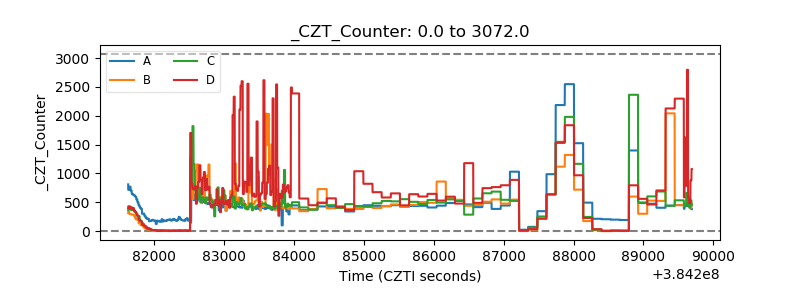 |
| +2.5 Volts monitor | 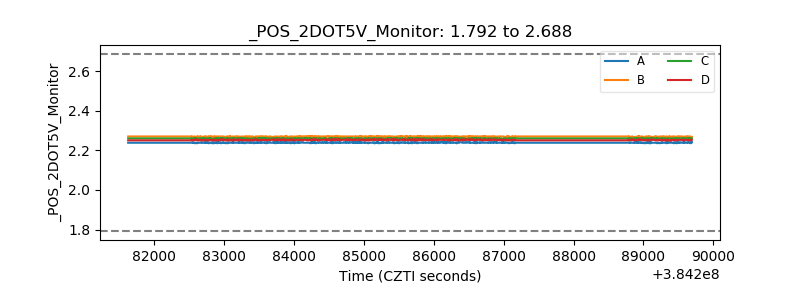 |
| +5 Volts monitor | 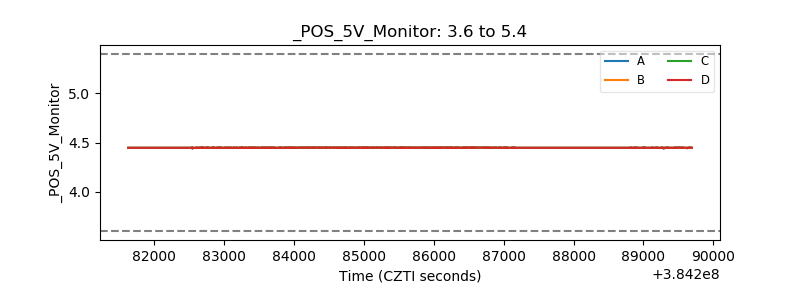 |
| _ROLL_ROT | 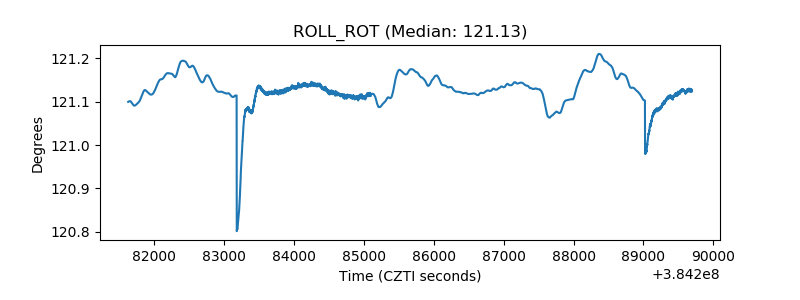 |
| _Roll_DEC | 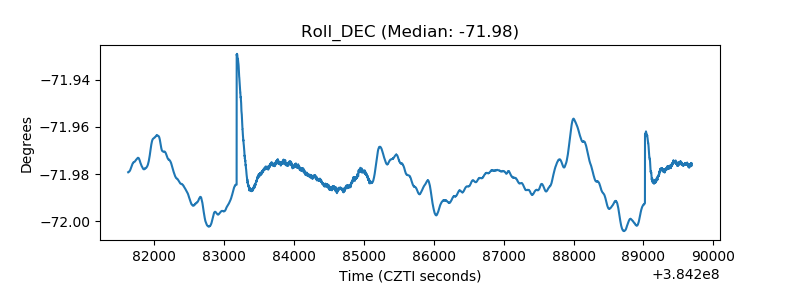 |
| _Roll_RA | 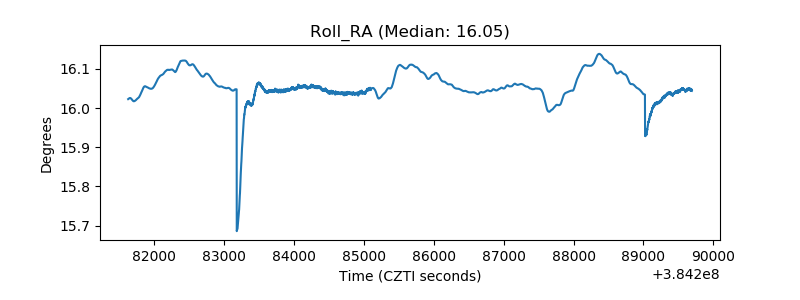 |
| Veto Counter | 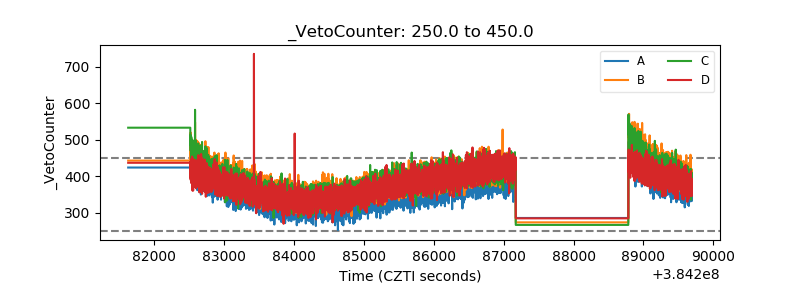 |