| Param | Original file | Final file |
|---|---|---|
| Filename | modeM0/AS1C07_005T01_9000004992cztM0_level2_bc.evt | modeM0/AS1C07_005T01_9000004992cztM0_level2_quad_clean.evt |
| Size (bytes) | 20,266,297,920 | 5,274,331,200 |
| Size | 18.9 GB | 4.9 GB |
| Events in quadrant A | 174,404,383 | 34,192,139 |
| Events in quadrant B | 136,596,369 | 29,807,198 |
| Events in quadrant C | 101,649,825 | 37,934,709 |
| Events in quadrant D | 178,351,151 | 34,863,941 |
| Mode M9 | |||
|---|---|---|---|
| Quadrant | BADHDUFLAG | Total packets | Discarded packets |
| A | 0 | 1284 | 0 |
| B | 0 | 1284 | 0 |
| C | 0 | 1284 | 0 |
| D | 0 | 1284 | 0 |
| Mode M0 | |||
|---|---|---|---|
| Quadrant | BADHDUFLAG | Total packets | Discarded packets |
| A | 0 | 1202422 | 0 |
| B | 0 | 1588069 | 0 |
| C | 0 | 752690 | 0 |
| D | 0 | 1048799 | 0 |
| Mode SS | |||
|---|---|---|---|
| Quadrant | BADHDUFLAG | Total packets | Discarded packets |
| A | 0 | 6820 | 0 |
| B | 0 | 6820 | 0 |
| C | 0 | 6820 | 0 |
| D | 0 | 6820 | 0 |
| Quadrant | Total seconds | Saturated seconds | Saturation percentage |
|---|---|---|---|
| A | 334199 | 68091 | 20.374388% |
| B | 334199 | 130156 | 38.945658% |
| C | 334199 | 4732 | 1.415923% |
| D | 334199 | 23022 | 6.888710% |
Noise dominated data is calculated using 1-second bins in cleaned event files. If a bin has >2000 counts, and if more than 50% of those come from <1% of pixels, then it is considered to be noise-dominated and hence unusable.
| Quadrant | # 1 sec bins | Bins with >0 counts | Bins with >2000 counts | High rate bins dominated by noise | Noise dominated (total time) | Noise dominated (detector-on time) | Marked lightcurve |
|---|---|---|---|---|---|---|---|
| A | 462058 | 334051 | 1020 | 1020 | 0.22% | 0.31% | 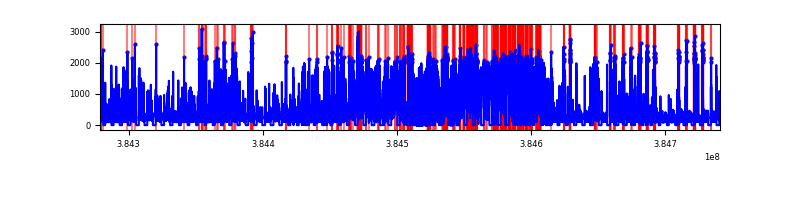 |
| B | 462058 | 334180 | 3757 | 3757 | 0.81% | 1.12% | 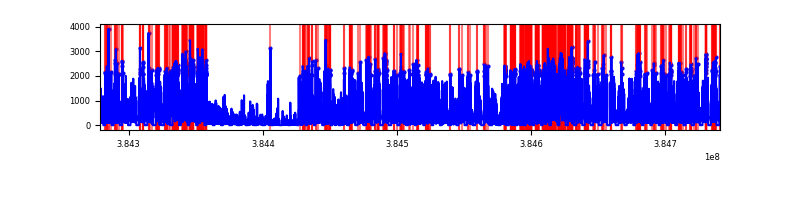 |
| C | 462058 | 334201 | 1168 | 1168 | 0.25% | 0.35% |  |
| D | 462058 | 334196 | 6623 | 6623 | 1.43% | 1.98% | 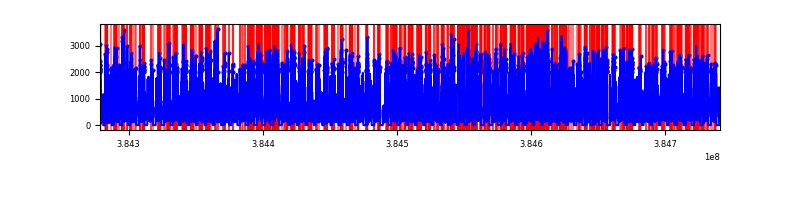 |
Top three noisy pixels from each quadrant. If the there are fewer than three noisy pixels in the level2.evt file, extra rows are filled as -1
| Pixel properties | Quadrant properties | ||||||
|---|---|---|---|---|---|---|---|
| Quadrant | DetID | PixID | Counts | Sigma | Mean | Median | Sigma |
| A | 15 | 169 | 104892290 | 30038.63 | 15856 | 15669 | 3491.4 |
| A | 15 | 237 | 2632928 | 749.63 | 15856 | 15669 | 3491.4 |
| A | 10 | 83 | 1980893 | 562.88 | 15856 | 15669 | 3491.4 |
| B | 4 | 251 | 22005719 | 7977.54 | 13858 | 13665 | 2756.7 |
| B | 5 | 31 | 19806487 | 7179.77 | 13858 | 13665 | 2756.7 |
| B | 5 | 172 | 14346861 | 5199.31 | 13858 | 13665 | 2756.7 |
| C | 15 | 214 | 14301238 | 3672.86 | 17128 | 17069 | 3889.1 |
| C | 0 | 207 | 9341406 | 2397.55 | 17128 | 17069 | 3889.1 |
| C | 0 | 10 | 5301793 | 1358.85 | 17128 | 17069 | 3889.1 |
| D | 8 | 195 | 38393577 | 9482.16 | 16783 | 16350 | 4047.3 |
| D | 12 | 227 | 21810298 | 5384.8 | 16783 | 16350 | 4047.3 |
| D | 14 | 52 | 11925882 | 2942.58 | 16783 | 16350 | 4047.3 |
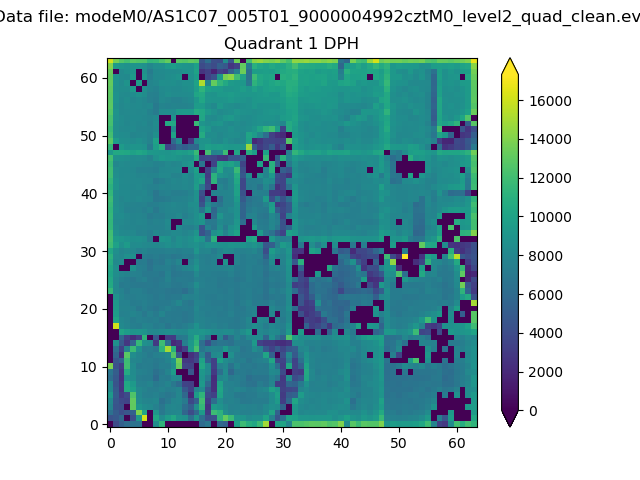
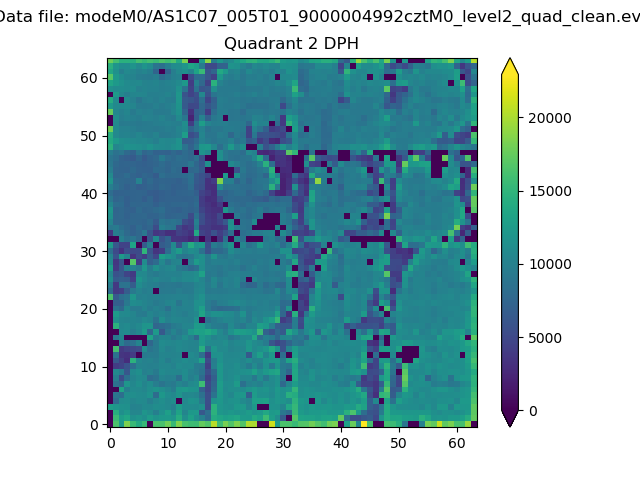
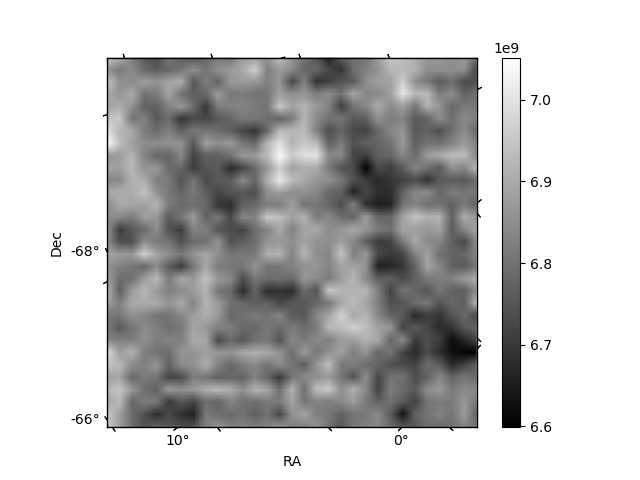
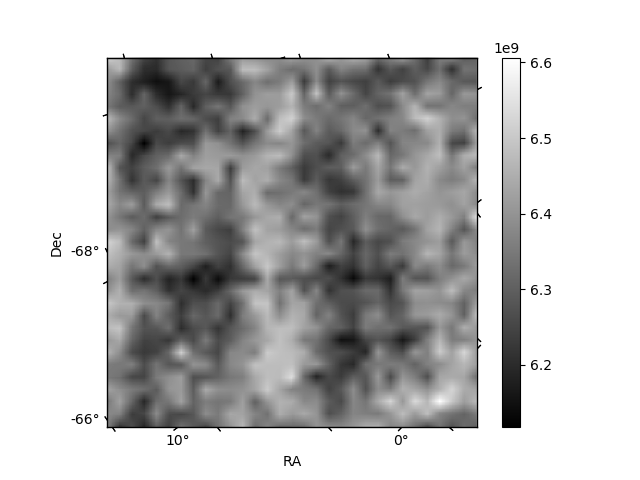
Histogram calculated using DETX and DETY for each event in the final _common_clean file
| Quadrant A |  |
 |
Quadrant B |
|---|---|---|---|
| Quadrant D | 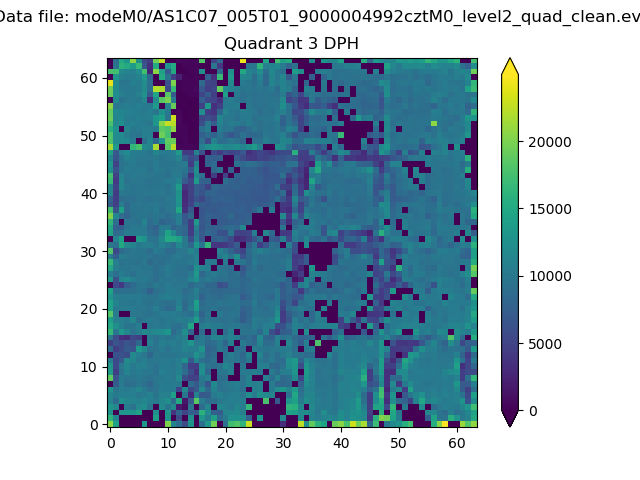 |
 |
Quadrant C |
| Plot type | Count rate plots | Images |
|---|---|---|
| Comparison with Poisson distribution Blue bars denote a histogram of data divided into 1 sec bins. Red curve is a Poisson curve with rate = median count rate of data. |
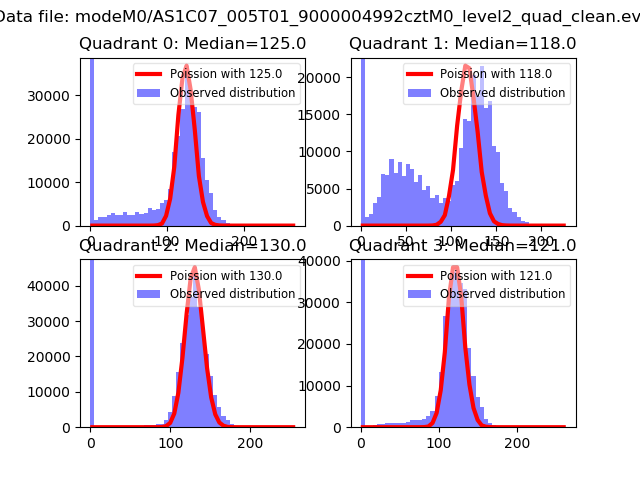 |
 |
| Quadrant-wise count rates Data is divided into 100 sec bins |
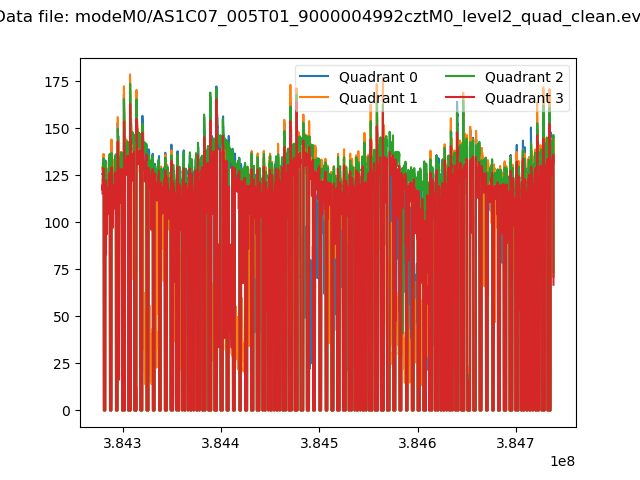 |
|
| Module-wise count rates for Quadrant A Data is divided into 100 sec bins |
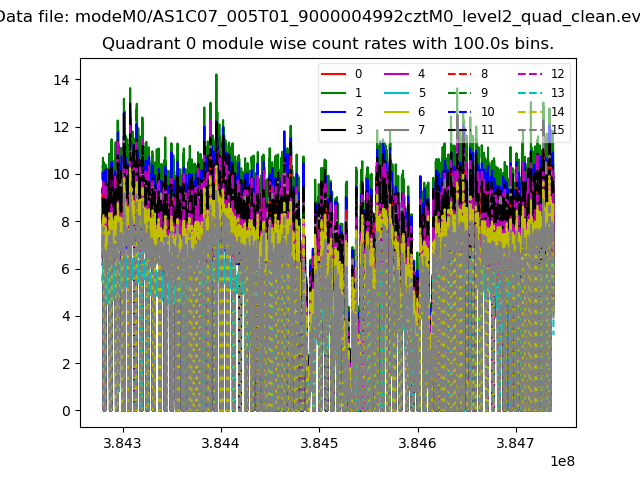 |
 |
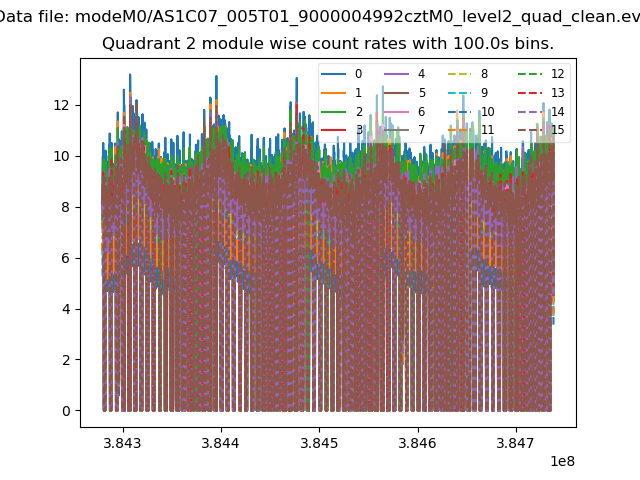
| Module-wise count rates for Quadrant B Data is divided into 100 sec bins |
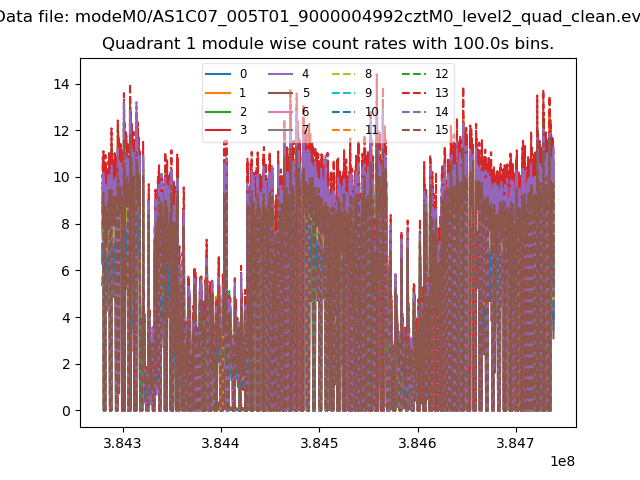 |
 |
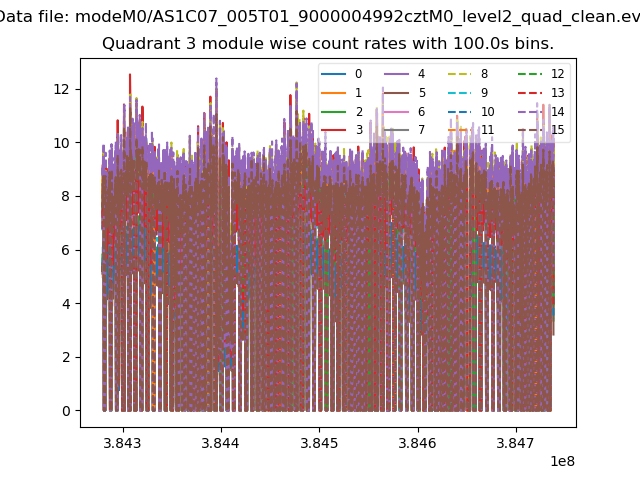
| Module-wise count rates for Quadrant C Data is divided into 100 sec bins |
 |
 |
| Module-wise count rates for Quadrant D Data is divided into 100 sec bins |
 |
 |
| Parameter | Plot |
|---|---|
| CZT HV Monitor | 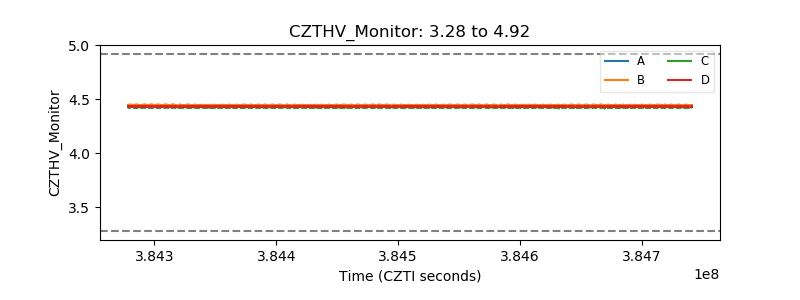 |
| D_VDD | 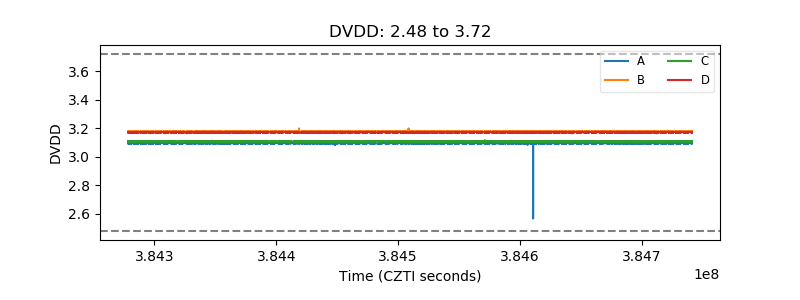 |
| Temperature 1 | 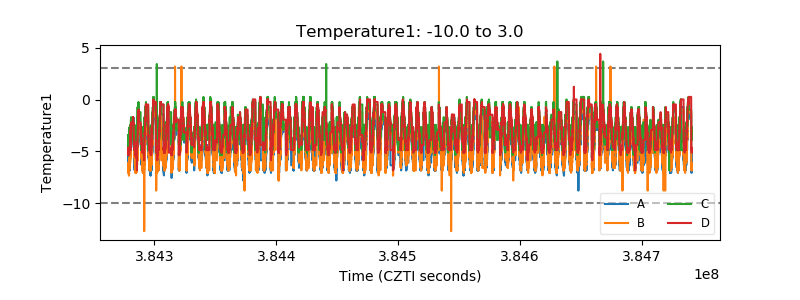 |
| Veto HV Monitor |  |
| Veto LLD | 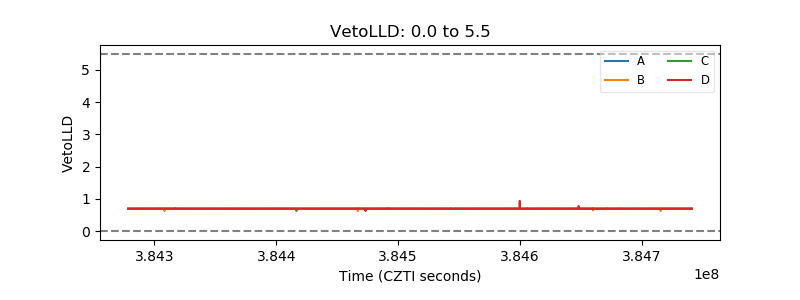 |
| Alpha Counter | 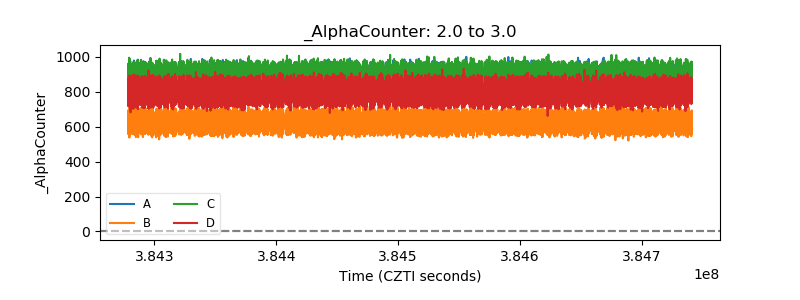 |
| _CPM_Rate | 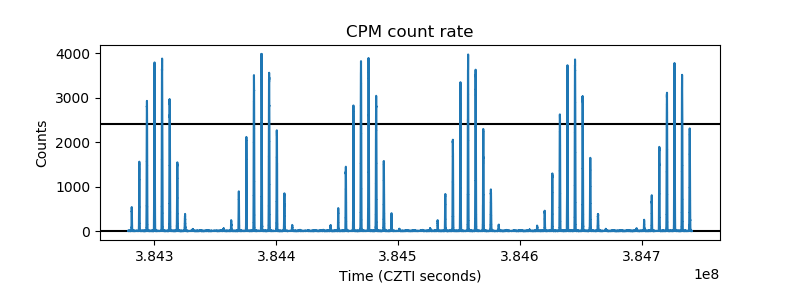 |
| CZT Counter | 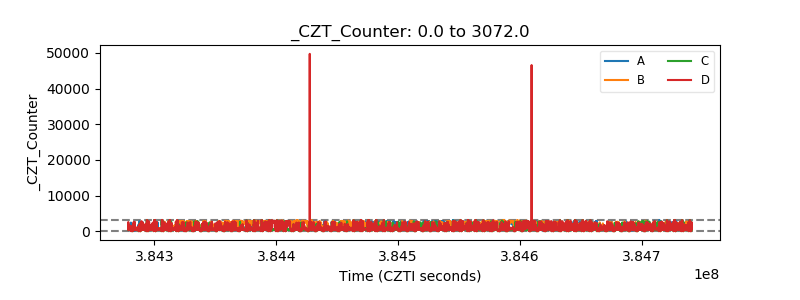 |
| +2.5 Volts monitor | 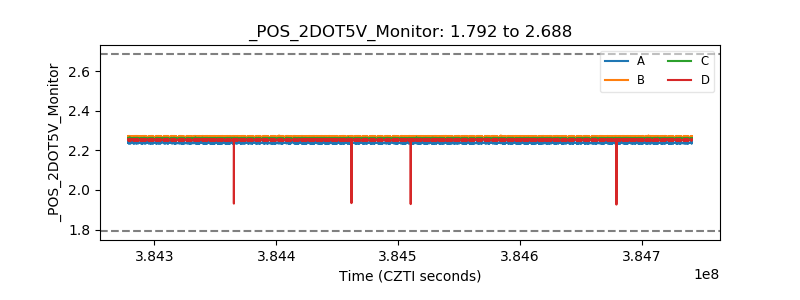 |
| +5 Volts monitor | 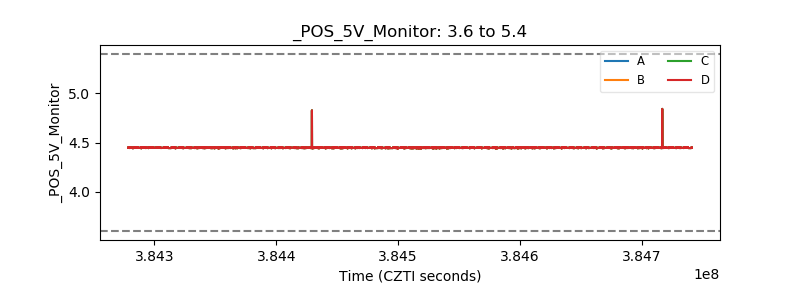 |
| _ROLL_ROT | 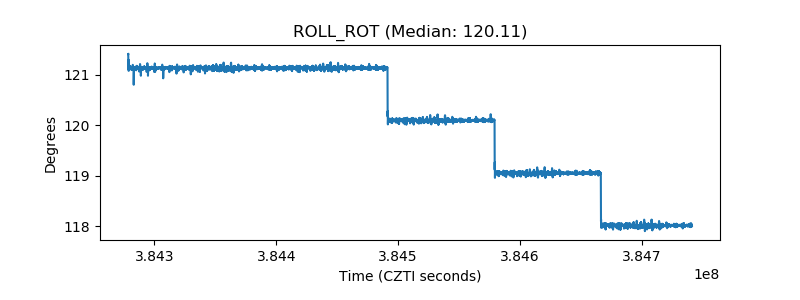 |
| _Roll_DEC | 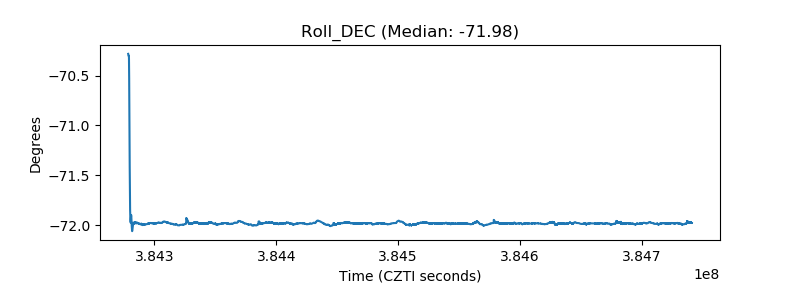 |
| _Roll_RA | 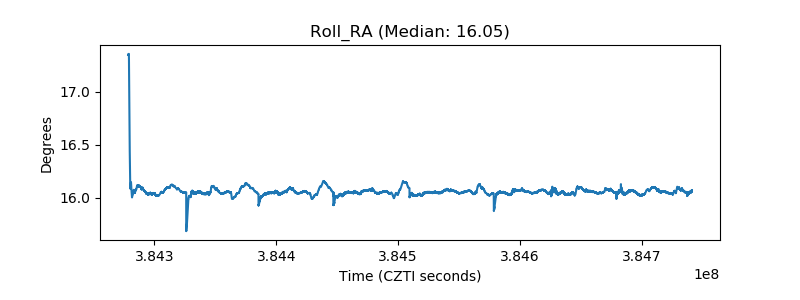 |
| Veto Counter | 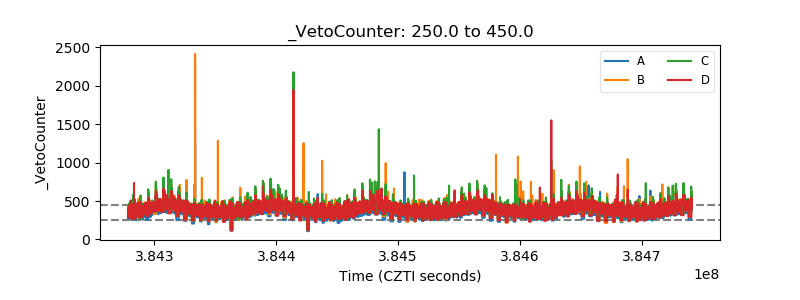 |