| Param | Original file | Final file |
|---|---|---|
| Filename | modeM0/AS1C07_004T01_9000004990_34804cztM0_level2.evt | modeM0/AS1C07_004T01_9000004990_34804cztM0_level2_quad_clean.evt |
| Size (bytes) | 505,765,440 | 94,870,080 |
| Size | 482.3 MB | 90.5 MB |
| Events in quadrant A | 3,146,664 | 606,803 |
| Events in quadrant B | 3,793,538 | 608,453 |
| Events in quadrant C | 3,557,806 | 617,557 |
| Events in quadrant D | 4,367,388 | 575,926 |
| Mode M9 | |||
|---|---|---|---|
| Quadrant | BADHDUFLAG | Total packets | Discarded packets |
| A | 0 | 27 | 0 |
| B | 0 | 27 | 0 |
| C | 0 | 27 | 0 |
| D | 0 | 27 | 0 |
| Mode M0 | |||
|---|---|---|---|
| Quadrant | BADHDUFLAG | Total packets | Discarded packets |
| A | 0 | 13572 | 3 |
| B | 0 | 15431 | 2 |
| C | 0 | 14417 | 2 |
| D | 0 | 17321 | 2 |
| Mode SS | |||
|---|---|---|---|
| Quadrant | BADHDUFLAG | Total packets | Discarded packets |
| A | 0 | 136 | 0 |
| B | 0 | 136 | 0 |
| C | 0 | 136 | 0 |
| D | 0 | 136 | 0 |
| Quadrant | Total seconds | Saturated seconds | Saturation percentage |
|---|---|---|---|
| A | 6662 | 17 | 0.255179% |
| B | 6662 | 172 | 2.581807% |
| C | 6662 | 44 | 0.660462% |
| D | 6662 | 170 | 2.551786% |
Noise dominated data is calculated using 1-second bins in cleaned event files. If a bin has >2000 counts, and if more than 50% of those come from <1% of pixels, then it is considered to be noise-dominated and hence unusable.
| Quadrant | # 1 sec bins | Bins with >0 counts | Bins with >2000 counts | High rate bins dominated by noise | Noise dominated (total time) | Noise dominated (detector-on time) | Marked lightcurve |
|---|---|---|---|---|---|---|---|
| A | 9317 | 6664 | 3 | 3 | 0.03% | 0.05% |  |
| B | 9317 | 6664 | 123 | 123 | 1.32% | 1.85% |  |
| C | 9317 | 6664 | 31 | 31 | 0.33% | 0.47% |  |
| D | 9317 | 6664 | 123 | 123 | 1.32% | 1.85% |  |
Top three noisy pixels from each quadrant. If the there are fewer than three noisy pixels in the level2.evt file, extra rows are filled as -1
| Pixel properties | Quadrant properties | ||||||
|---|---|---|---|---|---|---|---|
| Quadrant | DetID | PixID | Counts | Sigma | Mean | Median | Sigma |
| A | 10 | 83 | 52164 | 326.91 | 781 | 765 | 157.2 |
| A | 15 | 169 | 32075 | 199.14 | 781 | 765 | 157.2 |
| A | 13 | 6 | 16561 | 100.47 | 781 | 765 | 157.2 |
| B | 5 | 172 | 372561 | 2483.52 | 771 | 750 | 149.7 |
| B | 5 | 255 | 291664 | 1943.17 | 771 | 750 | 149.7 |
| B | 4 | 232 | 48259 | 317.33 | 771 | 750 | 149.7 |
| C | 15 | 214 | 306556 | 1720.47 | 763 | 768 | 177.7 |
| C | 0 | 10 | 159729 | 894.37 | 763 | 768 | 177.7 |
| C | 14 | 67 | 94382 | 526.71 | 763 | 768 | 177.7 |
| D | 8 | 195 | 654881 | 3479.21 | 756 | 734 | 188.0 |
| D | 2 | 250 | 265113 | 1406.15 | 756 | 734 | 188.0 |
| D | 2 | 249 | 167250 | 885.65 | 756 | 734 | 188.0 |
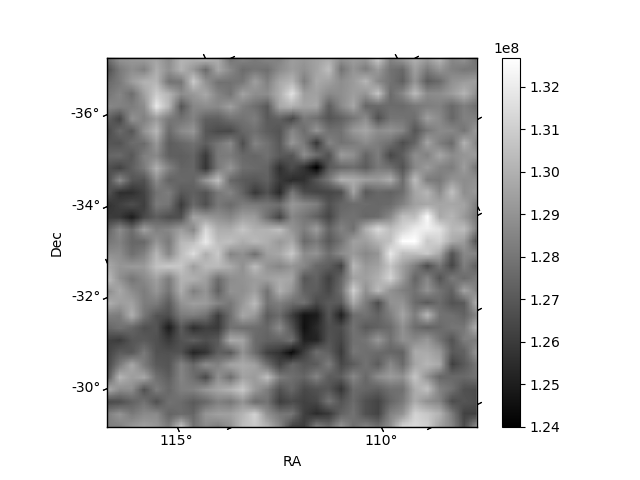
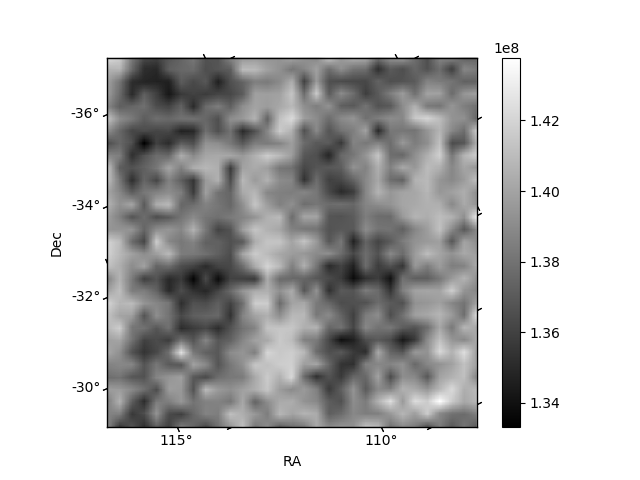
Histogram calculated using DETX and DETY for each event in the final _common_clean file
| Quadrant A | 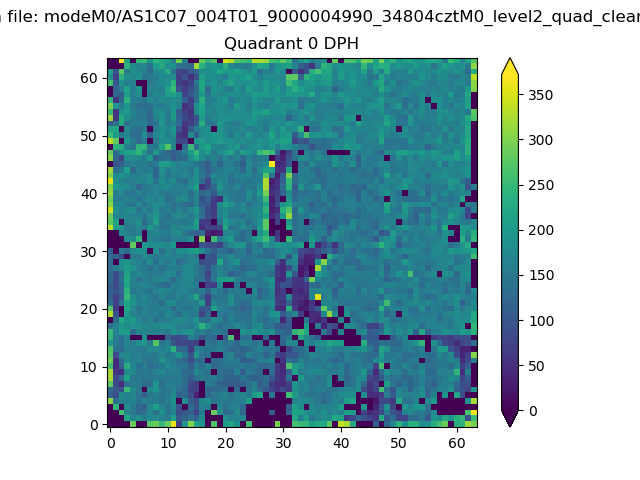 |
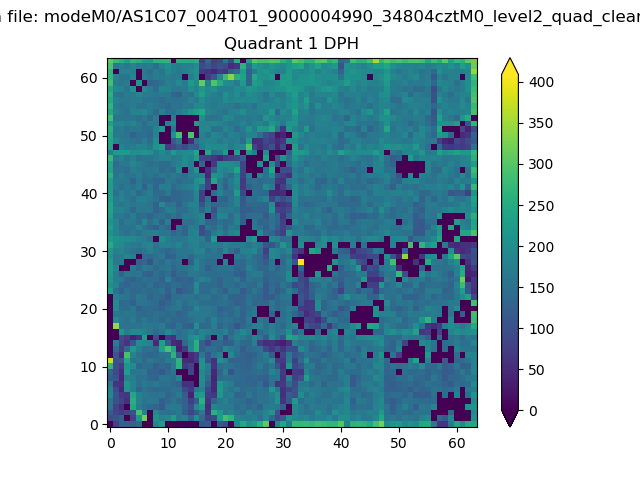 |
Quadrant B |
|---|---|---|---|
| Quadrant D | 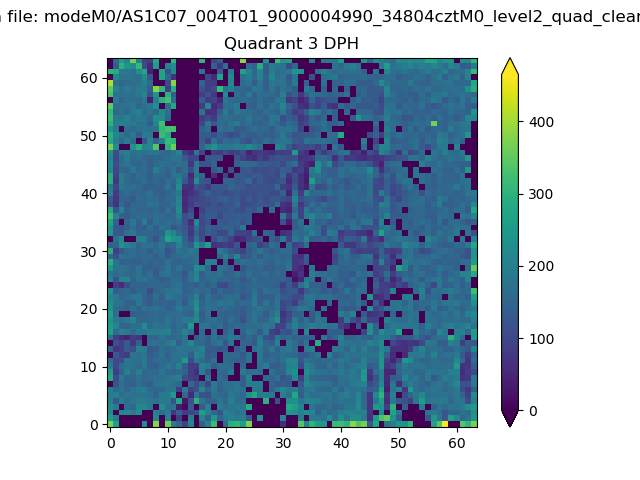 |
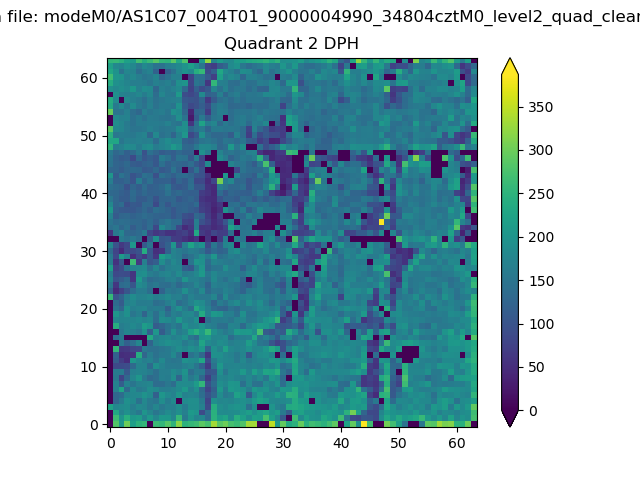 |
Quadrant C |
| Plot type | Count rate plots | Images |
|---|---|---|
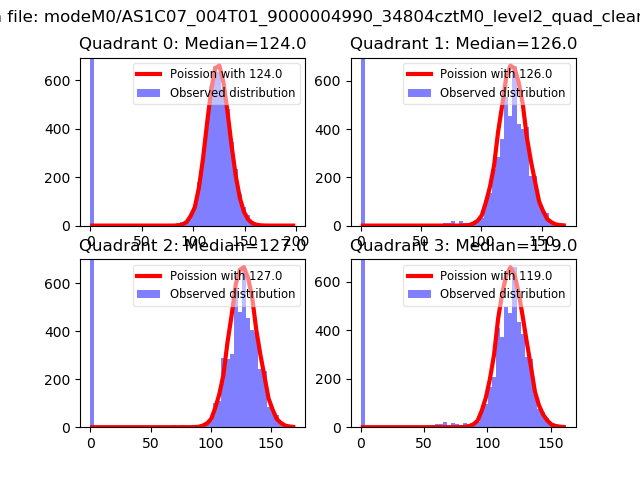
| Comparison with Poisson distribution Blue bars denote a histogram of data divided into 1 sec bins. Red curve is a Poisson curve with rate = median count rate of data. |
 |
 |
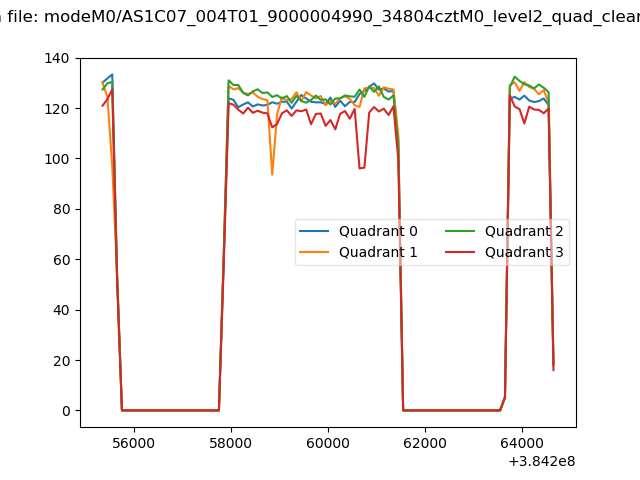
| Quadrant-wise count rates Data is divided into 100 sec bins |
 |
|
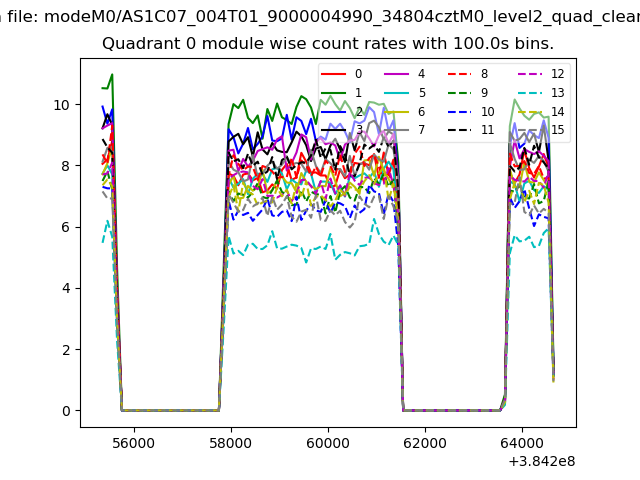
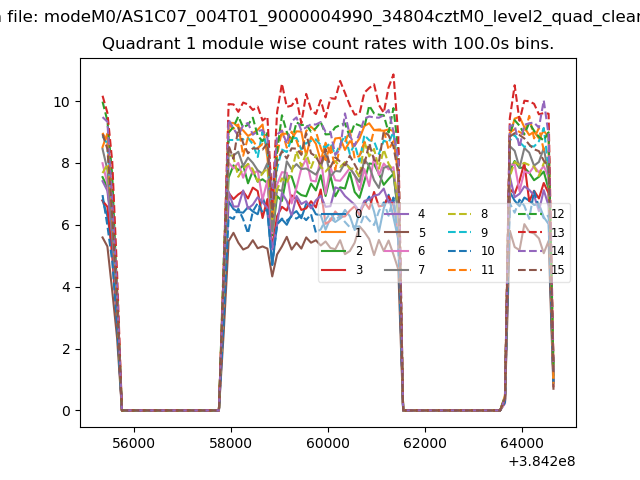
| Module-wise count rates for Quadrant A Data is divided into 100 sec bins |
 |
 |
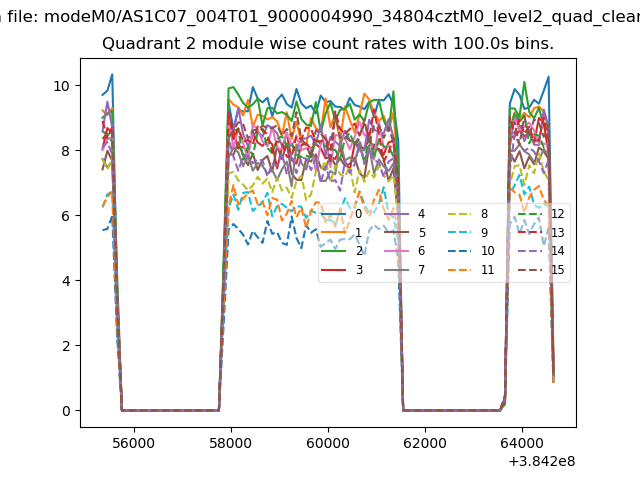
| Module-wise count rates for Quadrant B Data is divided into 100 sec bins |
 |
 |
| Module-wise count rates for Quadrant C Data is divided into 100 sec bins |
 |
 |
| Module-wise count rates for Quadrant D Data is divided into 100 sec bins |
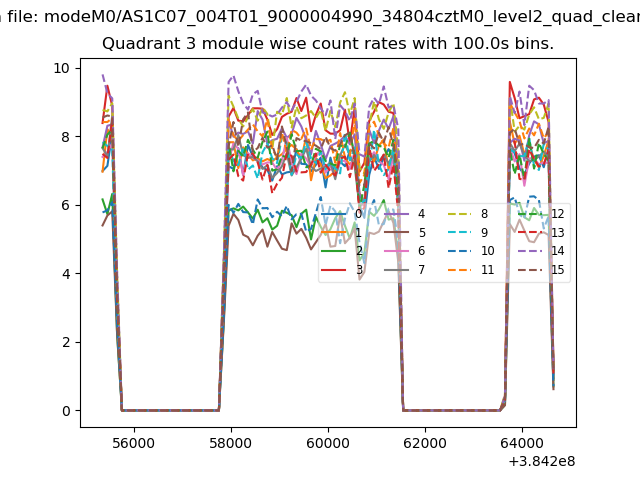 |
 |
| Parameter | Plot |
|---|---|
| CZT HV Monitor | 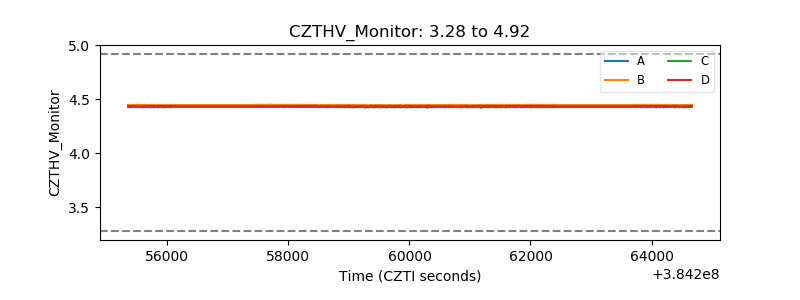 |
| D_VDD | 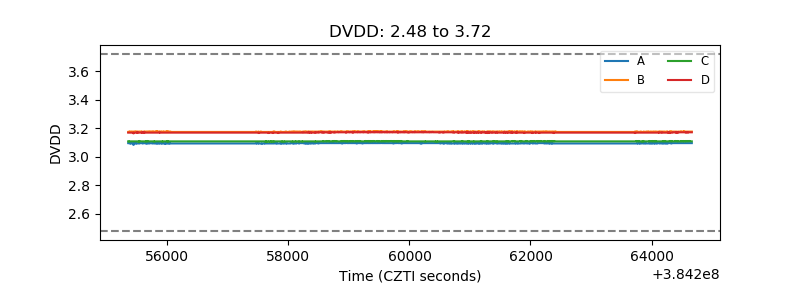 |
| Temperature 1 | 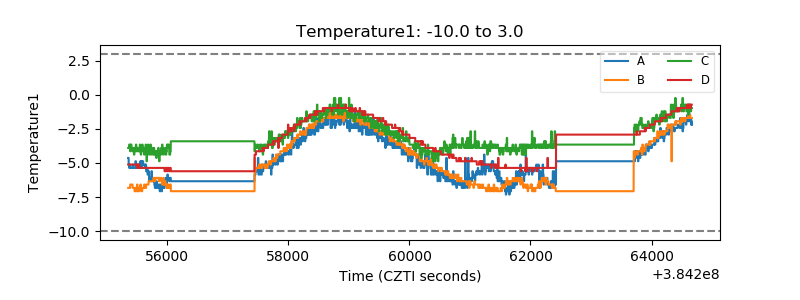 |
| Veto HV Monitor | 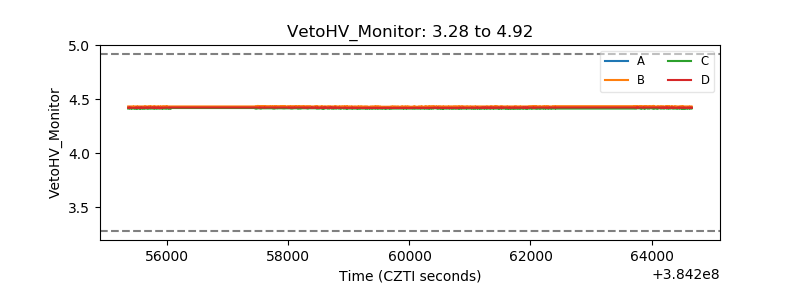 |
| Veto LLD | 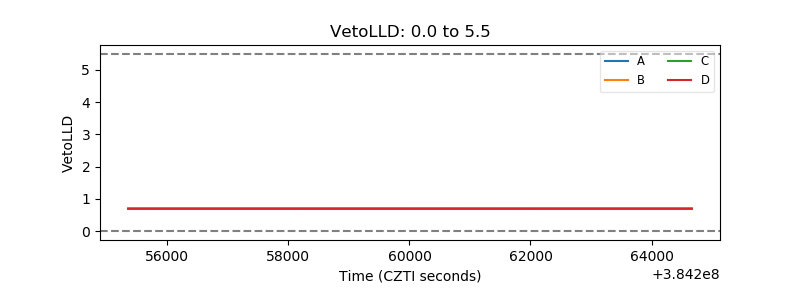 |
| Alpha Counter | 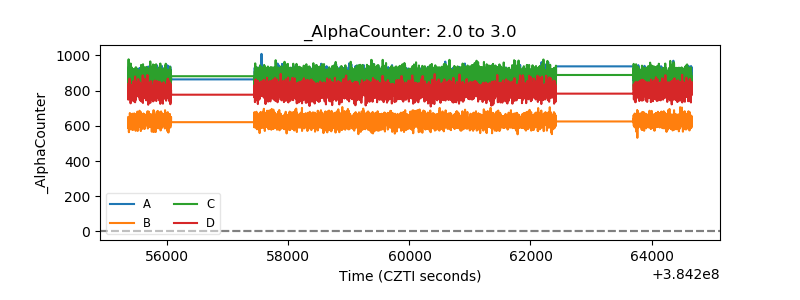 |
| _CPM_Rate | 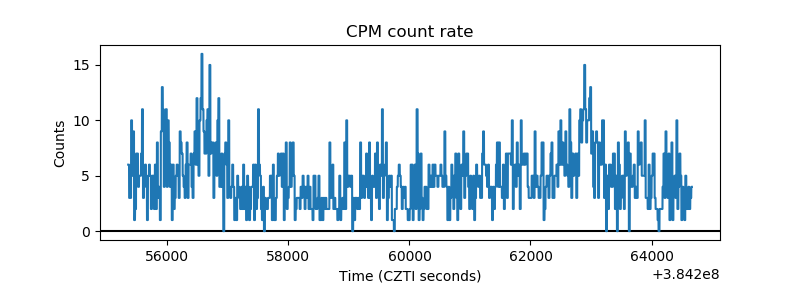 |
| CZT Counter | 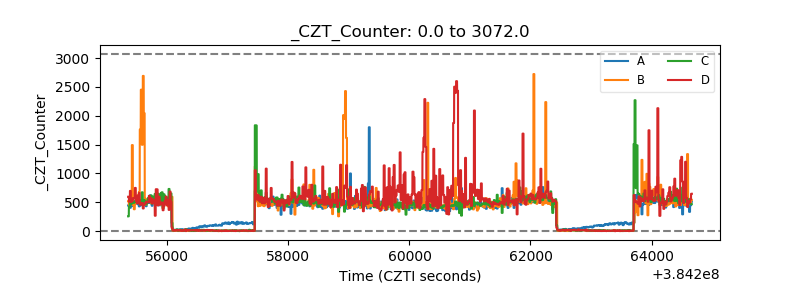 |
| +2.5 Volts monitor | 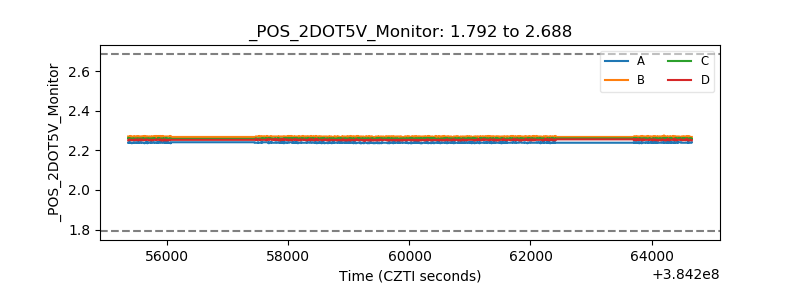 |
| +5 Volts monitor | 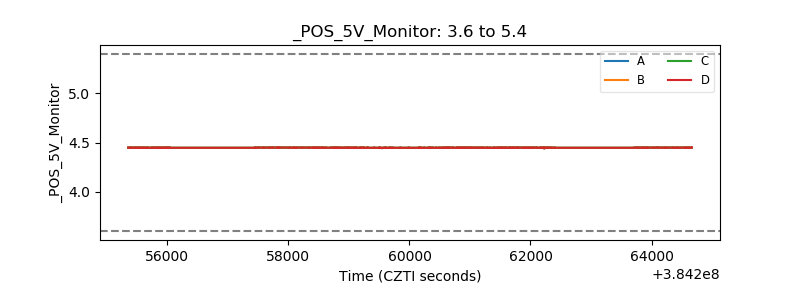 |
| _ROLL_ROT | 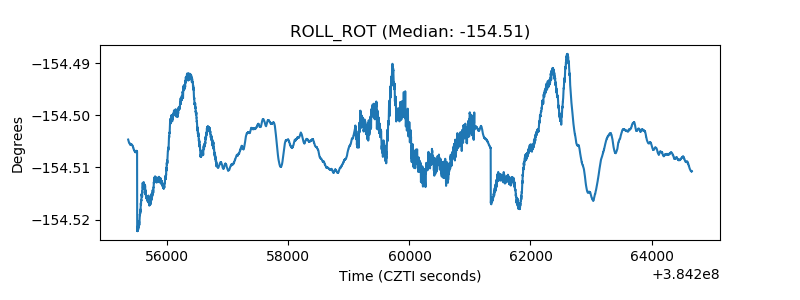 |
| _Roll_DEC | 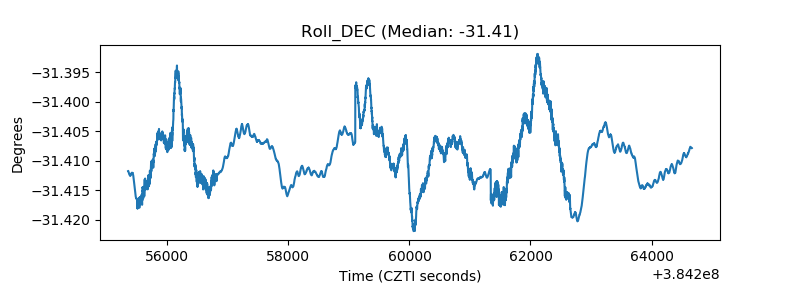 |
| _Roll_RA | 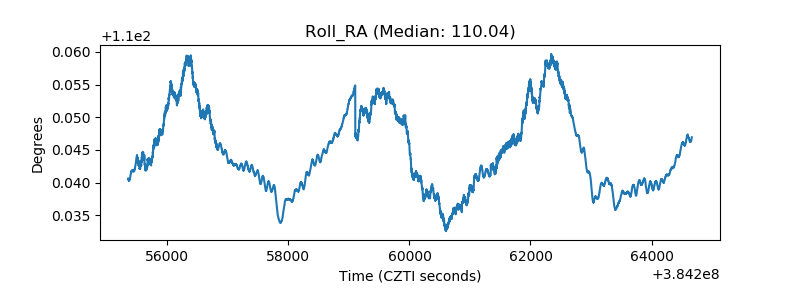 |
| Veto Counter | 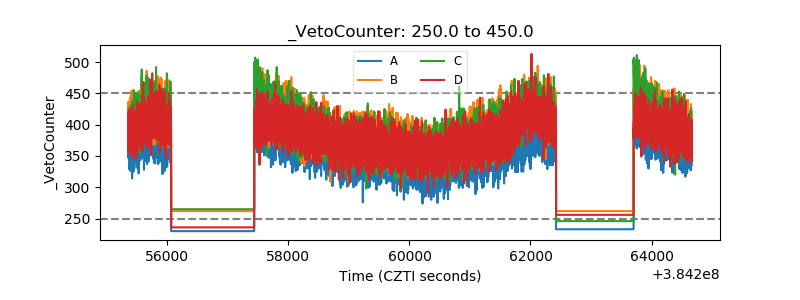 |