| Param | Original file | Final file |
|---|---|---|
| Filename | modeM0/AS1C07_004T01_9000004990_34802cztM0_level2.evt | modeM0/AS1C07_004T01_9000004990_34802cztM0_level2_quad_clean.evt |
| Size (bytes) | 440,827,200 | 67,032,000 |
| Size | 420.4 MB | 63.9 MB |
| Events in quadrant A | 2,505,241 | 422,235 |
| Events in quadrant B | 3,209,307 | 428,226 |
| Events in quadrant C | 2,788,888 | 432,714 |
| Events in quadrant D | 4,484,413 | 372,475 |
| Mode M9 | |||
|---|---|---|---|
| Quadrant | BADHDUFLAG | Total packets | Discarded packets |
| A | 0 | 37 | 0 |
| B | 0 | 37 | 0 |
| C | 0 | 37 | 0 |
| D | 0 | 37 | 0 |
| Mode M0 | |||
|---|---|---|---|
| Quadrant | BADHDUFLAG | Total packets | Discarded packets |
| A | 0 | 10819 | 3 |
| B | 0 | 12872 | 2 |
| C | 0 | 11210 | 2 |
| D | 0 | 16779 | 2 |
| Mode SS | |||
|---|---|---|---|
| Quadrant | BADHDUFLAG | Total packets | Discarded packets |
| A | 0 | 112 | 0 |
| B | 0 | 112 | 0 |
| C | 0 | 112 | 0 |
| D | 0 | 112 | 0 |
| Quadrant | Total seconds | Saturated seconds | Saturation percentage |
|---|---|---|---|
| A | 5333 | 8 | 0.150009% |
| B | 5333 | 185 | 3.468967% |
| C | 5333 | 37 | 0.693793% |
| D | 5333 | 416 | 7.800488% |
Noise dominated data is calculated using 1-second bins in cleaned event files. If a bin has >2000 counts, and if more than 50% of those come from <1% of pixels, then it is considered to be noise-dominated and hence unusable.
| Quadrant | # 1 sec bins | Bins with >0 counts | Bins with >2000 counts | High rate bins dominated by noise | Noise dominated (total time) | Noise dominated (detector-on time) | Marked lightcurve |
|---|---|---|---|---|---|---|---|
| A | 9038 | 5335 | 1 | 1 | 0.01% | 0.02% | 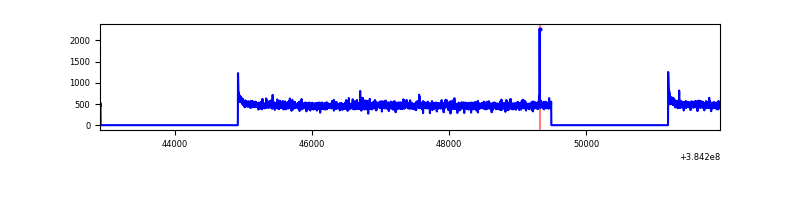 |
| B | 9038 | 5335 | 115 | 115 | 1.27% | 2.16% | 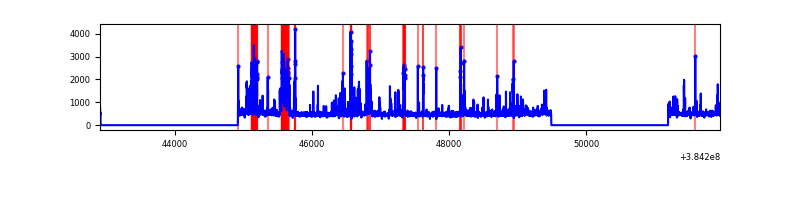 |
| C | 9038 | 5335 | 23 | 23 | 0.25% | 0.43% | 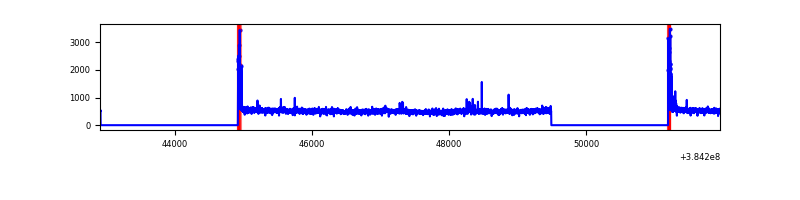 |
| D | 9038 | 5335 | 401 | 401 | 4.44% | 7.52% | 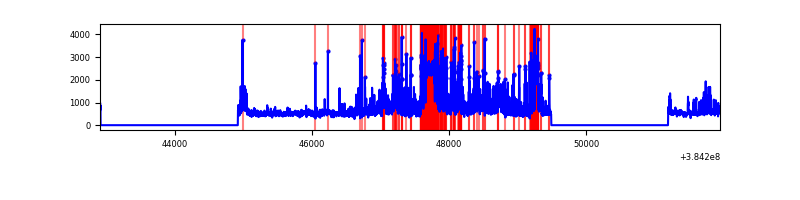 |
Top three noisy pixels from each quadrant. If the there are fewer than three noisy pixels in the level2.evt file, extra rows are filled as -1
| Pixel properties | Quadrant properties | ||||||
|---|---|---|---|---|---|---|---|
| Quadrant | DetID | PixID | Counts | Sigma | Mean | Median | Sigma |
| A | 10 | 83 | 49344 | 386.25 | 626 | 615 | 126.2 |
| A | 15 | 169 | 12885 | 97.26 | 626 | 615 | 126.2 |
| A | 13 | 6 | 12300 | 92.62 | 626 | 615 | 126.2 |
| B | 5 | 172 | 405228 | 3352.37 | 620 | 602 | 120.7 |
| B | 5 | 255 | 157876 | 1303.03 | 620 | 602 | 120.7 |
| B | 4 | 171 | 111833 | 921.56 | 620 | 602 | 120.7 |
| C | 15 | 214 | 228374 | 1608.58 | 613 | 618 | 141.6 |
| C | 0 | 10 | 111584 | 783.72 | 613 | 618 | 141.6 |
| C | 14 | 67 | 28842 | 199.34 | 613 | 618 | 141.6 |
| D | 12 | 233 | 752381 | 5215.46 | 585 | 567 | 144.2 |
| D | 2 | 249 | 558856 | 3872.94 | 585 | 567 | 144.2 |
| D | 8 | 195 | 483388 | 3349.41 | 585 | 567 | 144.2 |
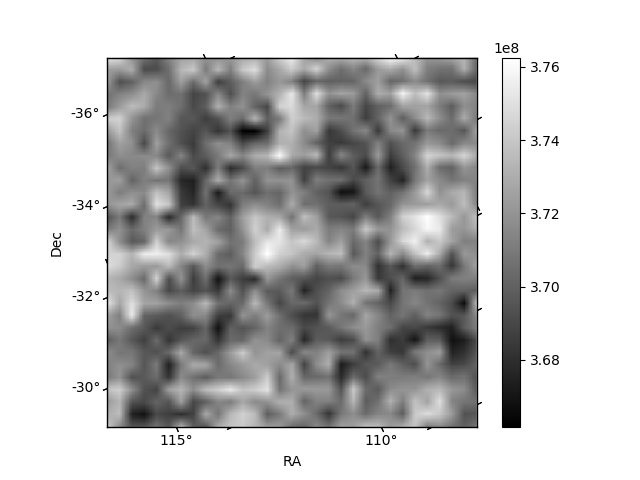
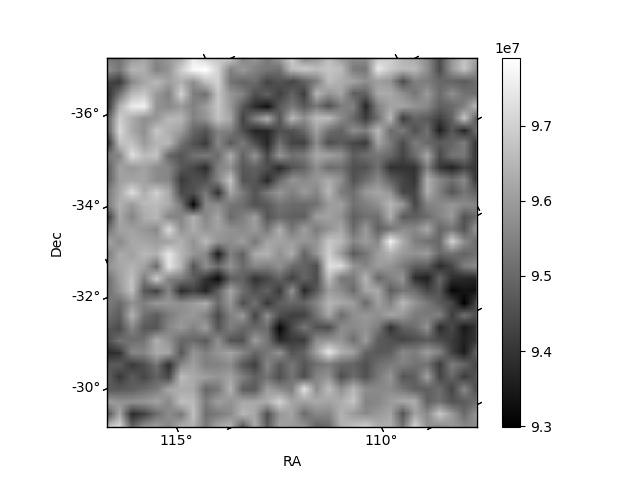
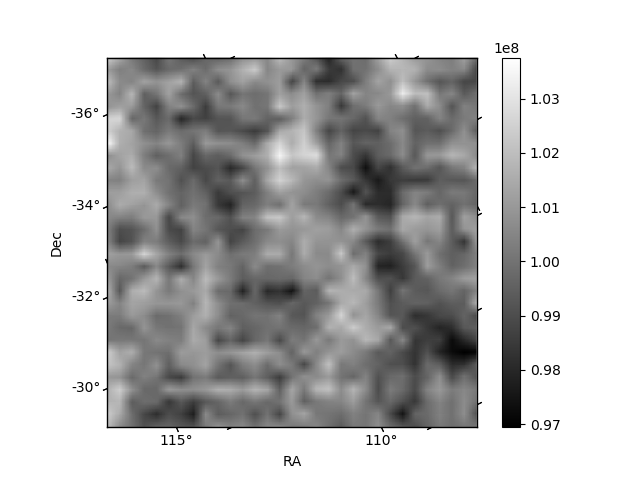
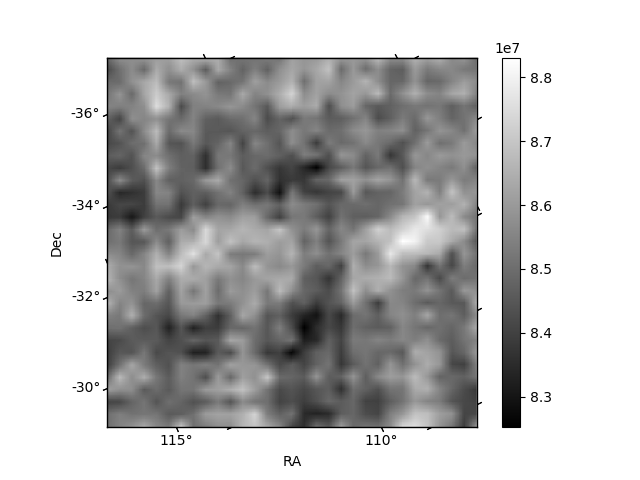
Histogram calculated using DETX and DETY for each event in the final _common_clean file
| Quadrant A | 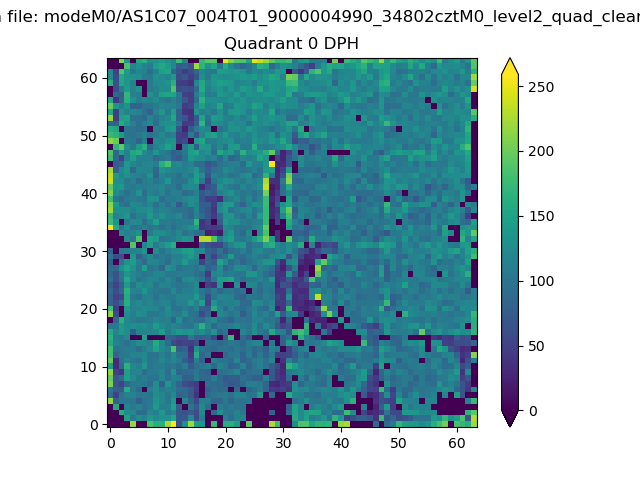 |
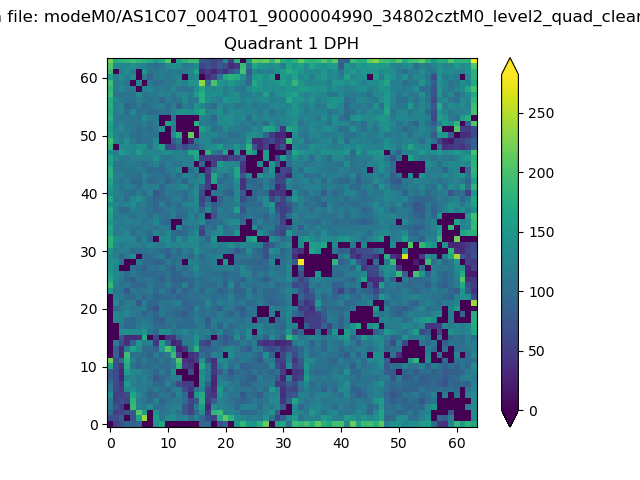 |
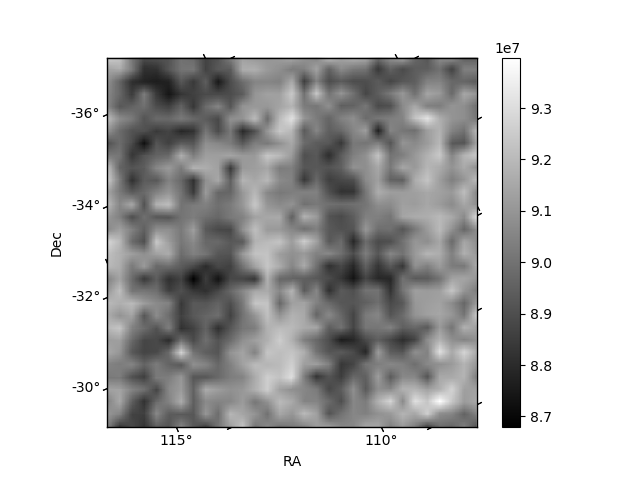
Quadrant B |
|---|---|---|---|
| Quadrant D | 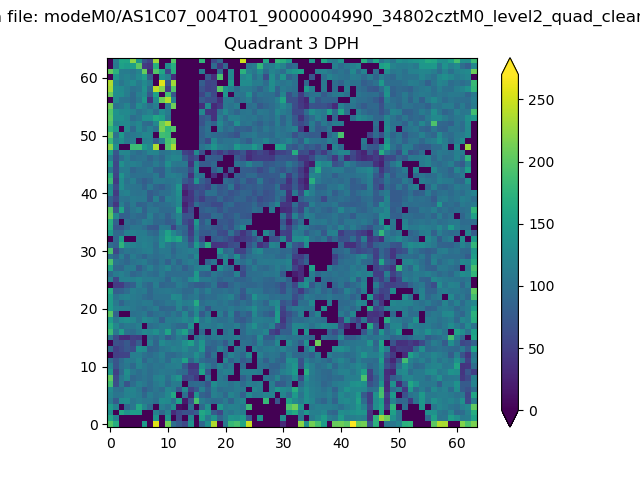 |
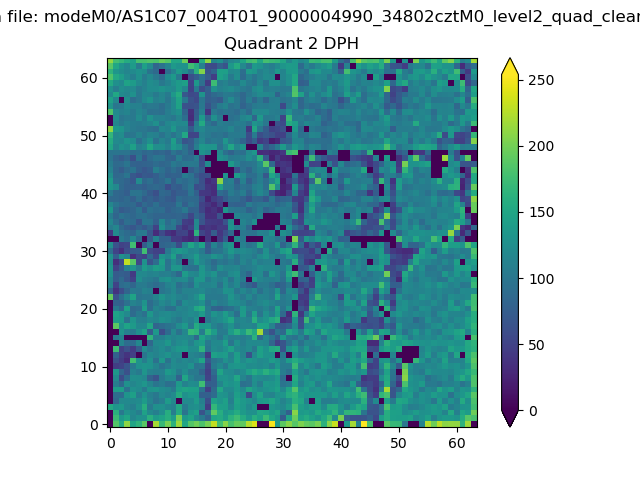 |
Quadrant C |
| Plot type | Count rate plots | Images |
|---|---|---|
| Comparison with Poisson distribution Blue bars denote a histogram of data divided into 1 sec bins. Red curve is a Poisson curve with rate = median count rate of data. |
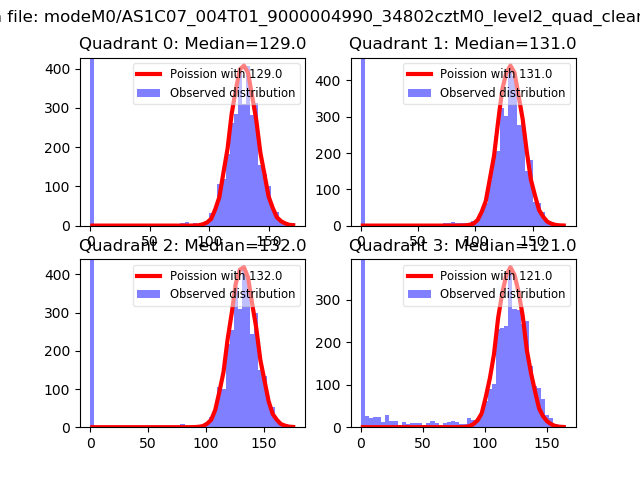 |
 |
| Quadrant-wise count rates Data is divided into 100 sec bins |
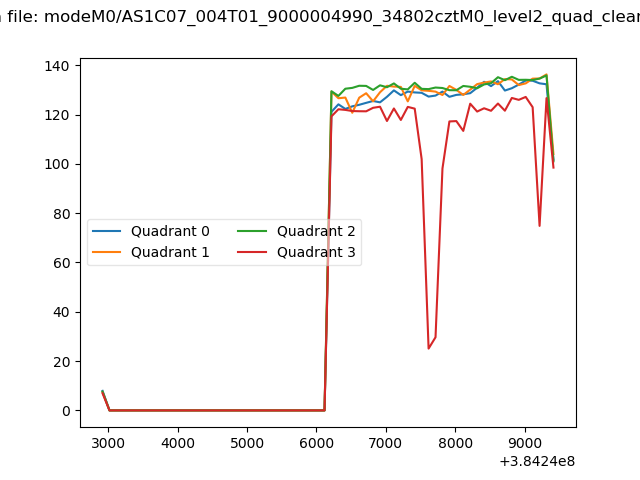 |
|
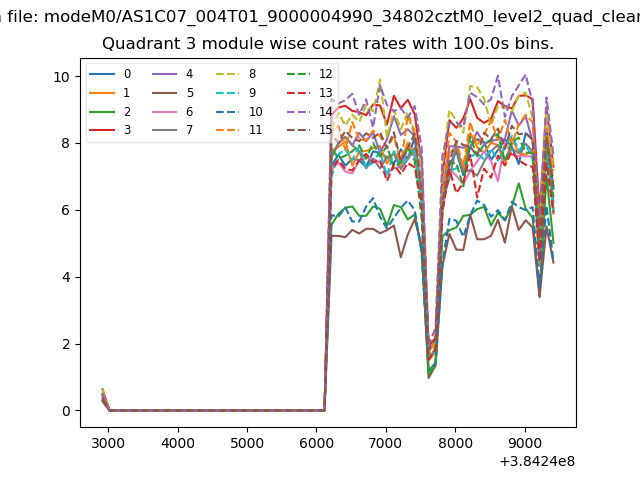
| Module-wise count rates for Quadrant A Data is divided into 100 sec bins |
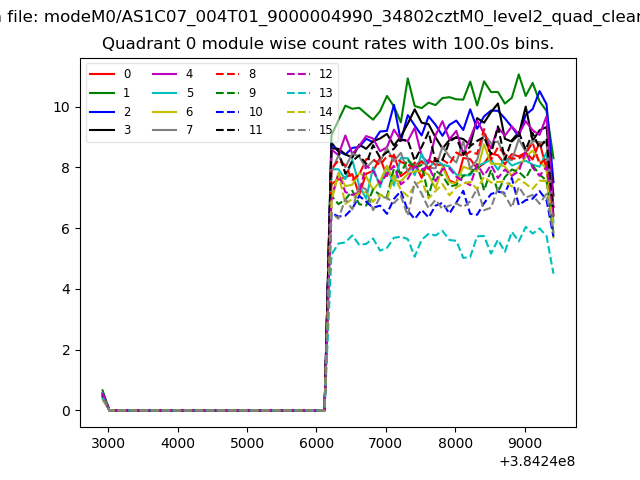 |
 |
| Module-wise count rates for Quadrant B Data is divided into 100 sec bins |
 |
 |
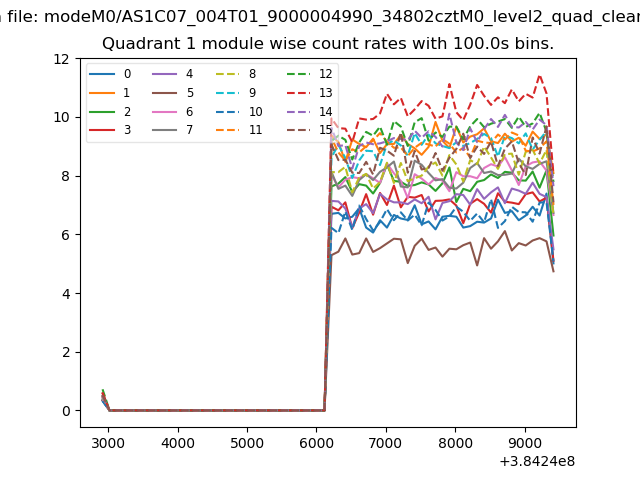
| Module-wise count rates for Quadrant C Data is divided into 100 sec bins |
 |
 |
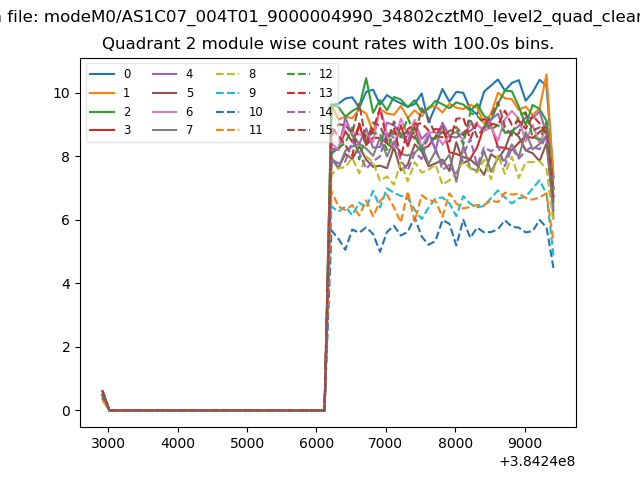
| Module-wise count rates for Quadrant D Data is divided into 100 sec bins |
 |
 |
| Parameter | Plot |
|---|---|
| CZT HV Monitor | 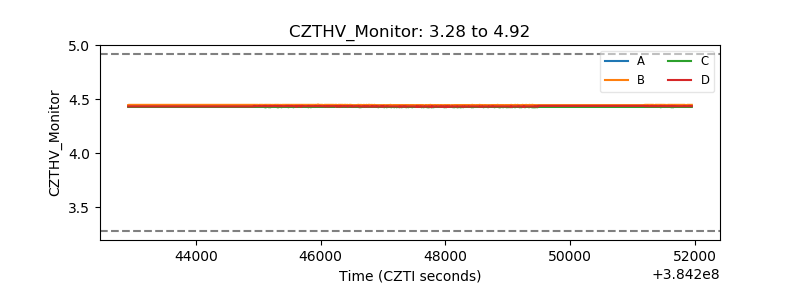 |
| D_VDD | 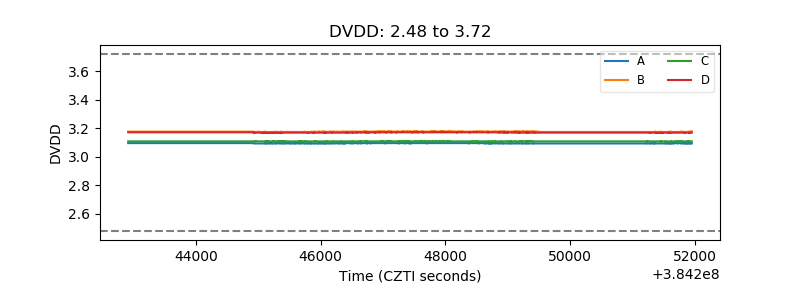 |
| Temperature 1 | 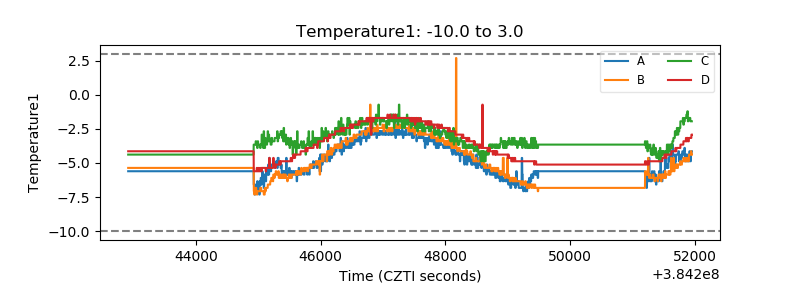 |
| Veto HV Monitor | 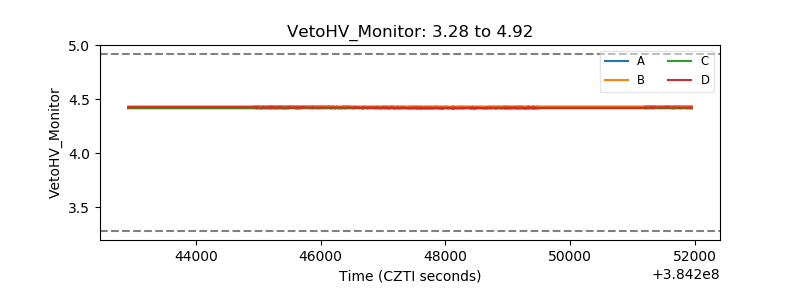 |
| Veto LLD | 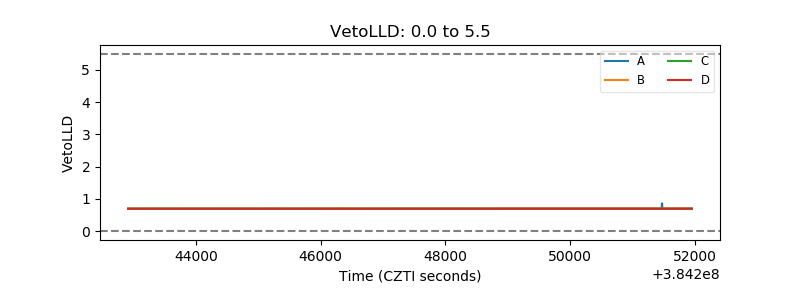 |
| Alpha Counter | 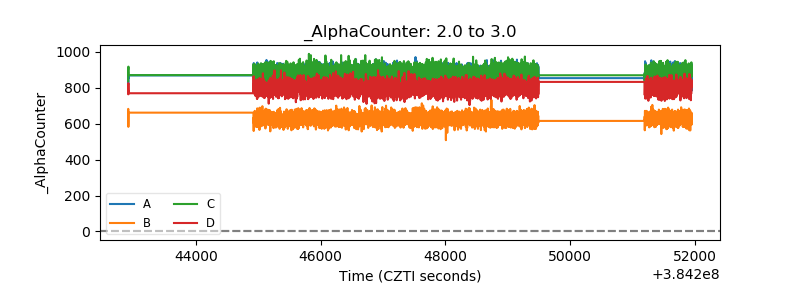 |
| _CPM_Rate | 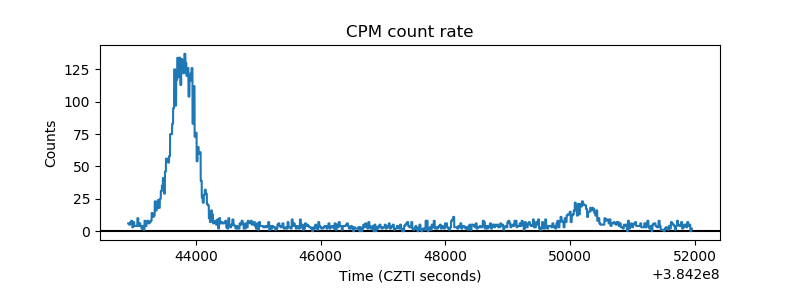 |
| CZT Counter | 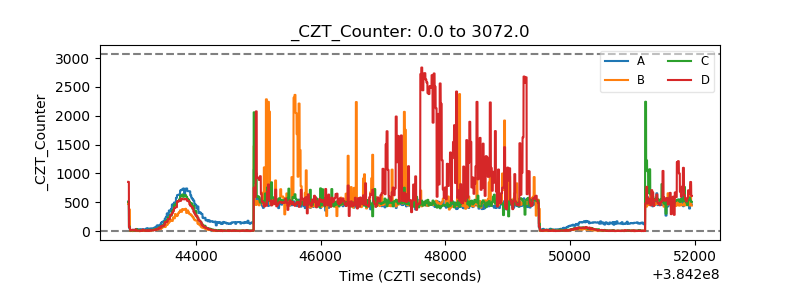 |
| +2.5 Volts monitor | 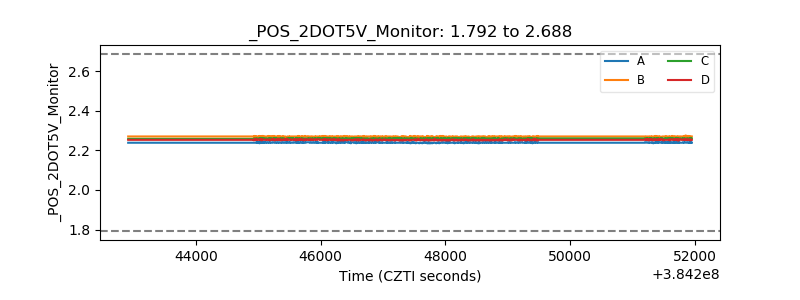 |
| +5 Volts monitor | 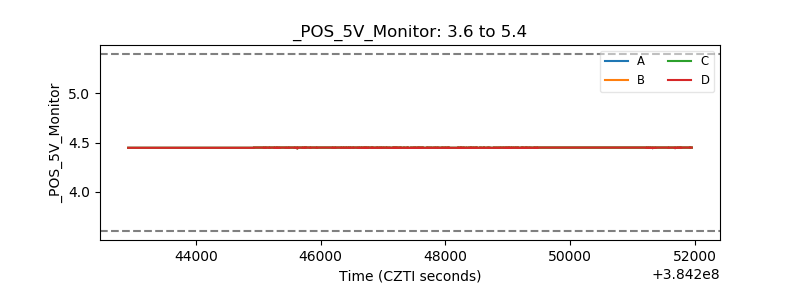 |
| _ROLL_ROT | 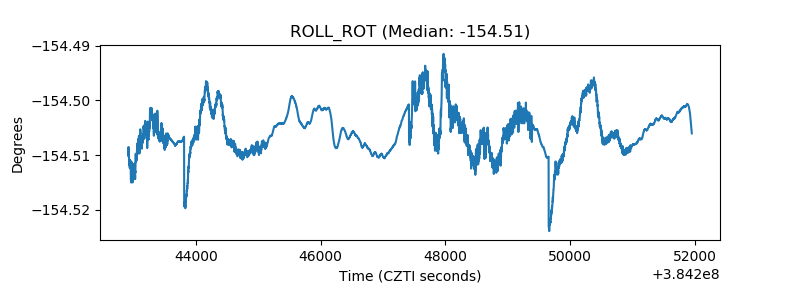 |
| _Roll_DEC | 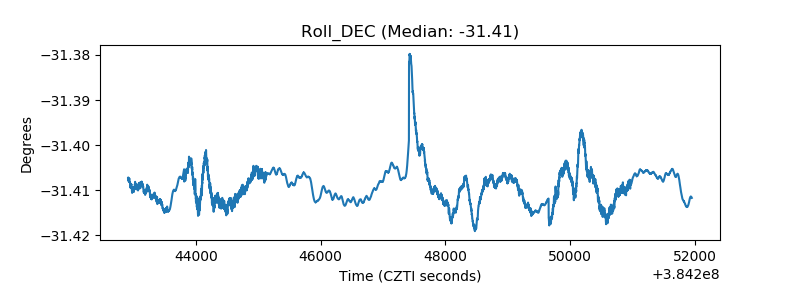 |
| _Roll_RA | 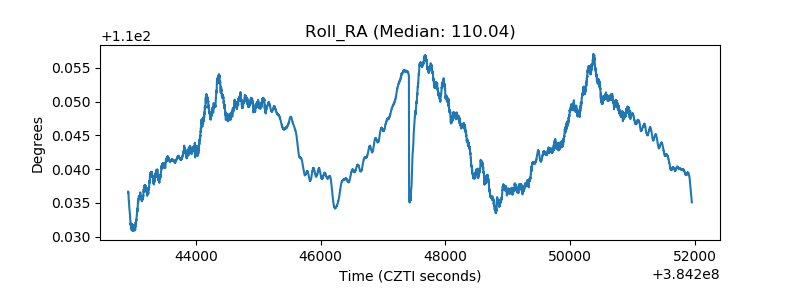 |
| Veto Counter | 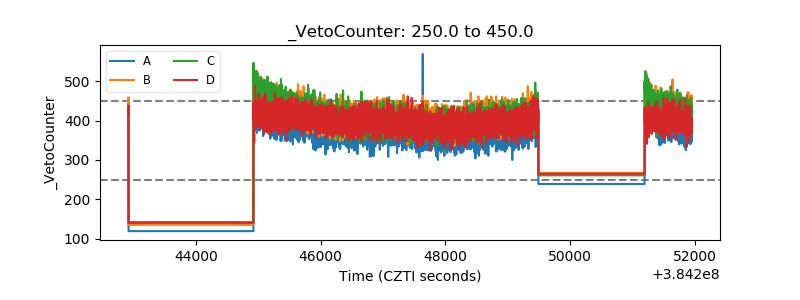 |