| Param | Original file | Final file |
|---|---|---|
| Filename | modeM0/AS1C07_004T01_9000004990_34799cztM0_level2.evt | modeM0/AS1C07_004T01_9000004990_34799cztM0_level2_quad_clean.evt |
| Size (bytes) | 450,123,840 | 47,376,000 |
| Size | 429.3 MB | 45.2 MB |
| Events in quadrant A | 2,553,110 | 275,676 |
| Events in quadrant B | 4,105,597 | 266,915 |
| Events in quadrant C | 2,952,086 | 283,367 |
| Events in quadrant D | 3,682,745 | 258,227 |
| Mode M9 | |||
|---|---|---|---|
| Quadrant | BADHDUFLAG | Total packets | Discarded packets |
| A | 0 | 31 | 0 |
| B | 0 | 31 | 0 |
| C | 0 | 31 | 0 |
| D | 0 | 32 | 0 |
| Mode M0 | |||
|---|---|---|---|
| Quadrant | BADHDUFLAG | Total packets | Discarded packets |
| A | 0 | 10363 | 3 |
| B | 0 | 15451 | 2 |
| C | 0 | 11439 | 2 |
| D | 0 | 14295 | 2 |
| Mode SS | |||
|---|---|---|---|
| Quadrant | BADHDUFLAG | Total packets | Discarded packets |
| A | 0 | 104 | 0 |
| B | 0 | 104 | 0 |
| C | 0 | 104 | 0 |
| D | 0 | 104 | 0 |
| Quadrant | Total seconds | Saturated seconds | Saturation percentage |
|---|---|---|---|
| A | 4980 | 12 | 0.240964% |
| B | 4980 | 474 | 9.518072% |
| C | 4980 | 64 | 1.285141% |
| D | 4980 | 182 | 3.654618% |
Noise dominated data is calculated using 1-second bins in cleaned event files. If a bin has >2000 counts, and if more than 50% of those come from <1% of pixels, then it is considered to be noise-dominated and hence unusable.
| Quadrant | # 1 sec bins | Bins with >0 counts | Bins with >2000 counts | High rate bins dominated by noise | Noise dominated (total time) | Noise dominated (detector-on time) | Marked lightcurve |
|---|---|---|---|---|---|---|---|
| A | 7134 | 4981 | 3 | 3 | 0.04% | 0.06% | 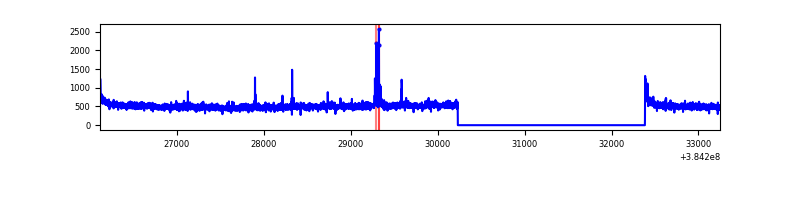 |
| B | 7134 | 4981 | 321 | 321 | 4.50% | 6.44% | 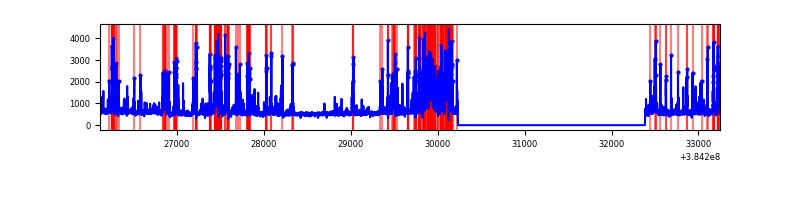 |
| C | 7134 | 4981 | 47 | 47 | 0.66% | 0.94% | 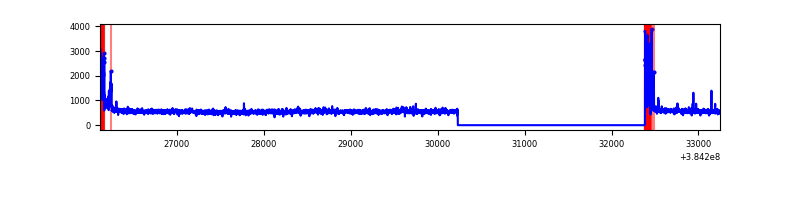 |
| D | 7134 | 4981 | 165 | 165 | 2.31% | 3.31% | 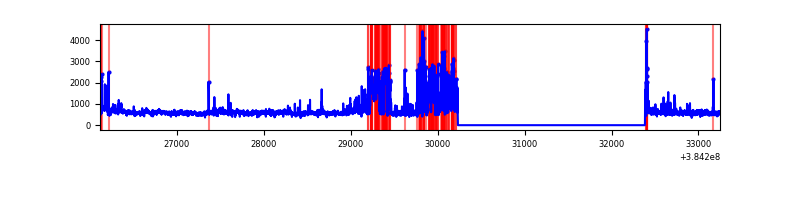 |
Top three noisy pixels from each quadrant. If the there are fewer than three noisy pixels in the level2.evt file, extra rows are filled as -1
| Pixel properties | Quadrant properties | ||||||
|---|---|---|---|---|---|---|---|
| Quadrant | DetID | PixID | Counts | Sigma | Mean | Median | Sigma |
| A | 10 | 83 | 48283 | 374.2 | 634 | 623 | 127.4 |
| A | 15 | 169 | 29913 | 229.97 | 634 | 623 | 127.4 |
| A | 13 | 6 | 11769 | 87.51 | 634 | 623 | 127.4 |
| B | 5 | 172 | 798751 | 6823.9 | 617 | 602 | 117.0 |
| B | 5 | 255 | 574023 | 4902.55 | 617 | 602 | 117.0 |
| B | 0 | 190 | 147986 | 1260.08 | 617 | 602 | 117.0 |
| C | 0 | 10 | 227442 | 1547.5 | 631 | 636 | 146.6 |
| C | 15 | 214 | 215999 | 1469.43 | 631 | 636 | 146.6 |
| C | 14 | 67 | 50347 | 339.18 | 631 | 636 | 146.6 |
| D | 8 | 195 | 738862 | 4976.28 | 615 | 600 | 148.4 |
| D | 7 | 223 | 219381 | 1474.7 | 615 | 600 | 148.4 |
| D | 13 | 249 | 131310 | 881.05 | 615 | 600 | 148.4 |
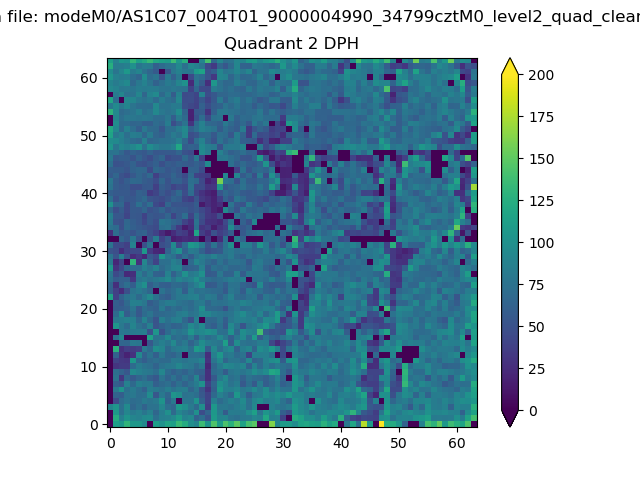
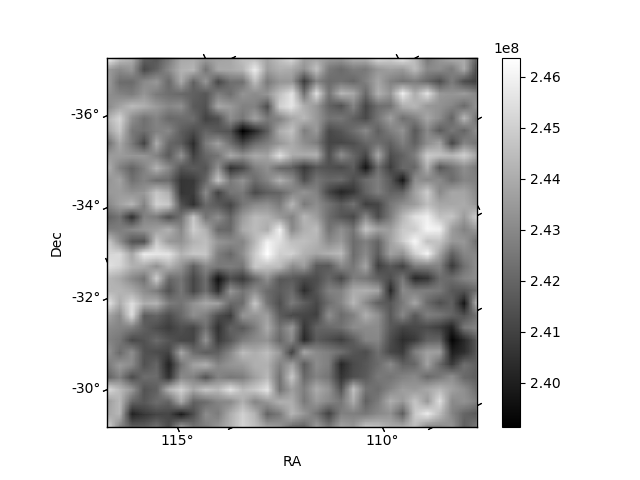
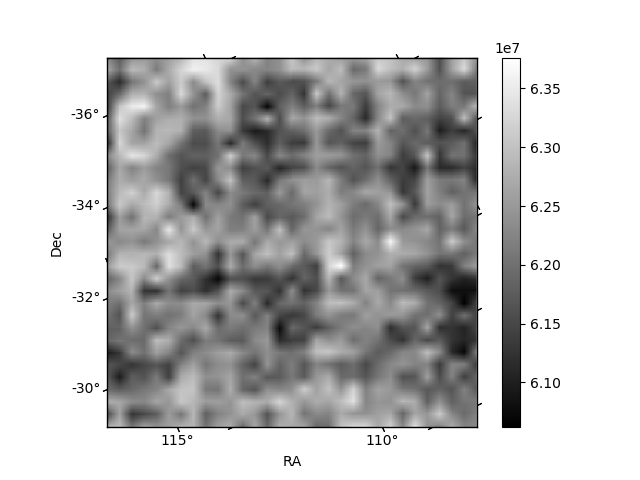
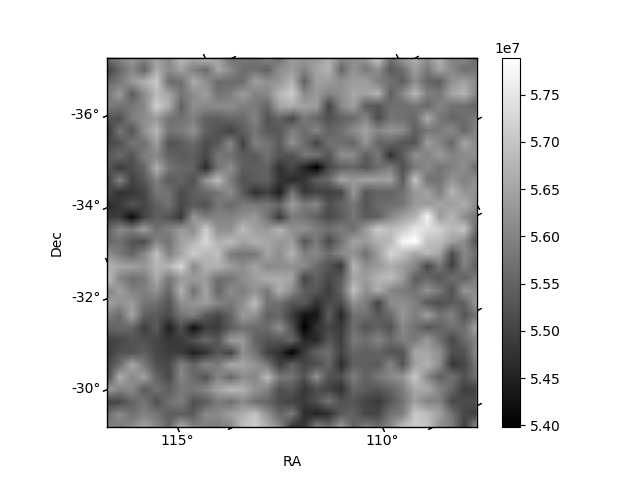
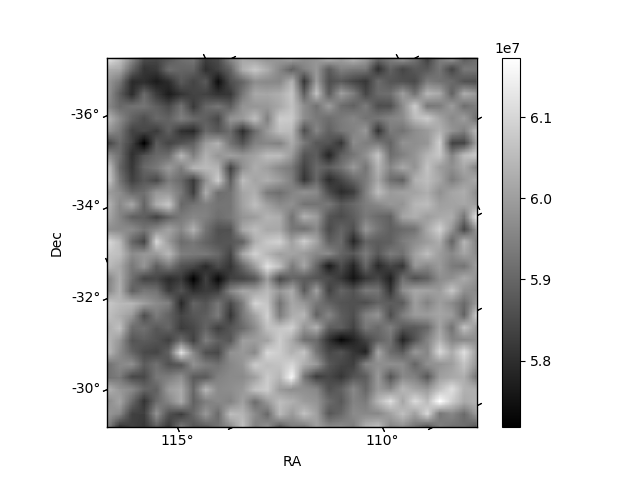
Histogram calculated using DETX and DETY for each event in the final _common_clean file
| Quadrant A | 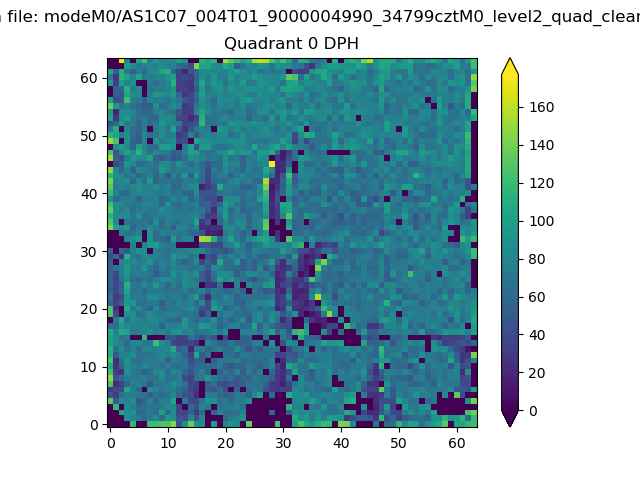 |
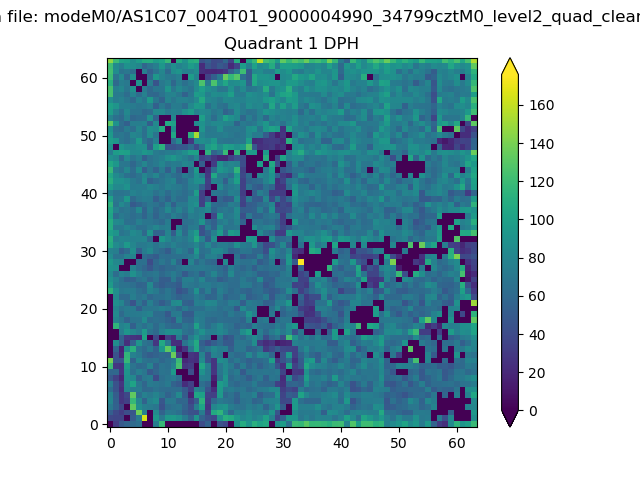 |
Quadrant B |
|---|---|---|---|
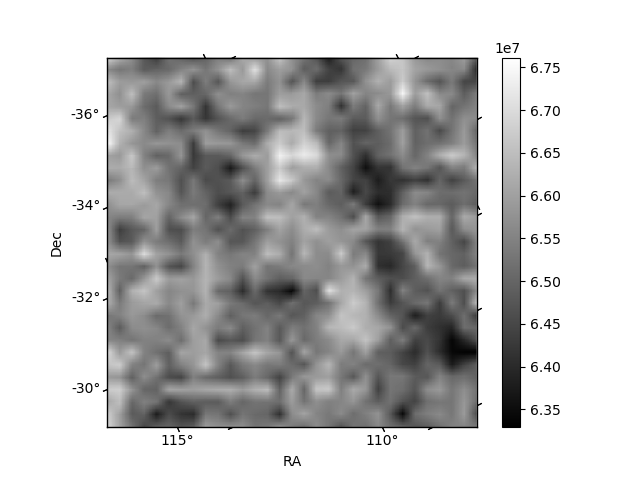
| Quadrant D | 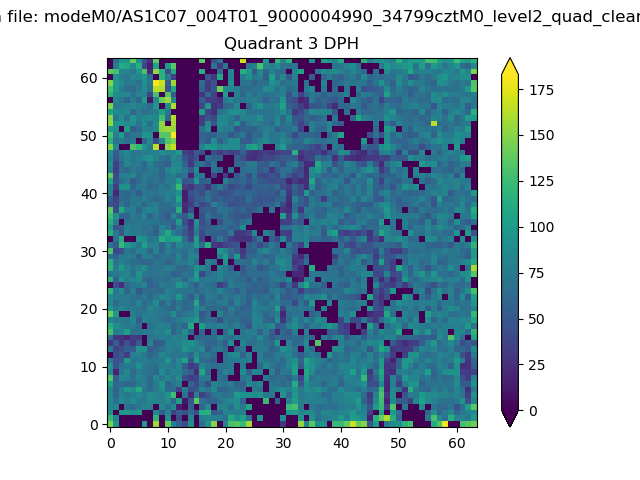 |
 |
Quadrant C |
| Plot type | Count rate plots | Images |
|---|---|---|
| Comparison with Poisson distribution Blue bars denote a histogram of data divided into 1 sec bins. Red curve is a Poisson curve with rate = median count rate of data. |
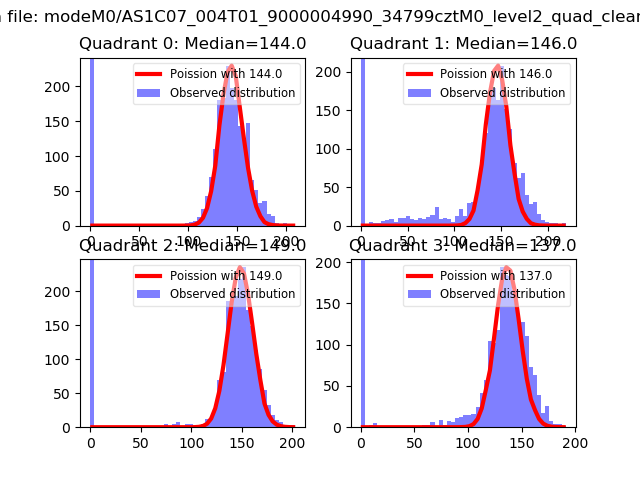 |
 |
| Quadrant-wise count rates Data is divided into 100 sec bins |
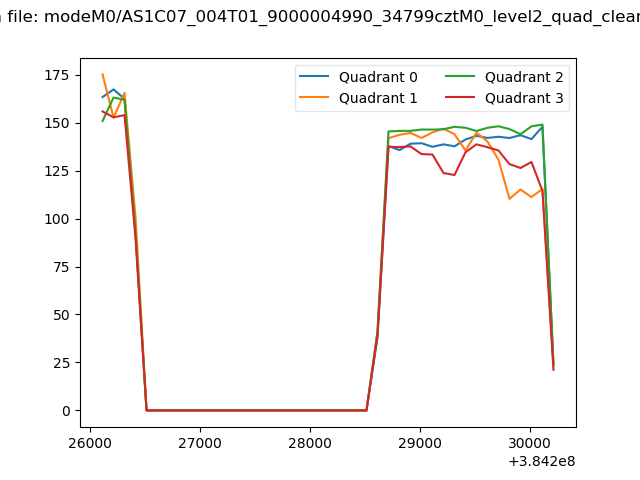 |
|
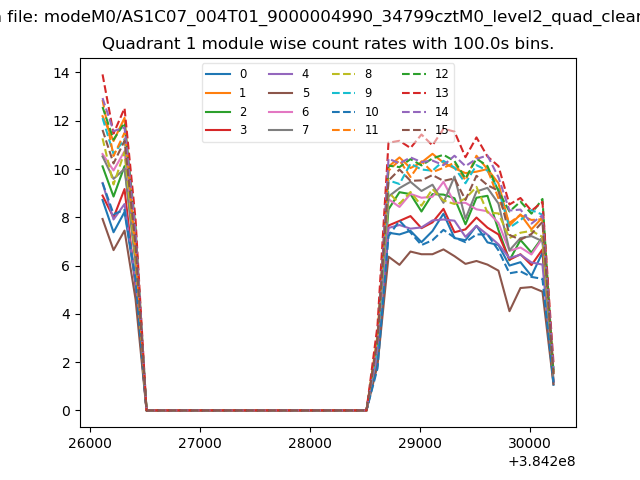
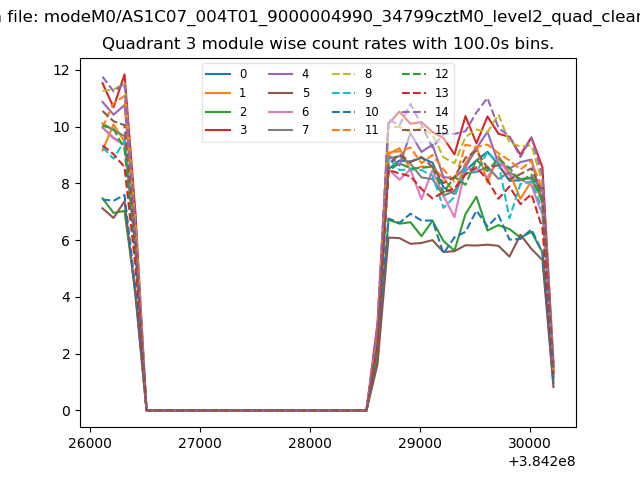
| Module-wise count rates for Quadrant A Data is divided into 100 sec bins |
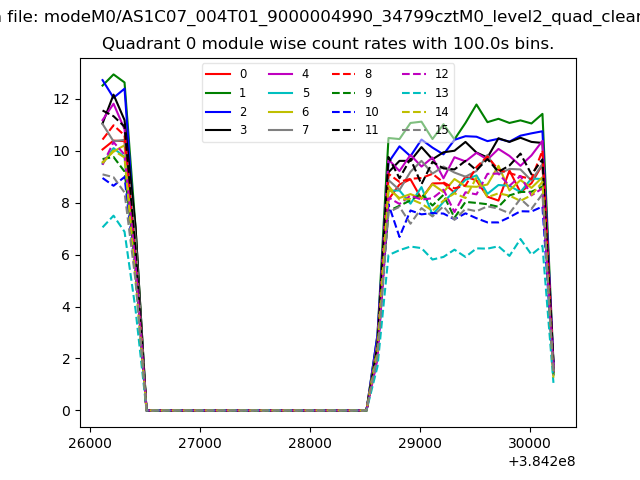 |
 |
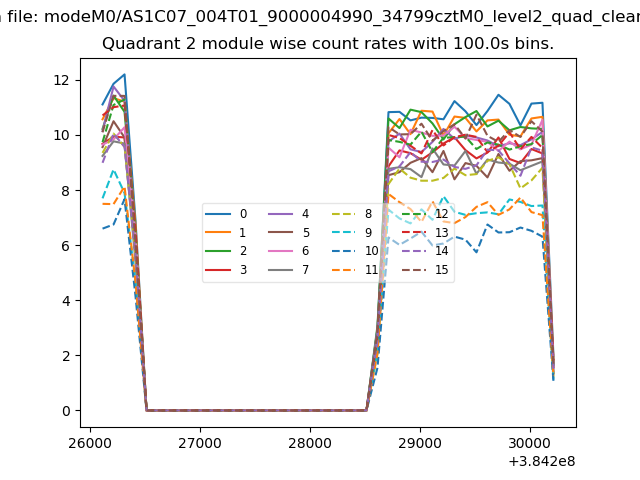
| Module-wise count rates for Quadrant B Data is divided into 100 sec bins |
 |
 |
| Module-wise count rates for Quadrant C Data is divided into 100 sec bins |
 |
 |
| Module-wise count rates for Quadrant D Data is divided into 100 sec bins |
 |
 |
| Parameter | Plot |
|---|---|
| CZT HV Monitor | 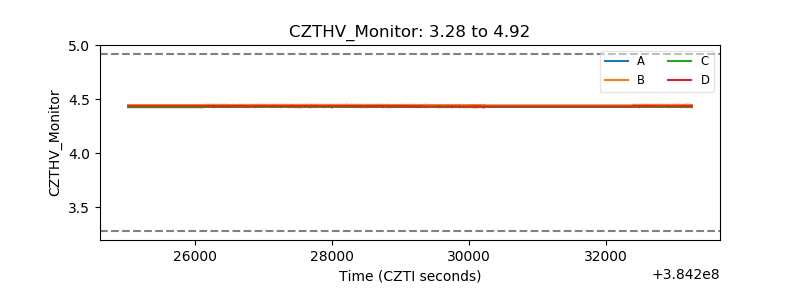 |
| D_VDD | 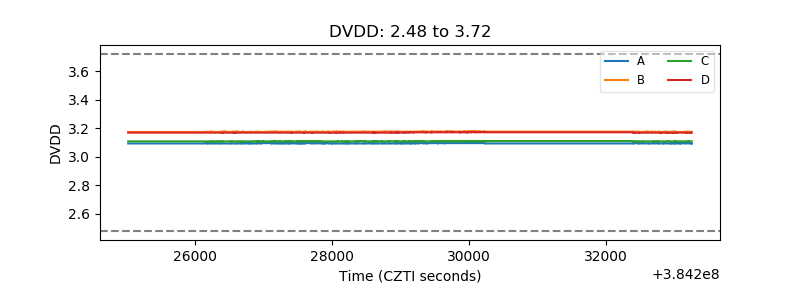 |
| Temperature 1 | 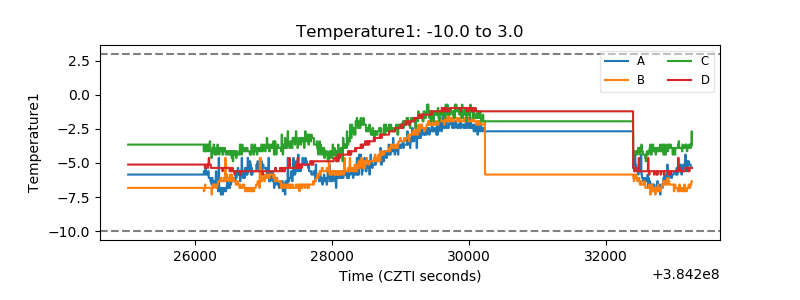 |
| Veto HV Monitor | 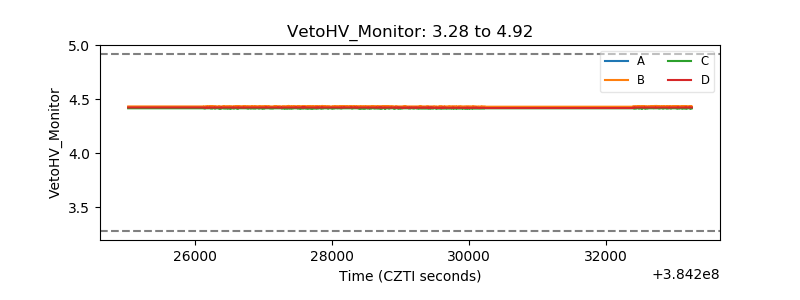 |
| Veto LLD | 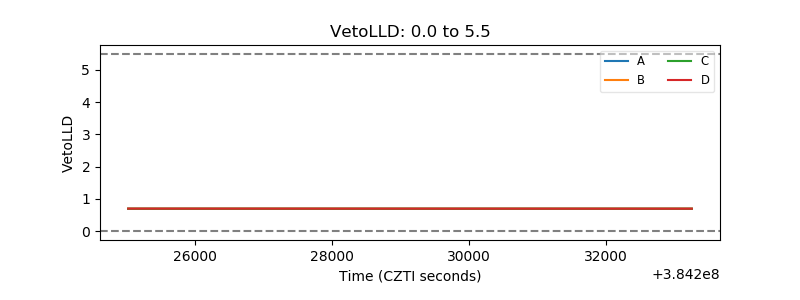 |
| Alpha Counter | 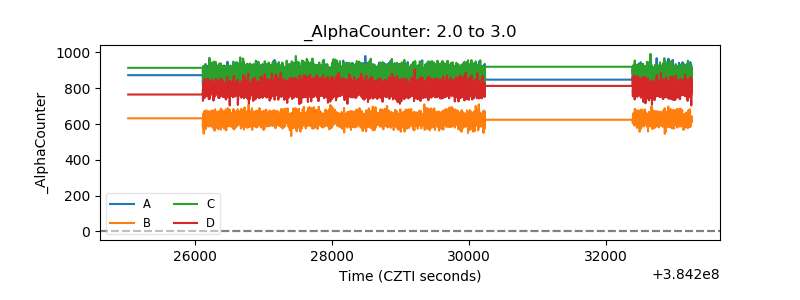 |
| _CPM_Rate | 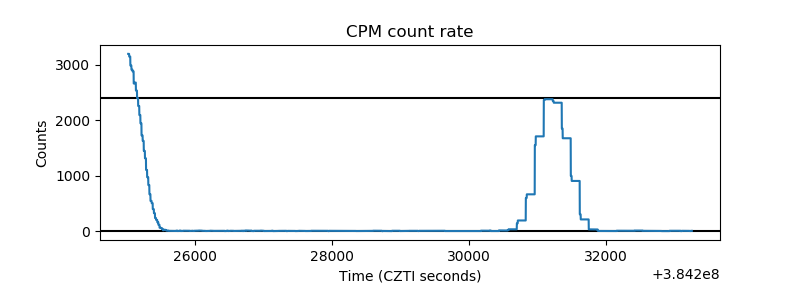 |
| CZT Counter | 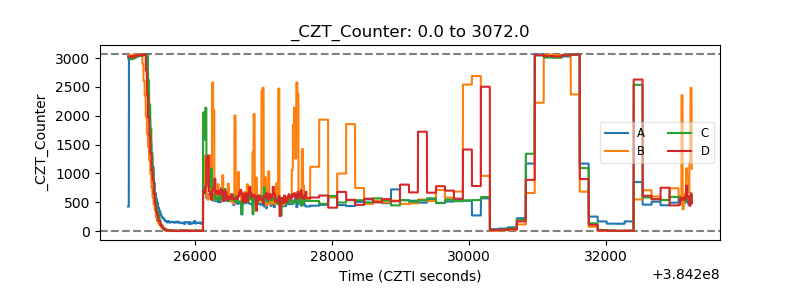 |
| +2.5 Volts monitor | 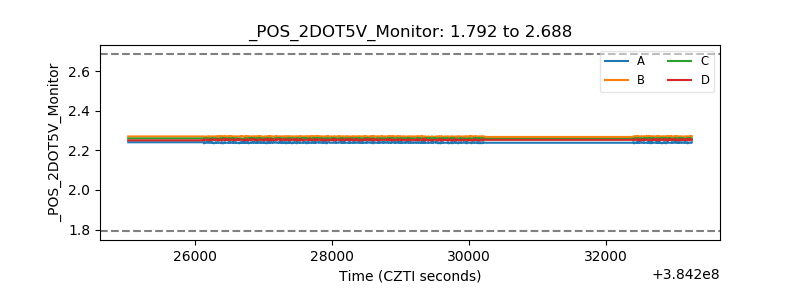 |
| +5 Volts monitor | 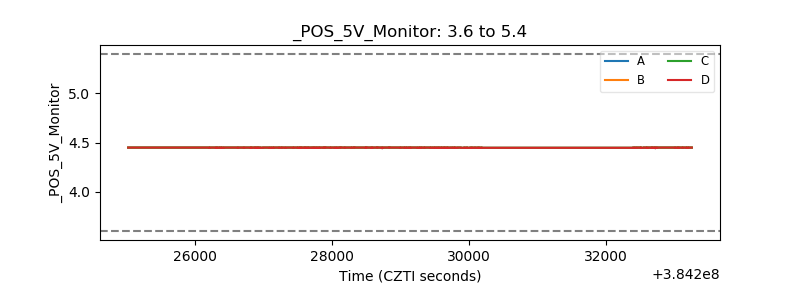 |
| _ROLL_ROT | 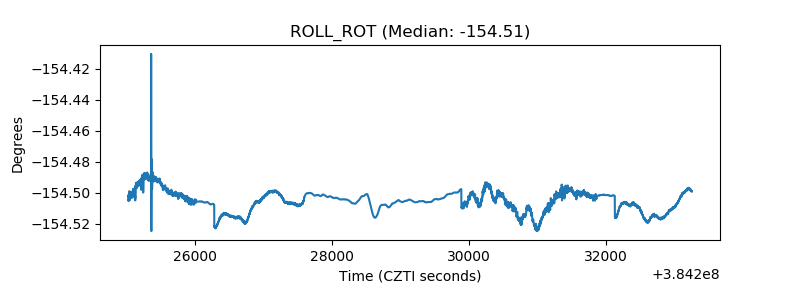 |
| _Roll_DEC | 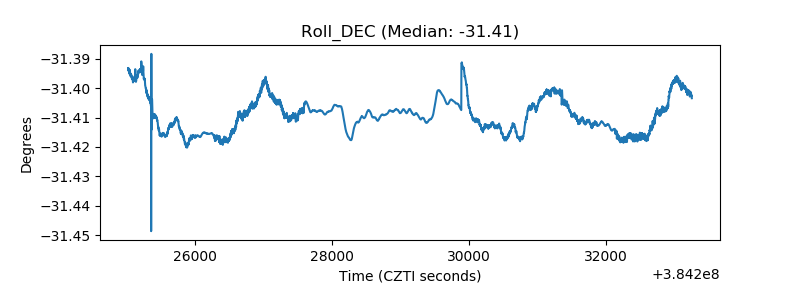 |
| _Roll_RA | 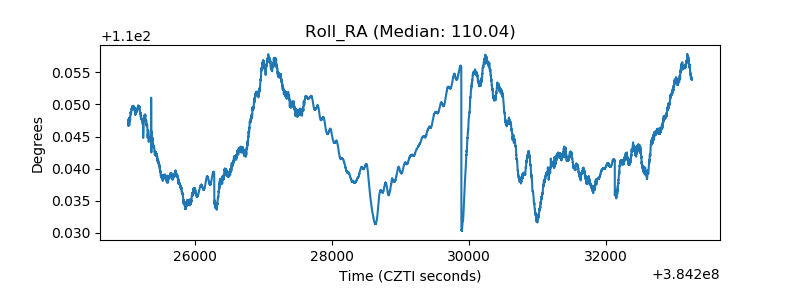 |
| Veto Counter | 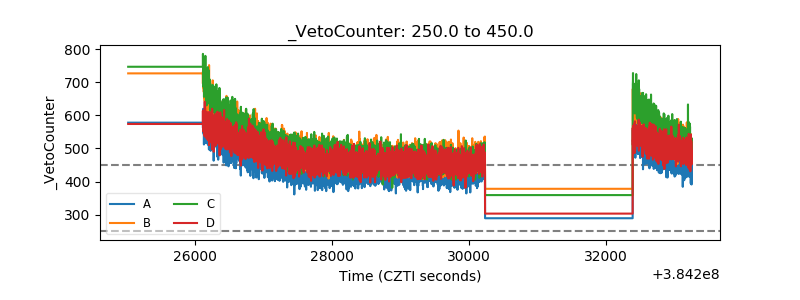 |