| Param | Original file | Final file |
|---|---|---|
| Filename | modeM0/AS1C07_004T01_9000004990_34793cztM0_level2.evt | modeM0/AS1C07_004T01_9000004990_34793cztM0_level2_quad_clean.evt |
| Size (bytes) | 507,003,840 | 69,638,400 |
| Size | 483.5 MB | 66.4 MB |
| Events in quadrant A | 2,648,322 | 441,850 |
| Events in quadrant B | 3,882,861 | 428,842 |
| Events in quadrant C | 3,074,322 | 441,193 |
| Events in quadrant D | 5,357,763 | 393,056 |
| Mode M9 | |||
|---|---|---|---|
| Quadrant | BADHDUFLAG | Total packets | Discarded packets |
| A | 0 | 19 | 0 |
| B | 0 | 19 | 0 |
| C | 0 | 19 | 0 |
| D | 0 | 20 | 0 |
| Mode M0 | |||
|---|---|---|---|
| Quadrant | BADHDUFLAG | Total packets | Discarded packets |
| A | 0 | 11795 | 3 |
| B | 0 | 15313 | 2 |
| C | 0 | 12837 | 2 |
| D | 0 | 19917 | 2 |
| Mode SS | |||
|---|---|---|---|
| Quadrant | BADHDUFLAG | Total packets | Discarded packets |
| A | 0 | 116 | 0 |
| B | 0 | 116 | 0 |
| C | 0 | 116 | 0 |
| D | 0 | 116 | 0 |
| Quadrant | Total seconds | Saturated seconds | Saturation percentage |
|---|---|---|---|
| A | 5775 | 4 | 0.069264% |
| B | 5775 | 366 | 6.337662% |
| C | 5775 | 73 | 1.264069% |
| D | 5775 | 480 | 8.311688% |
Noise dominated data is calculated using 1-second bins in cleaned event files. If a bin has >2000 counts, and if more than 50% of those come from <1% of pixels, then it is considered to be noise-dominated and hence unusable.
| Quadrant | # 1 sec bins | Bins with >0 counts | Bins with >2000 counts | High rate bins dominated by noise | Noise dominated (total time) | Noise dominated (detector-on time) | Marked lightcurve |
|---|---|---|---|---|---|---|---|
| A | 7357 | 5776 | 0 | 0 | 0.00% | 0.00% | 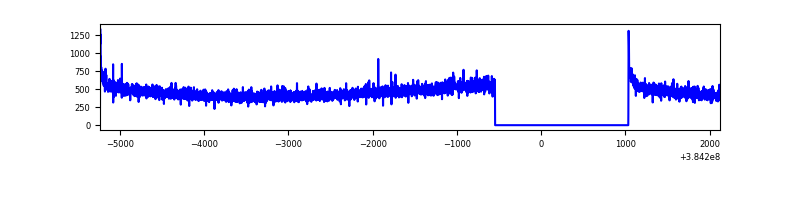 |
| B | 7357 | 5776 | 264 | 264 | 3.59% | 4.57% | 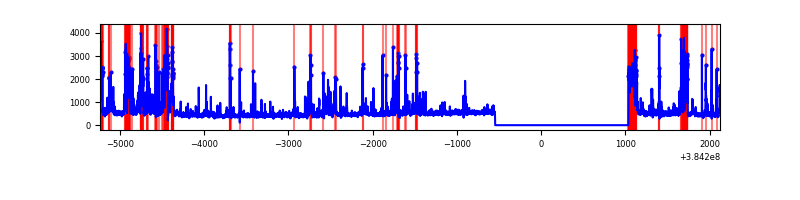 |
| C | 7357 | 5776 | 58 | 58 | 0.79% | 1.00% | 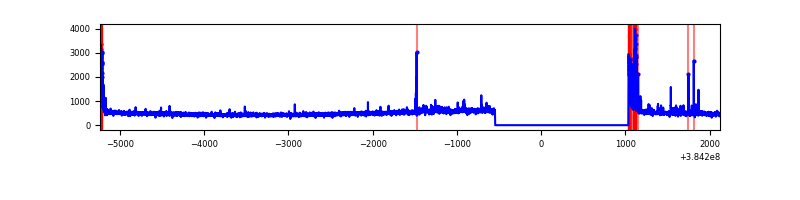 |
| D | 7357 | 5776 | 474 | 474 | 6.44% | 8.21% | 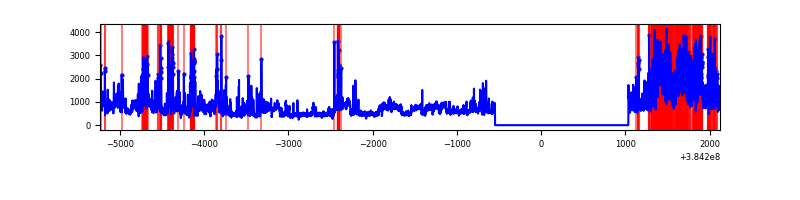 |
Top three noisy pixels from each quadrant. If the there are fewer than three noisy pixels in the level2.evt file, extra rows are filled as -1
| Pixel properties | Quadrant properties | ||||||
|---|---|---|---|---|---|---|---|
| Quadrant | DetID | PixID | Counts | Sigma | Mean | Median | Sigma |
| A | 10 | 83 | 52273 | 382.51 | 666 | 652 | 135.0 |
| A | 13 | 6 | 14336 | 101.39 | 666 | 652 | 135.0 |
| A | 13 | 254 | 10015 | 69.38 | 666 | 652 | 135.0 |
| B | 5 | 172 | 911424 | 7153.85 | 649 | 631 | 127.3 |
| B | 4 | 171 | 135899 | 1062.47 | 649 | 631 | 127.3 |
| B | 15 | 85 | 128033 | 1000.68 | 649 | 631 | 127.3 |
| C | 15 | 214 | 246200 | 1621.9 | 647 | 653 | 151.4 |
| C | 0 | 10 | 242507 | 1597.51 | 647 | 653 | 151.4 |
| C | 14 | 67 | 35919 | 232.94 | 647 | 653 | 151.4 |
| D | 8 | 195 | 1113727 | 7261.53 | 625 | 608 | 153.3 |
| D | 13 | 249 | 820085 | 5345.93 | 625 | 608 | 153.3 |
| D | 2 | 249 | 397424 | 2588.66 | 625 | 608 | 153.3 |
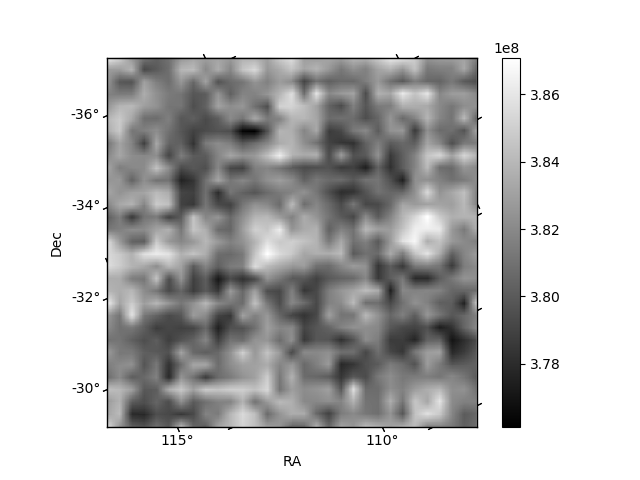
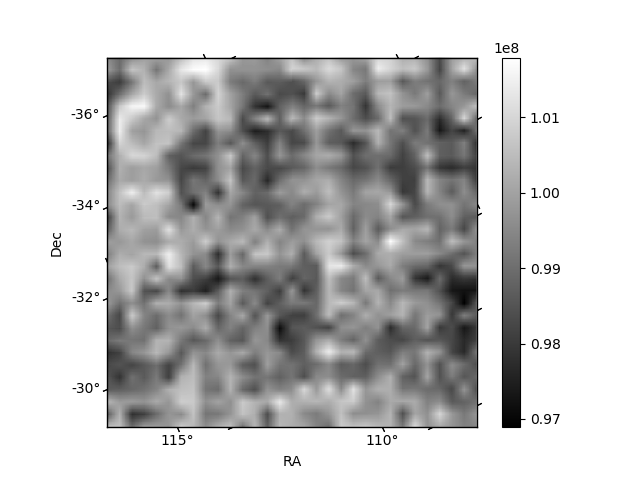
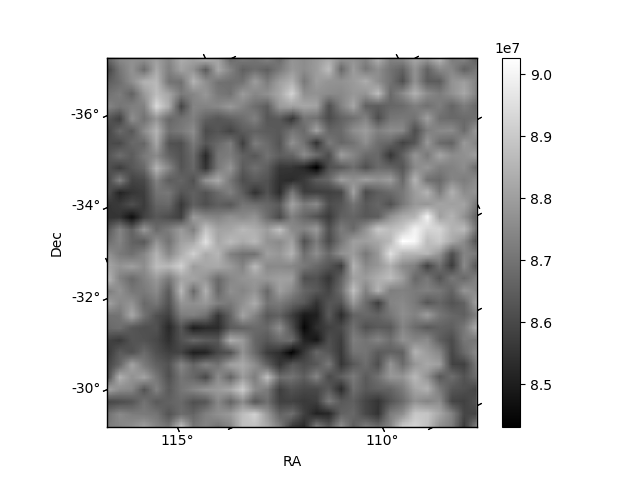
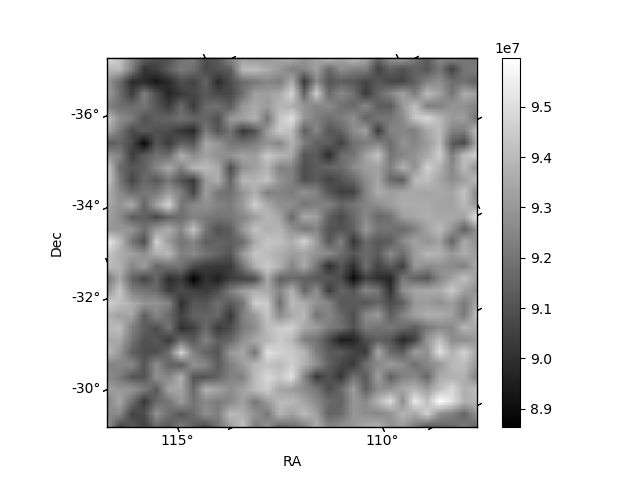
Histogram calculated using DETX and DETY for each event in the final _common_clean file
| Quadrant A | 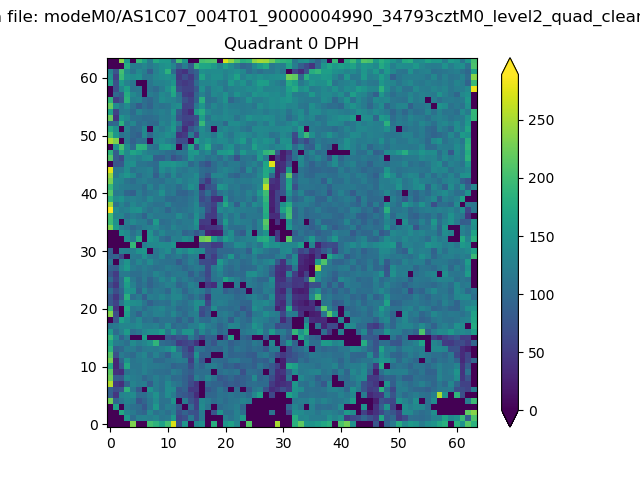 |
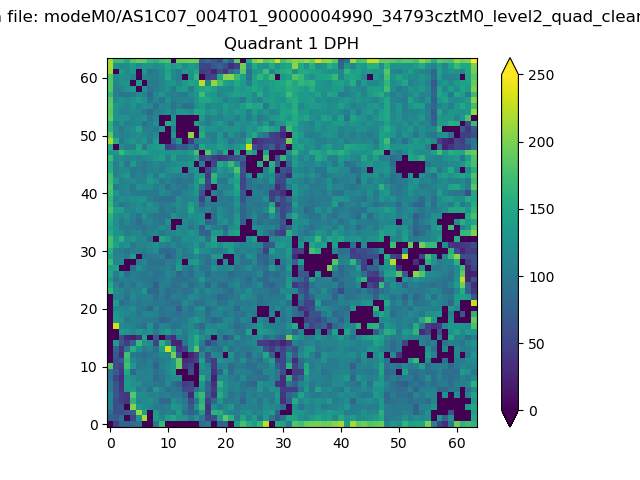 |
Quadrant B |
|---|---|---|---|
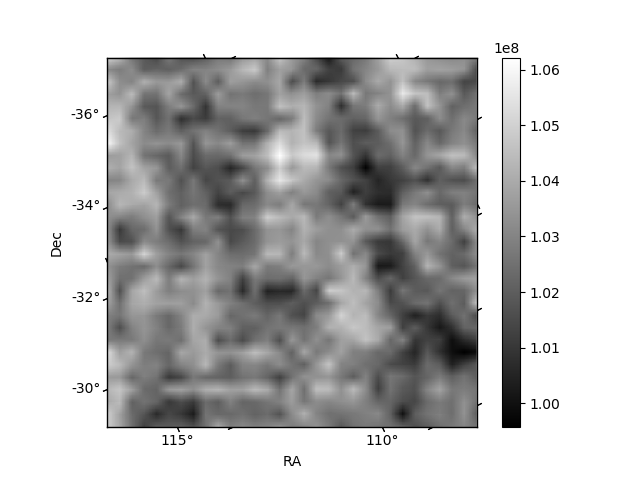
| Quadrant D | 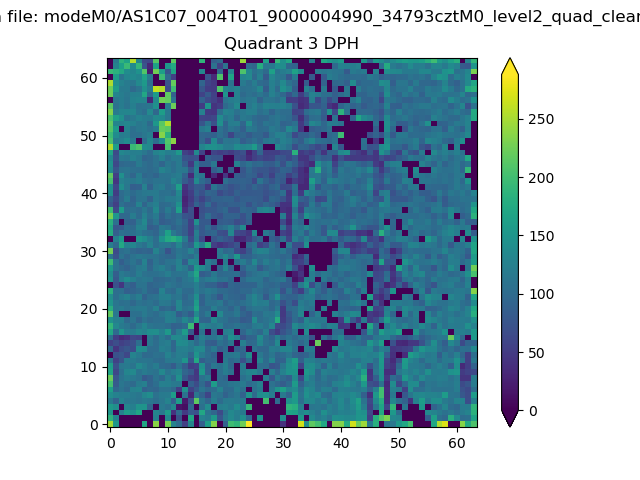 |
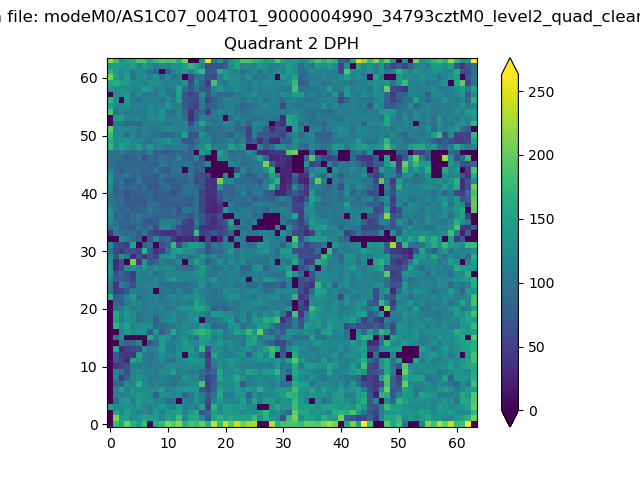 |
Quadrant C |
| Plot type | Count rate plots | Images |
|---|---|---|
| Comparison with Poisson distribution Blue bars denote a histogram of data divided into 1 sec bins. Red curve is a Poisson curve with rate = median count rate of data. |
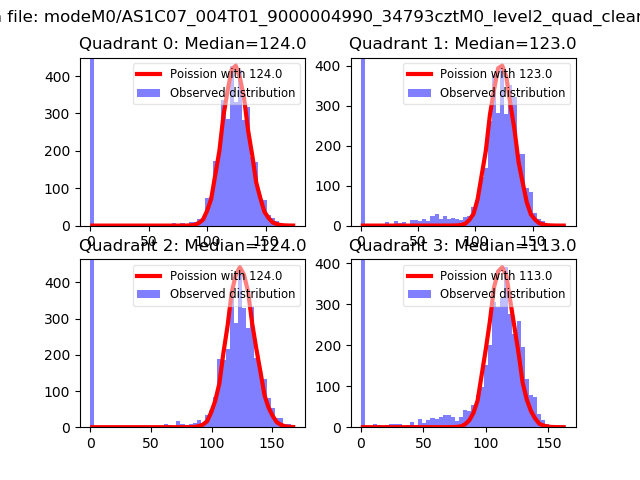 |
 |
| Quadrant-wise count rates Data is divided into 100 sec bins |
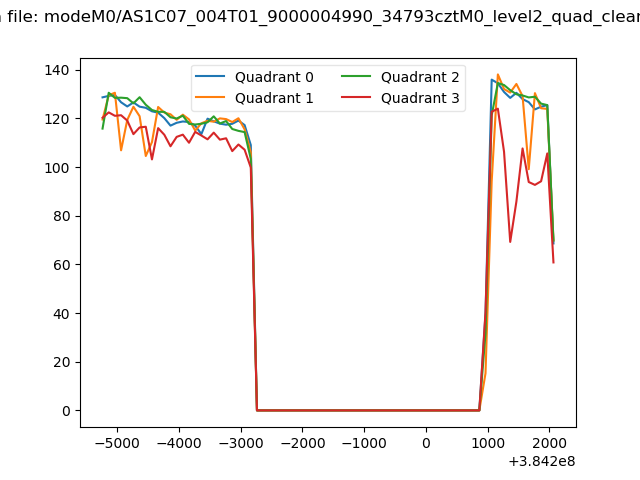 |
|
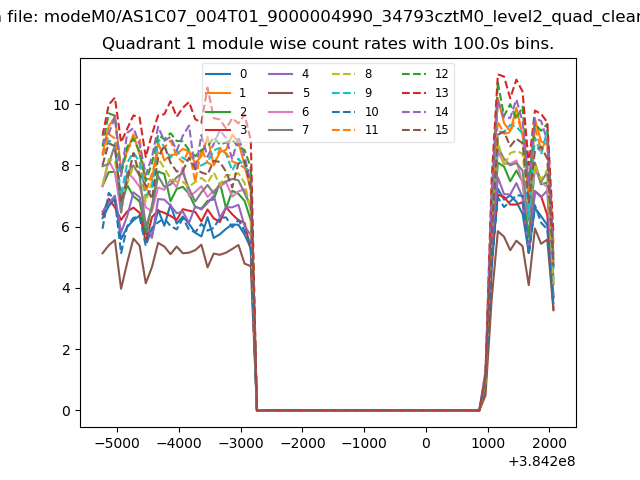
| Module-wise count rates for Quadrant A Data is divided into 100 sec bins |
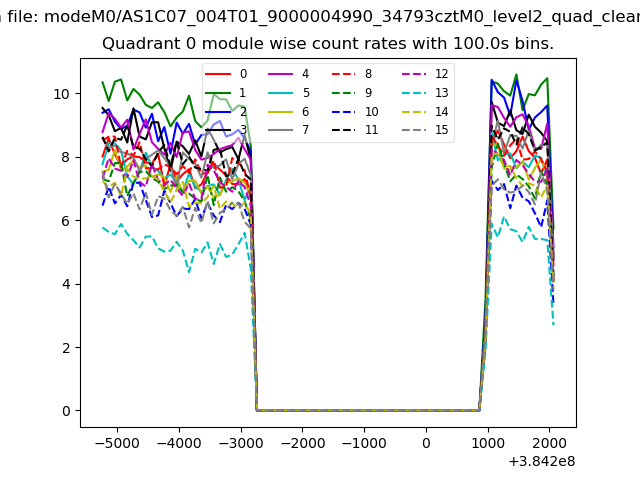 |
 |
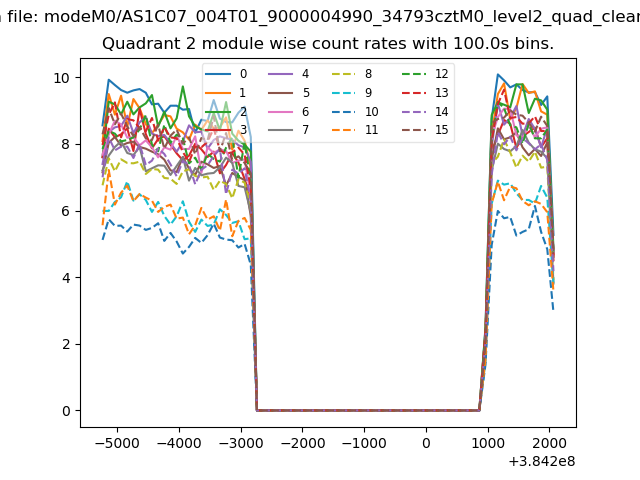
| Module-wise count rates for Quadrant B Data is divided into 100 sec bins |
 |
 |
| Module-wise count rates for Quadrant C Data is divided into 100 sec bins |
 |
 |
| Module-wise count rates for Quadrant D Data is divided into 100 sec bins |
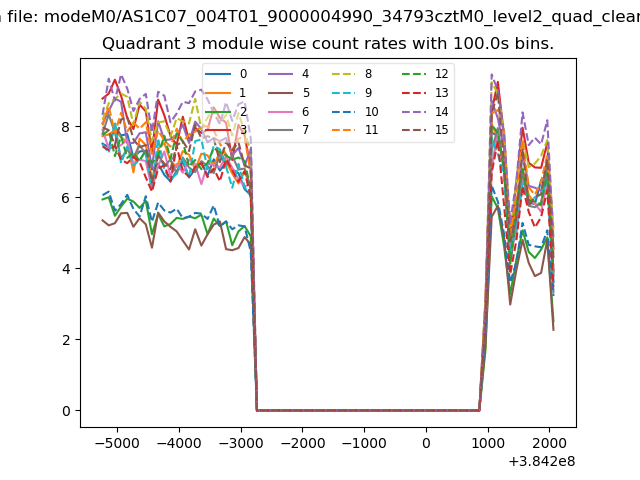 |
 |
| Parameter | Plot |
|---|---|
| CZT HV Monitor | 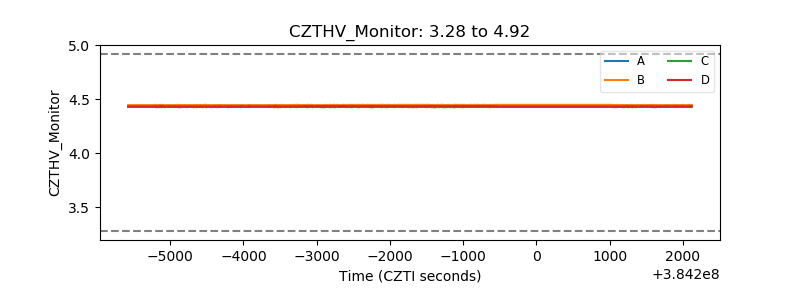 |
| D_VDD | 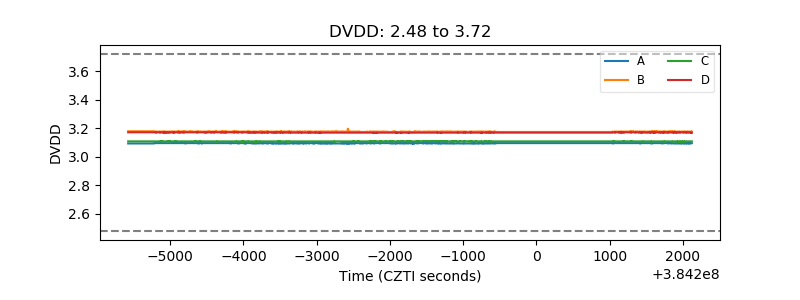 |
| Temperature 1 | 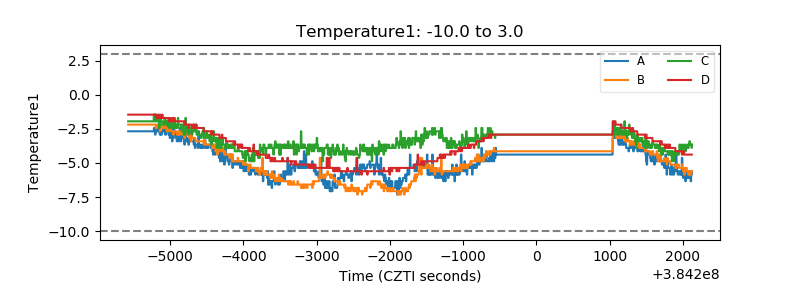 |
| Veto HV Monitor |  |
| Veto LLD | 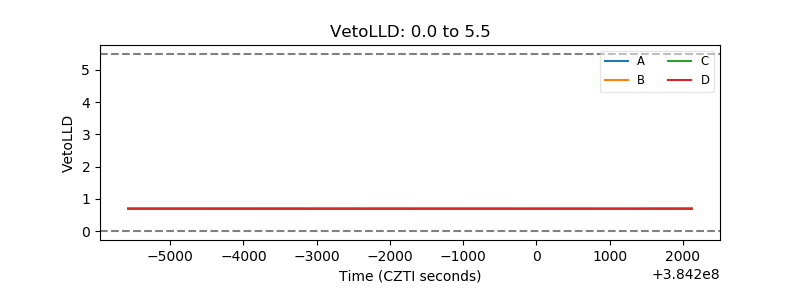 |
| Alpha Counter | 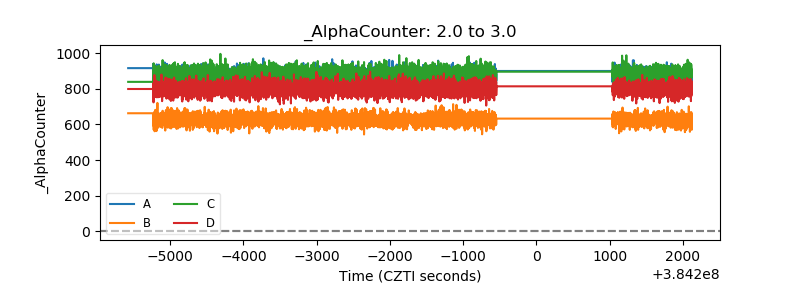 |
| _CPM_Rate | 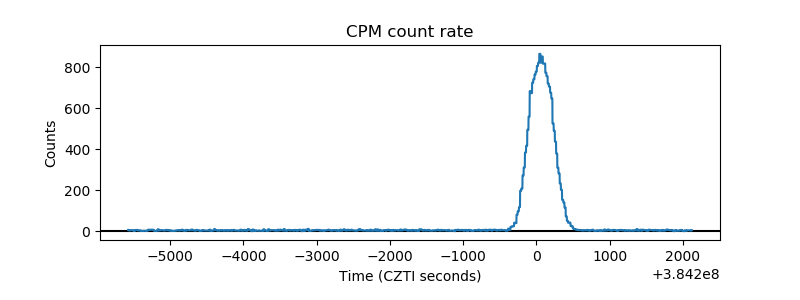 |
| CZT Counter | 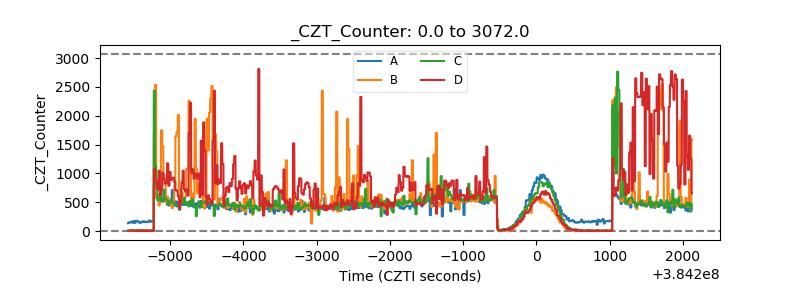 |
| +2.5 Volts monitor | 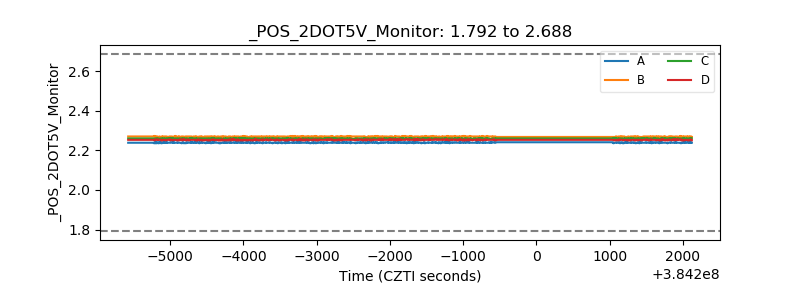 |
| +5 Volts monitor | 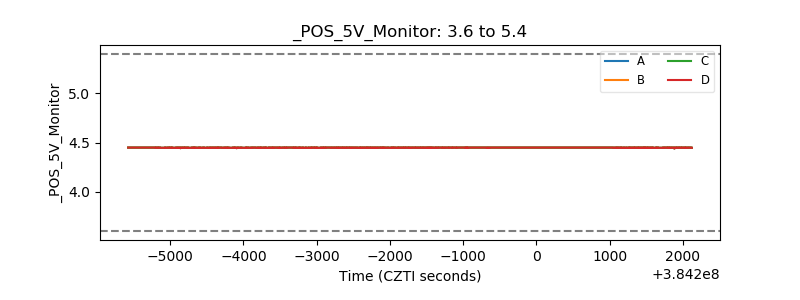 |
| _ROLL_ROT | 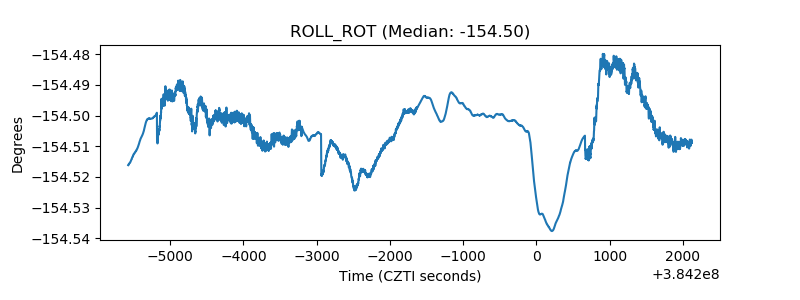 |
| _Roll_DEC | 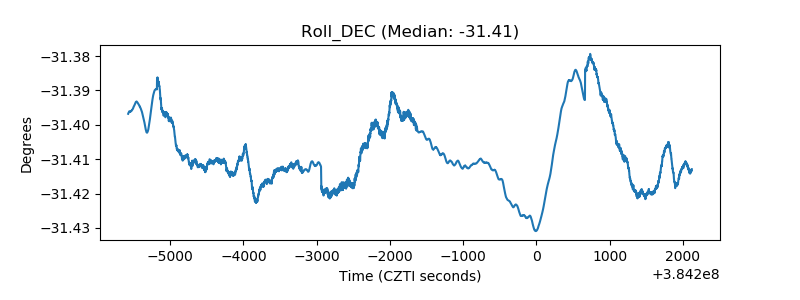 |
| _Roll_RA | 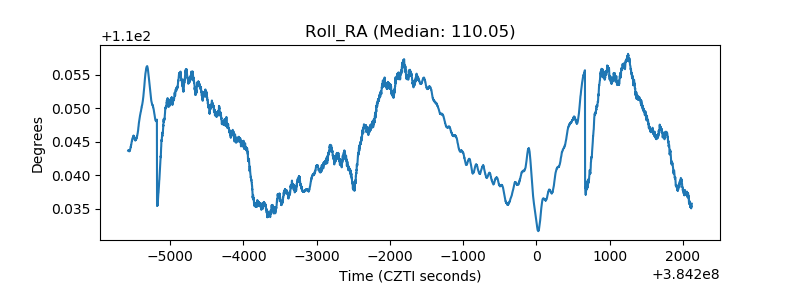 |
| Veto Counter | 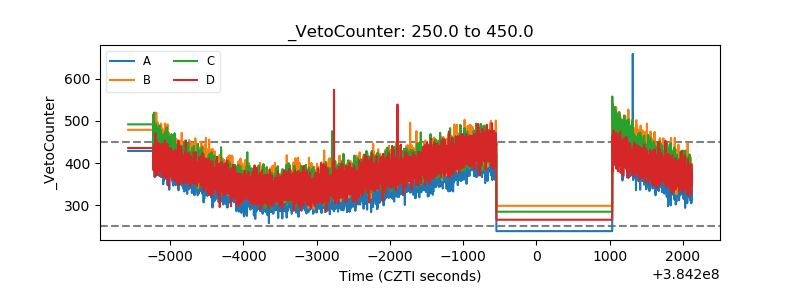 |