| Param | Original file | Final file |
|---|---|---|
| Filename | modeM0/AS1C07_004T01_9000004990_34792cztM0_level2.evt | modeM0/AS1C07_004T01_9000004990_34792cztM0_level2_quad_clean.evt |
| Size (bytes) | 876,251,520 | 139,464,000 |
| Size | 835.7 MB | 133.0 MB |
| Events in quadrant A | 5,220,907 | 884,430 |
| Events in quadrant B | 6,888,300 | 870,832 |
| Events in quadrant C | 5,599,560 | 890,999 |
| Events in quadrant D | 8,105,146 | 835,748 |
| Mode M9 | |||
|---|---|---|---|
| Quadrant | BADHDUFLAG | Total packets | Discarded packets |
| A | 0 | 36 | 0 |
| B | 0 | 36 | 0 |
| C | 0 | 36 | 0 |
| D | 0 | 37 | 0 |
| Mode M0 | |||
|---|---|---|---|
| Quadrant | BADHDUFLAG | Total packets | Discarded packets |
| A | 0 | 22145 | 3 |
| B | 0 | 27366 | 2 |
| C | 0 | 23245 | 2 |
| D | 0 | 31565 | 2 |
| Mode SS | |||
|---|---|---|---|
| Quadrant | BADHDUFLAG | Total packets | Discarded packets |
| A | 0 | 218 | 0 |
| B | 0 | 218 | 0 |
| C | 0 | 218 | 0 |
| D | 0 | 218 | 0 |
| Quadrant | Total seconds | Saturated seconds | Saturation percentage |
|---|---|---|---|
| A | 10709 | 13 | 0.121393% |
| B | 10709 | 526 | 4.911756% |
| C | 10709 | 83 | 0.775049% |
| D | 10709 | 228 | 2.129050% |
Noise dominated data is calculated using 1-second bins in cleaned event files. If a bin has >2000 counts, and if more than 50% of those come from <1% of pixels, then it is considered to be noise-dominated and hence unusable.
| Quadrant | # 1 sec bins | Bins with >0 counts | Bins with >2000 counts | High rate bins dominated by noise | Noise dominated (total time) | Noise dominated (detector-on time) | Marked lightcurve |
|---|---|---|---|---|---|---|---|
| A | 13515 | 10711 | 0 | 0 | 0.00% | 0.00% | 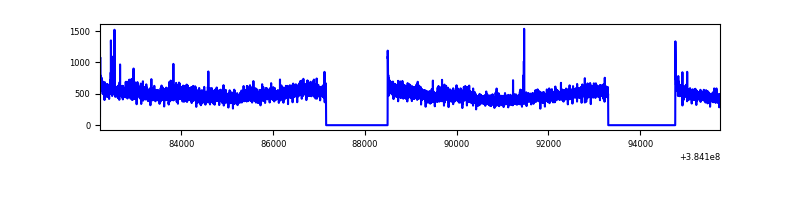 |
| B | 13515 | 10711 | 370 | 370 | 2.74% | 3.45% | 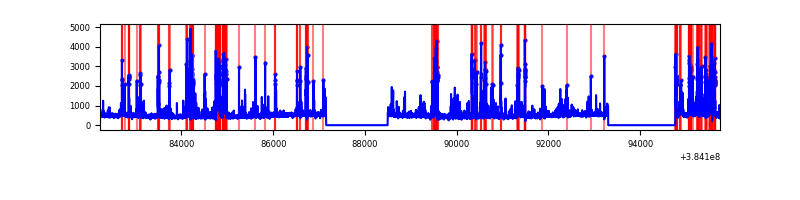 |
| C | 13515 | 10711 | 57 | 57 | 0.42% | 0.53% | 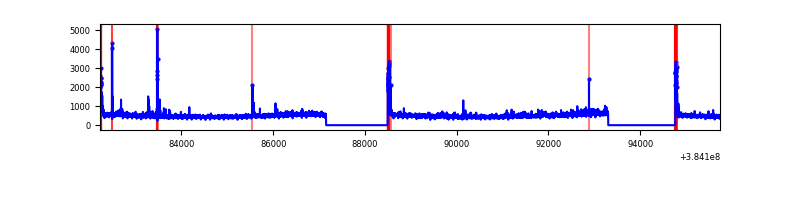 |
| D | 13515 | 10711 | 192 | 192 | 1.42% | 1.79% | 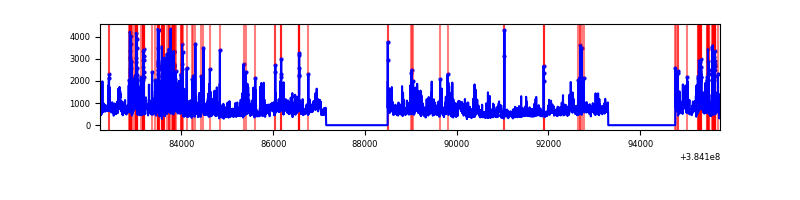 |
Top three noisy pixels from each quadrant. If the there are fewer than three noisy pixels in the level2.evt file, extra rows are filled as -1
| Pixel properties | Quadrant properties | ||||||
|---|---|---|---|---|---|---|---|
| Quadrant | DetID | PixID | Counts | Sigma | Mean | Median | Sigma |
| A | 15 | 169 | 269111 | 1065.46 | 1243 | 1217 | 251.4 |
| A | 10 | 83 | 80950 | 317.11 | 1243 | 1217 | 251.4 |
| A | 15 | 174 | 27972 | 106.41 | 1243 | 1217 | 251.4 |
| B | 5 | 172 | 1243197 | 5319.09 | 1220 | 1188 | 233.5 |
| B | 15 | 85 | 302971 | 1292.43 | 1220 | 1188 | 233.5 |
| B | 5 | 255 | 217570 | 926.69 | 1220 | 1188 | 233.5 |
| C | 15 | 214 | 450184 | 1590.27 | 1208 | 1215 | 282.3 |
| C | 0 | 10 | 200566 | 706.11 | 1208 | 1215 | 282.3 |
| C | 14 | 67 | 158693 | 557.8 | 1208 | 1215 | 282.3 |
| D | 8 | 195 | 1909779 | 6562.37 | 1199 | 1168 | 290.8 |
| D | 2 | 250 | 442365 | 1516.96 | 1199 | 1168 | 290.8 |
| D | 2 | 249 | 394283 | 1351.64 | 1199 | 1168 | 290.8 |
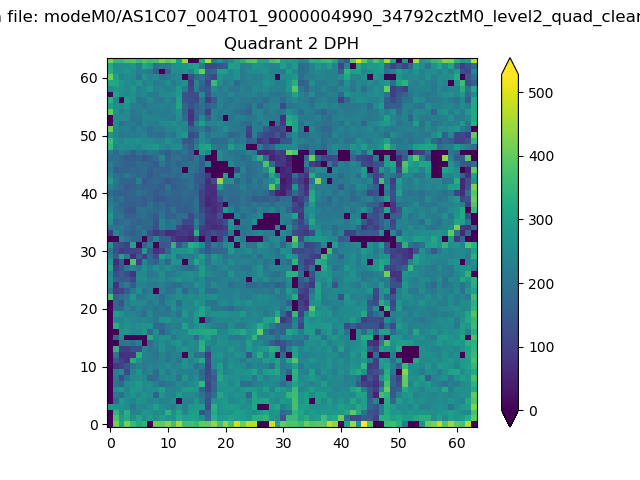
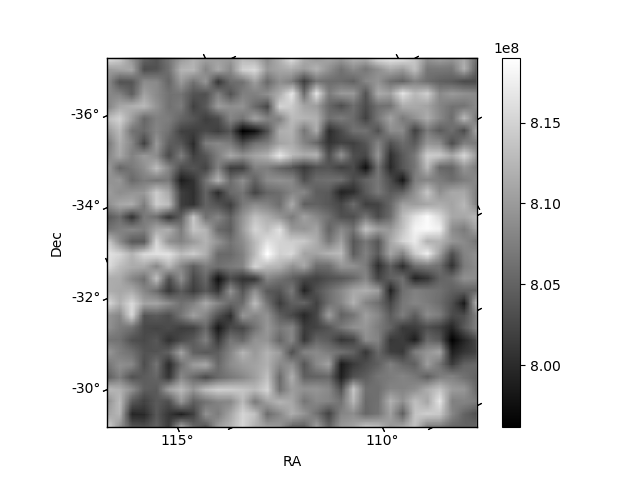
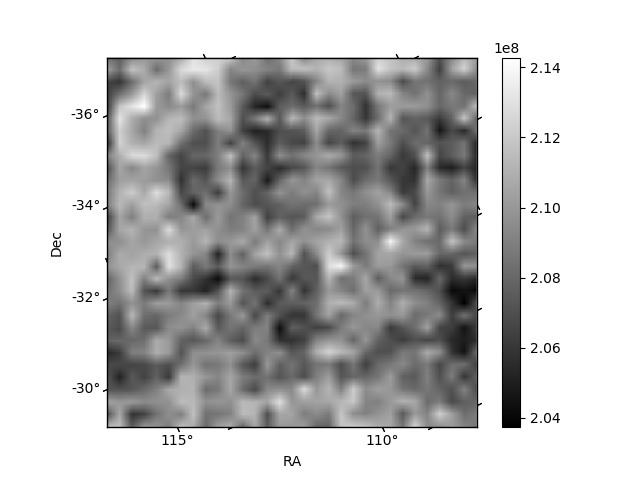
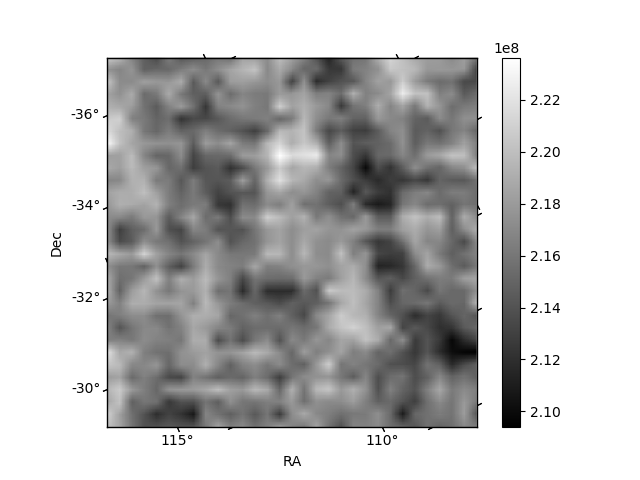
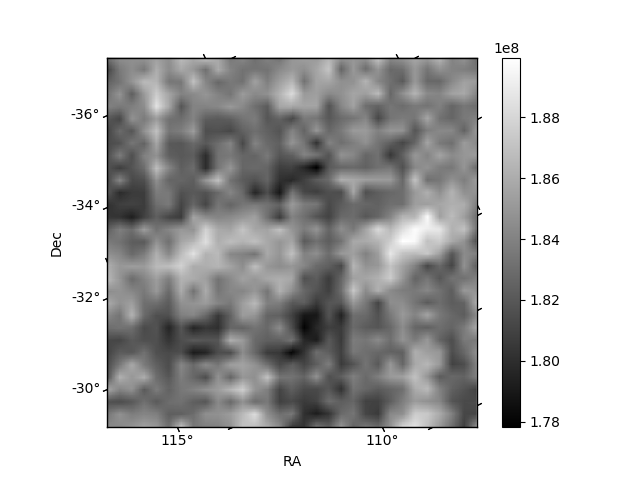
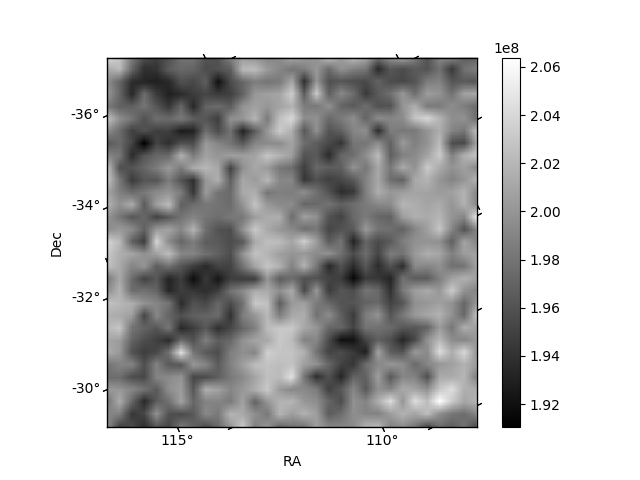
Histogram calculated using DETX and DETY for each event in the final _common_clean file
| Quadrant A | 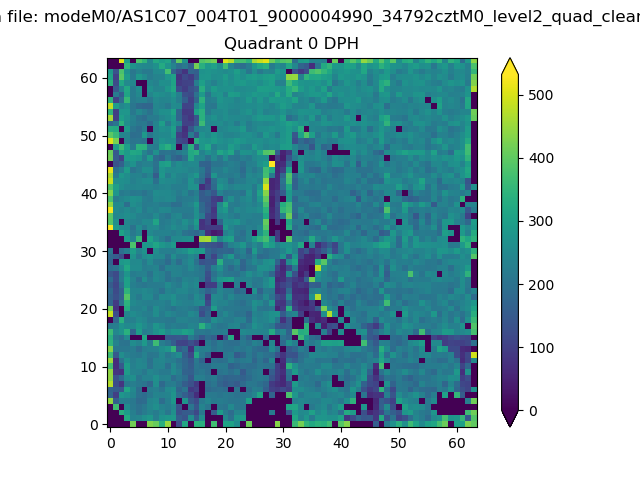 |
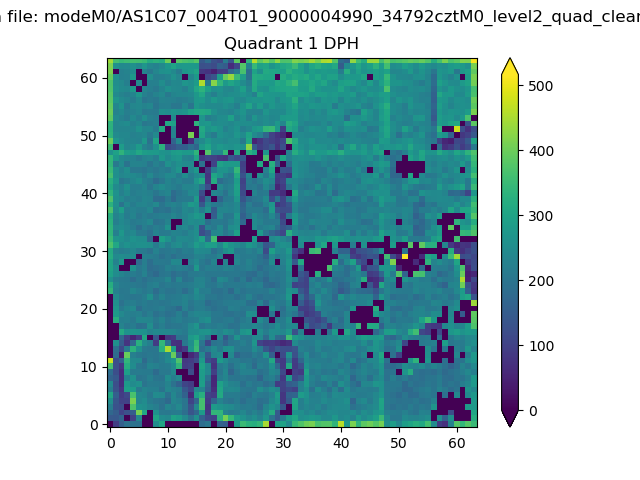 |
Quadrant B |
|---|---|---|---|
| Quadrant D | 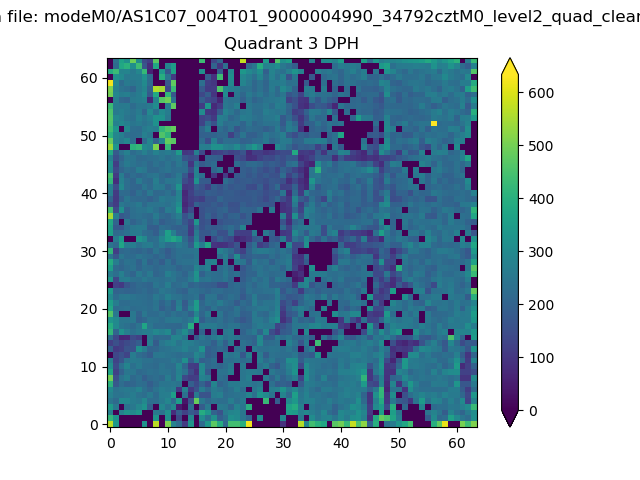 |
 |
Quadrant C |
| Plot type | Count rate plots | Images |
|---|---|---|
| Comparison with Poisson distribution Blue bars denote a histogram of data divided into 1 sec bins. Red curve is a Poisson curve with rate = median count rate of data. |
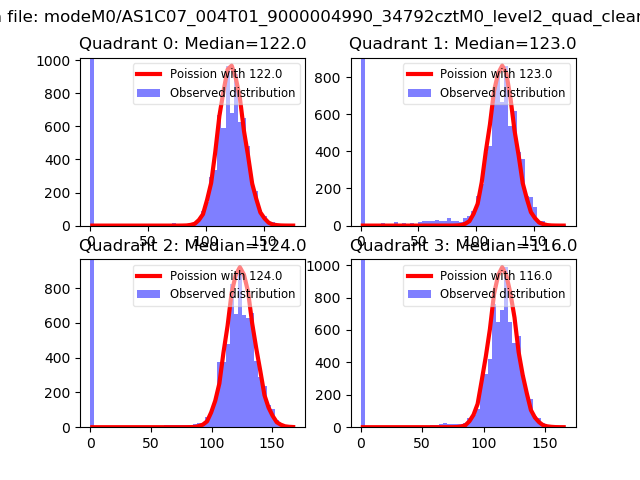 |
 |
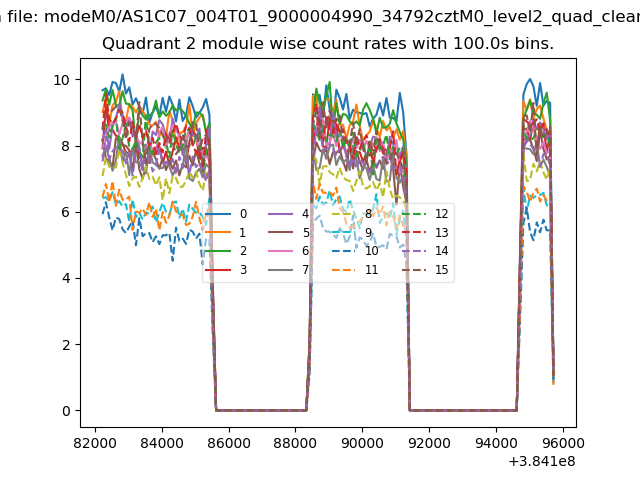
| Quadrant-wise count rates Data is divided into 100 sec bins |
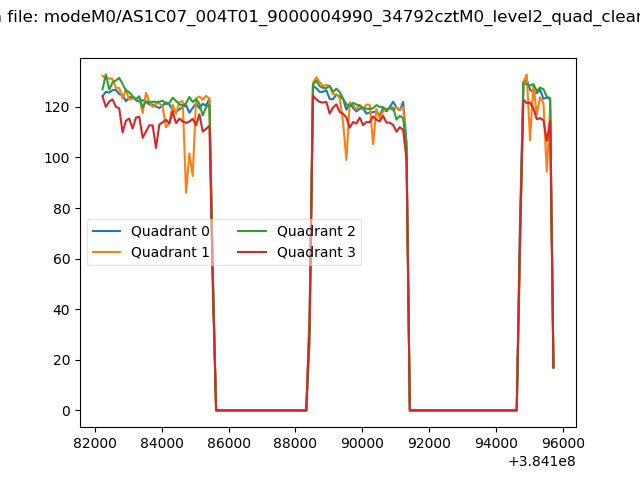 |
|
| Module-wise count rates for Quadrant A Data is divided into 100 sec bins |
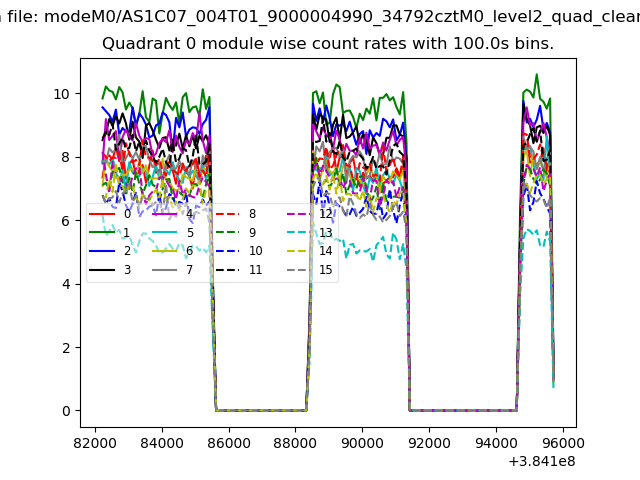 |
 |
| Module-wise count rates for Quadrant B Data is divided into 100 sec bins |
 |
 |
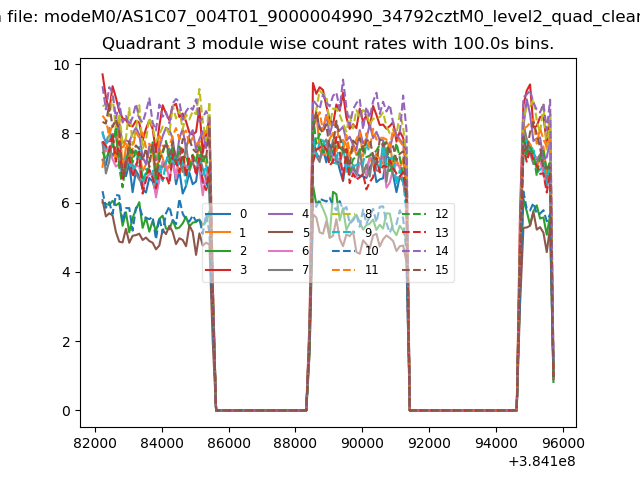
| Module-wise count rates for Quadrant C Data is divided into 100 sec bins |
 |
 |
| Module-wise count rates for Quadrant D Data is divided into 100 sec bins |
 |
 |
| Parameter | Plot |
|---|---|
| CZT HV Monitor |  |
| D_VDD | 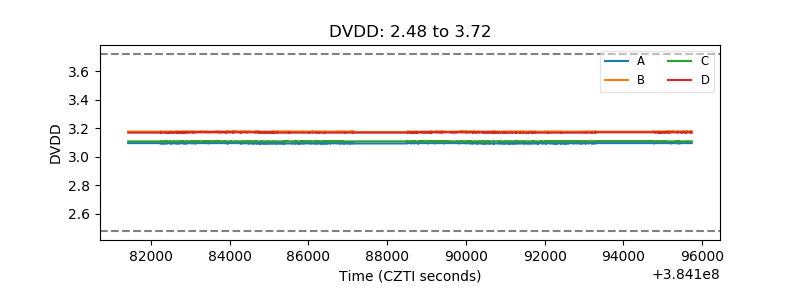 |
| Temperature 1 | 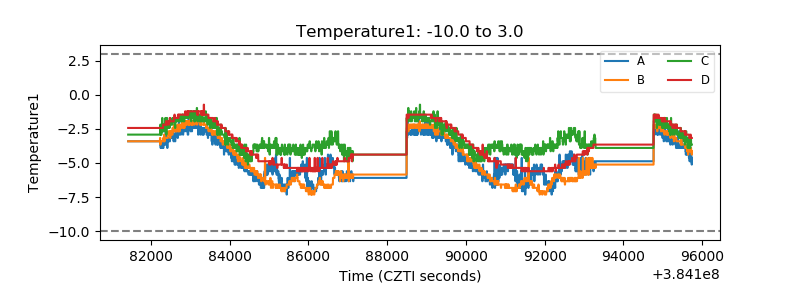 |
| Veto HV Monitor |  |
| Veto LLD |  |
| Alpha Counter | 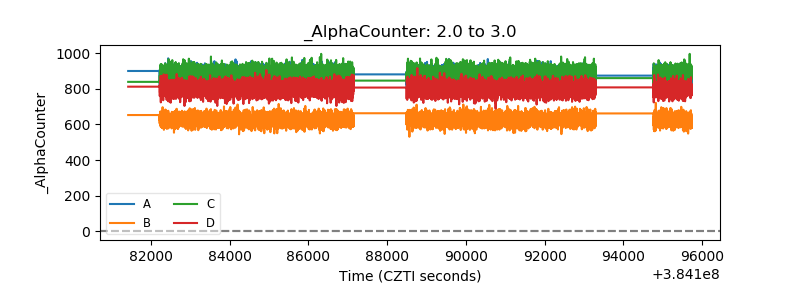 |
| _CPM_Rate | 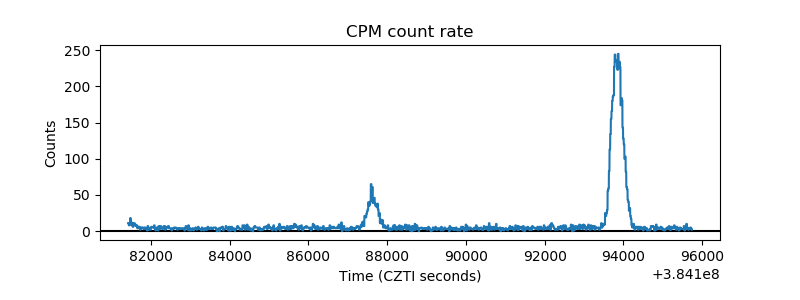 |
| CZT Counter | 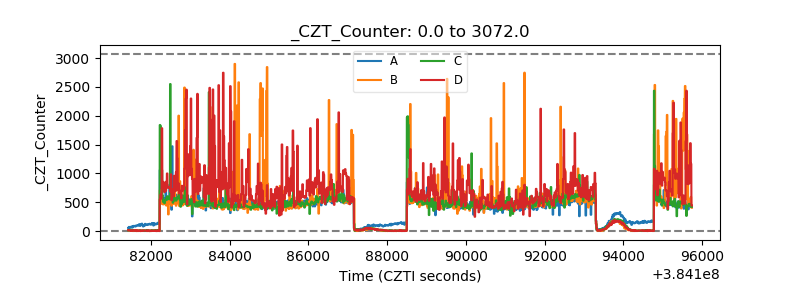 |
| +2.5 Volts monitor | 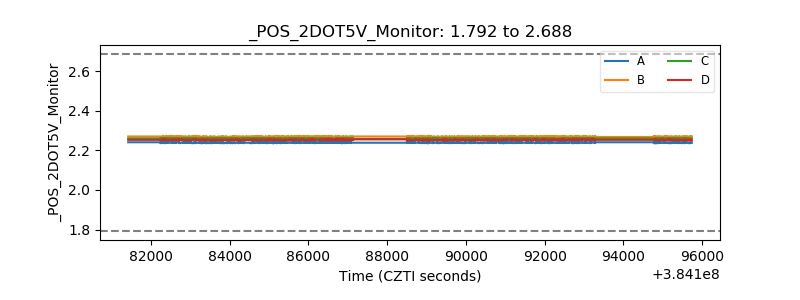 |
| +5 Volts monitor | 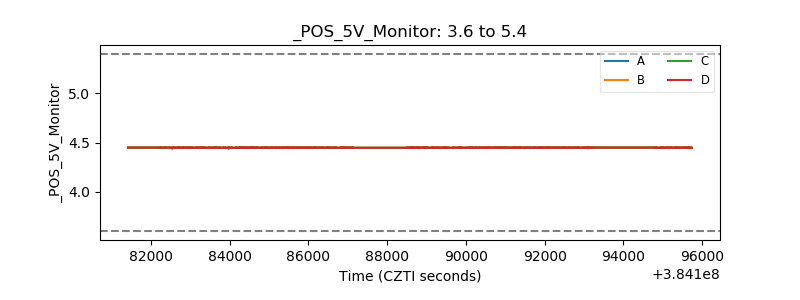 |
| _ROLL_ROT | 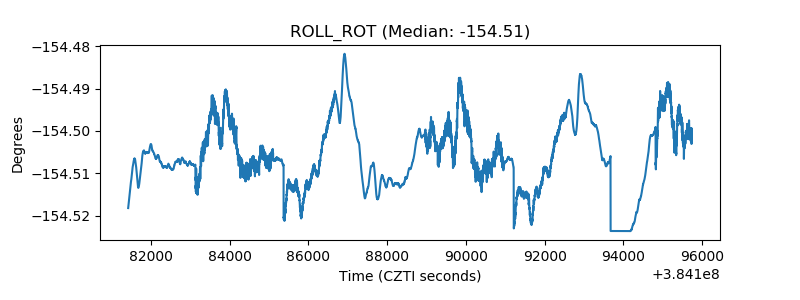 |
| _Roll_DEC | 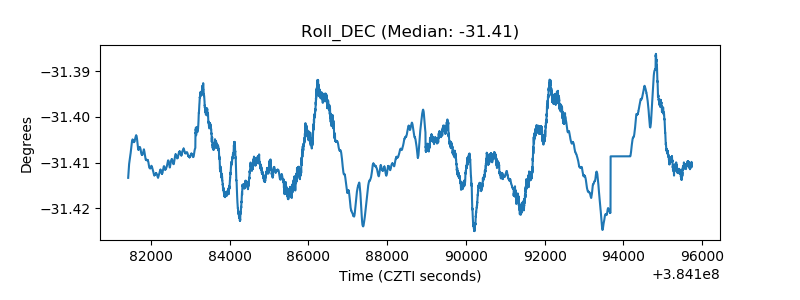 |
| _Roll_RA | 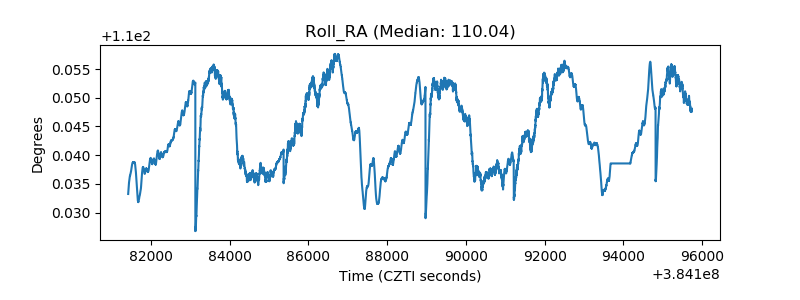 |
| Veto Counter | 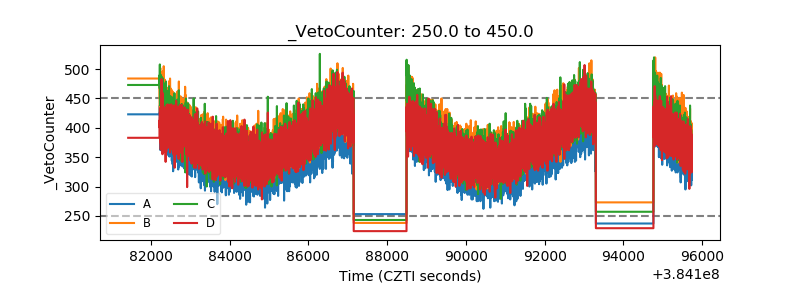 |