| Param | Original file | Final file |
|---|---|---|
| Filename | modeM0/AS1C07_004T01_9000004990_34789cztM0_level2.evt | modeM0/AS1C07_004T01_9000004990_34789cztM0_level2_quad_clean.evt |
| Size (bytes) | 506,698,560 | 94,838,400 |
| Size | 483.2 MB | 90.4 MB |
| Events in quadrant A | 3,075,806 | 608,025 |
| Events in quadrant B | 3,774,751 | 618,140 |
| Events in quadrant C | 3,347,009 | 623,781 |
| Events in quadrant D | 4,711,688 | 573,708 |
| Mode M9 | |||
|---|---|---|---|
| Quadrant | BADHDUFLAG | Total packets | Discarded packets |
| A | 0 | 29 | 0 |
| B | 0 | 29 | 0 |
| C | 0 | 29 | 0 |
| D | 0 | 29 | 0 |
| Mode M0 | |||
|---|---|---|---|
| Quadrant | BADHDUFLAG | Total packets | Discarded packets |
| A | 0 | 13127 | 3 |
| B | 0 | 15256 | 2 |
| C | 0 | 13652 | 2 |
| D | 0 | 18346 | 2 |
| Mode SS | |||
|---|---|---|---|
| Quadrant | BADHDUFLAG | Total packets | Discarded packets |
| A | 0 | 132 | 0 |
| B | 0 | 132 | 0 |
| C | 0 | 132 | 0 |
| D | 0 | 132 | 0 |
| Quadrant | Total seconds | Saturated seconds | Saturation percentage |
|---|---|---|---|
| A | 6430 | 6 | 0.093313% |
| B | 6430 | 173 | 2.690513% |
| C | 6430 | 38 | 0.590980% |
| D | 6430 | 193 | 3.001555% |
Noise dominated data is calculated using 1-second bins in cleaned event files. If a bin has >2000 counts, and if more than 50% of those come from <1% of pixels, then it is considered to be noise-dominated and hence unusable.
| Quadrant | # 1 sec bins | Bins with >0 counts | Bins with >2000 counts | High rate bins dominated by noise | Noise dominated (total time) | Noise dominated (detector-on time) | Marked lightcurve |
|---|---|---|---|---|---|---|---|
| A | 9295 | 6432 | 1 | 1 | 0.01% | 0.02% | 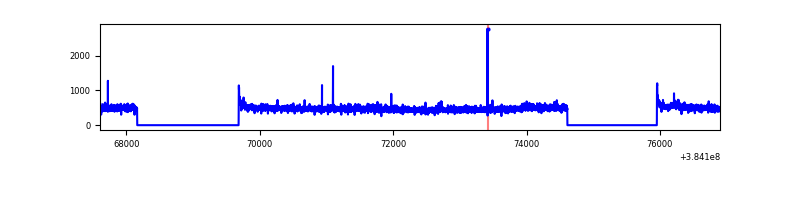 |
| B | 9295 | 6432 | 100 | 100 | 1.08% | 1.55% | 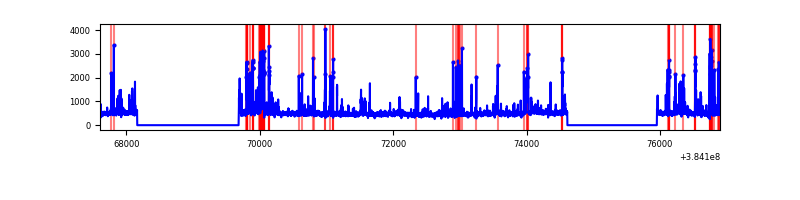 |
| C | 9295 | 6432 | 27 | 27 | 0.29% | 0.42% | 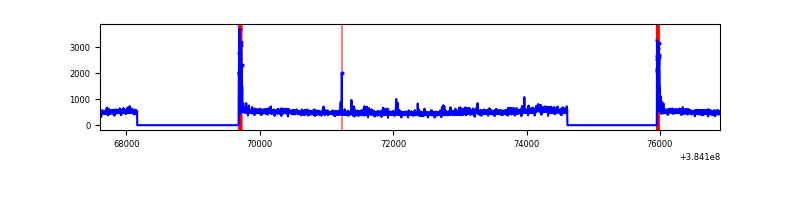 |
| D | 9295 | 6432 | 164 | 164 | 1.76% | 2.55% | 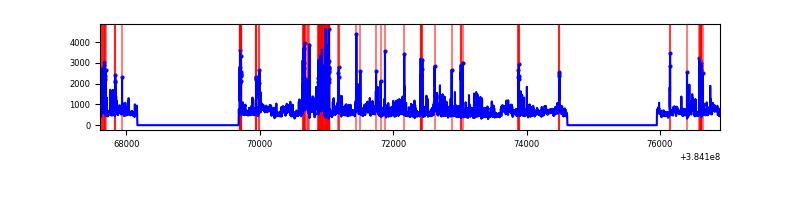 |
Top three noisy pixels from each quadrant. If the there are fewer than three noisy pixels in the level2.evt file, extra rows are filled as -1
| Pixel properties | Quadrant properties | ||||||
|---|---|---|---|---|---|---|---|
| Quadrant | DetID | PixID | Counts | Sigma | Mean | Median | Sigma |
| A | 15 | 169 | 72585 | 474.61 | 754 | 737 | 151.4 |
| A | 10 | 83 | 50880 | 331.23 | 754 | 737 | 151.4 |
| A | 15 | 174 | 19456 | 123.65 | 754 | 737 | 151.4 |
| B | 5 | 172 | 527058 | 3629.19 | 748 | 729 | 145.0 |
| B | 5 | 255 | 109041 | 746.84 | 748 | 729 | 145.0 |
| B | 4 | 232 | 88148 | 602.78 | 748 | 729 | 145.0 |
| C | 15 | 214 | 274053 | 1595.37 | 737 | 743 | 171.3 |
| C | 0 | 10 | 116894 | 678.0 | 737 | 743 | 171.3 |
| C | 14 | 67 | 66249 | 382.37 | 737 | 743 | 171.3 |
| D | 8 | 195 | 1019920 | 5772.49 | 724 | 707 | 176.6 |
| D | 13 | 249 | 296286 | 1674.06 | 724 | 707 | 176.6 |
| D | 2 | 249 | 253231 | 1430.21 | 724 | 707 | 176.6 |
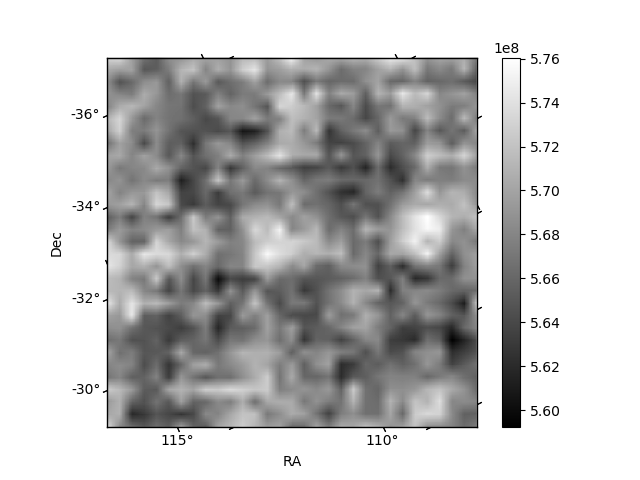
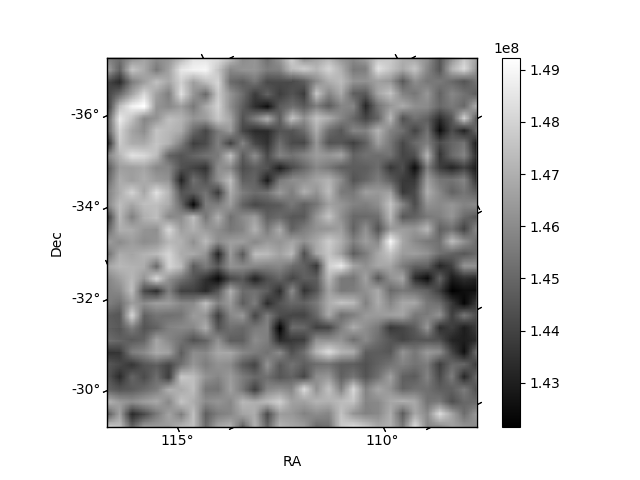
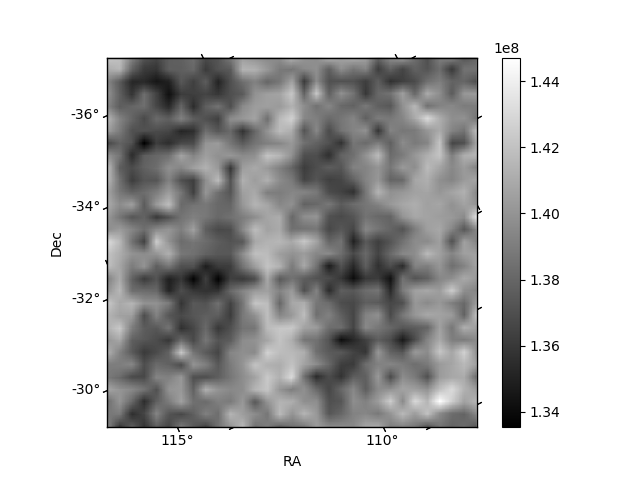
Histogram calculated using DETX and DETY for each event in the final _common_clean file
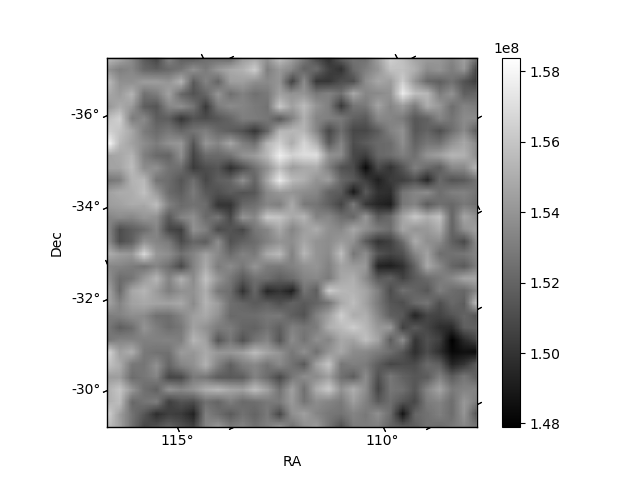
| Quadrant A | 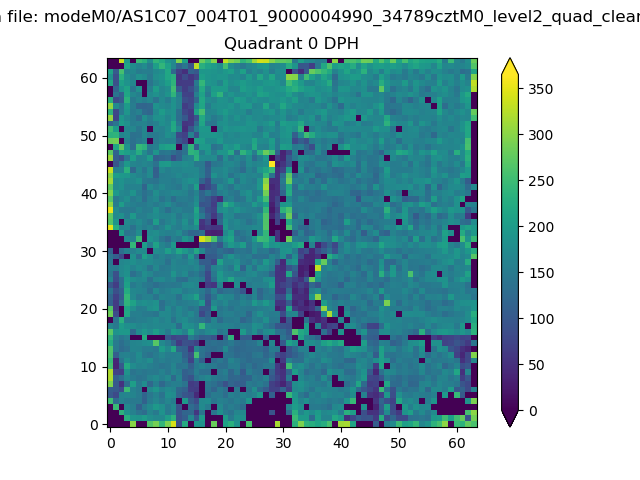 |
 |
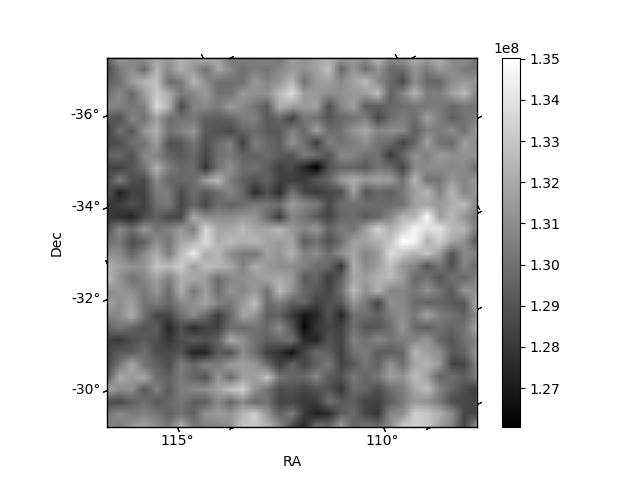
Quadrant B |
|---|---|---|---|
| Quadrant D | 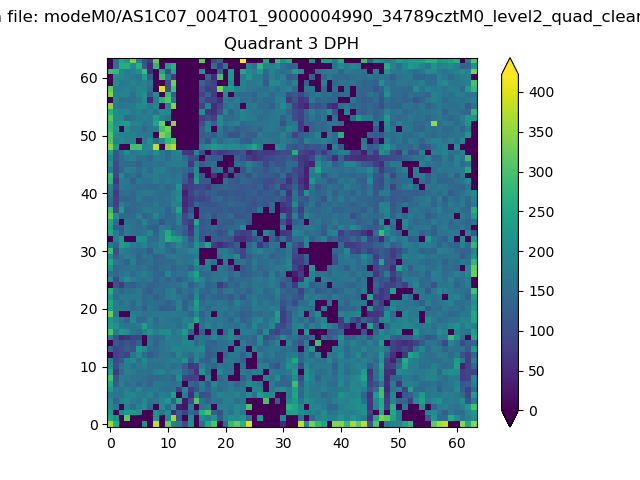 |
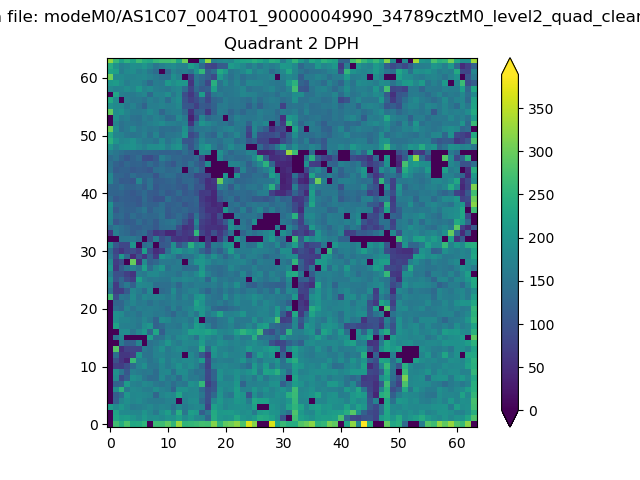 |
Quadrant C |
| Plot type | Count rate plots | Images |
|---|---|---|
| Comparison with Poisson distribution Blue bars denote a histogram of data divided into 1 sec bins. Red curve is a Poisson curve with rate = median count rate of data. |
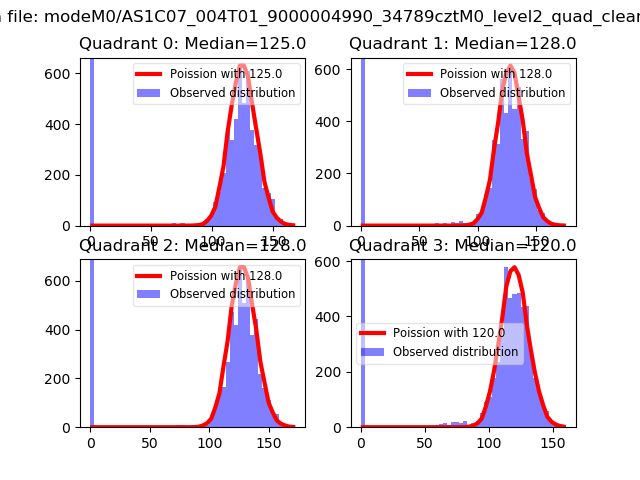 |
 |
| Quadrant-wise count rates Data is divided into 100 sec bins |
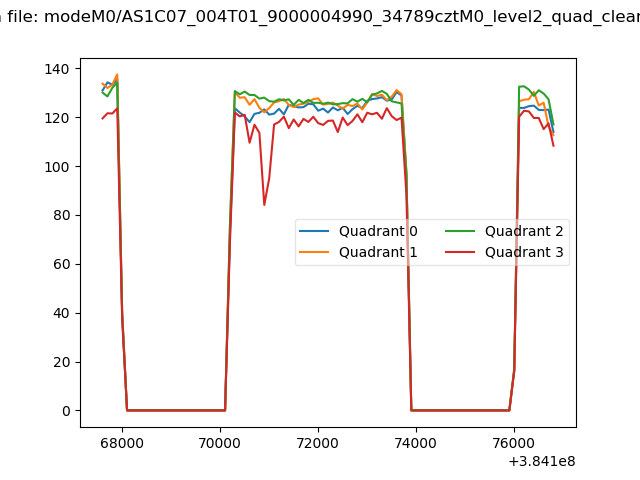 |
|
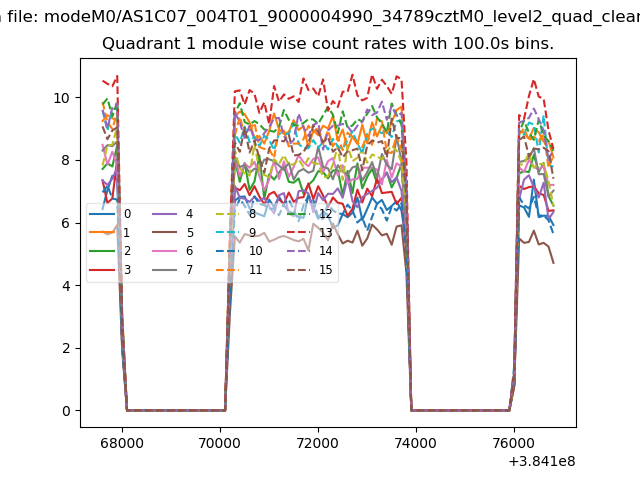
| Module-wise count rates for Quadrant A Data is divided into 100 sec bins |
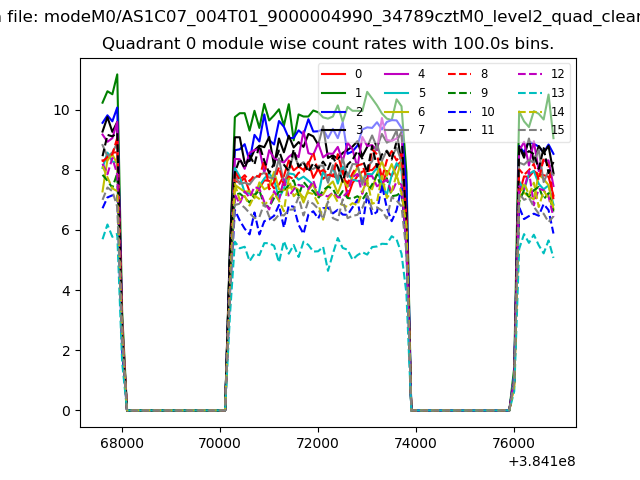 |
 |
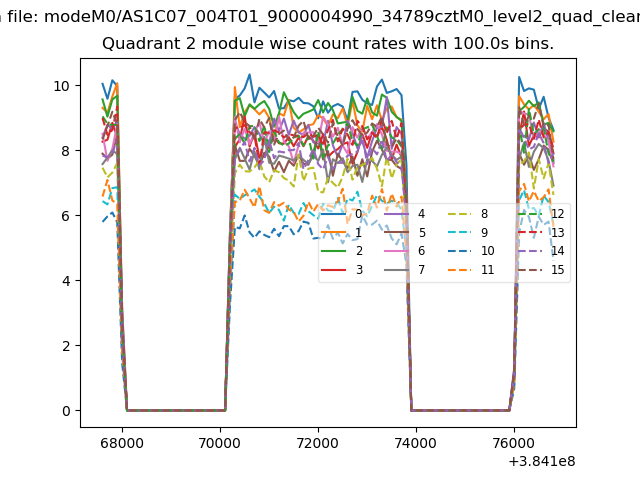
| Module-wise count rates for Quadrant B Data is divided into 100 sec bins |
 |
 |
| Module-wise count rates for Quadrant C Data is divided into 100 sec bins |
 |
 |
| Module-wise count rates for Quadrant D Data is divided into 100 sec bins |
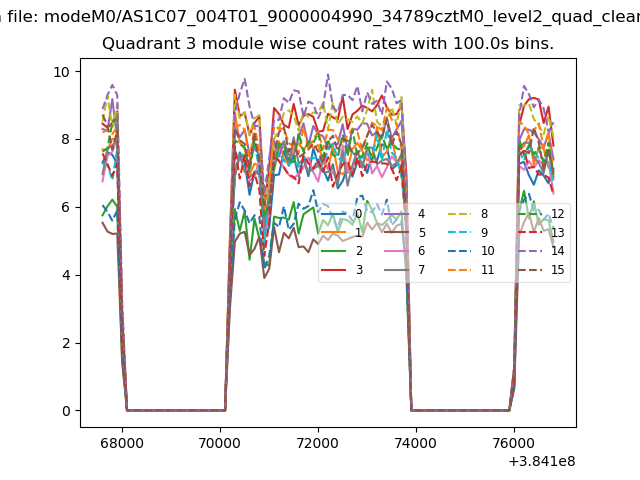 |
 |
| Parameter | Plot |
|---|---|
| CZT HV Monitor | 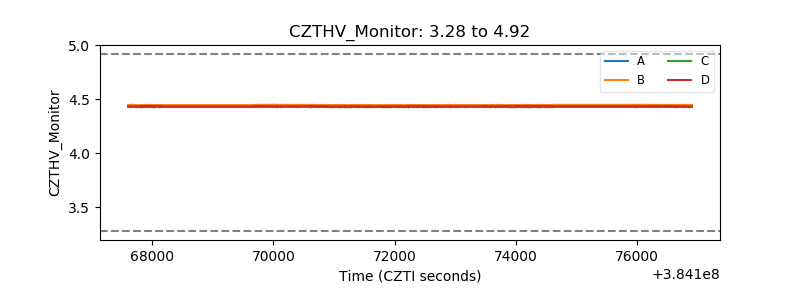 |
| D_VDD | 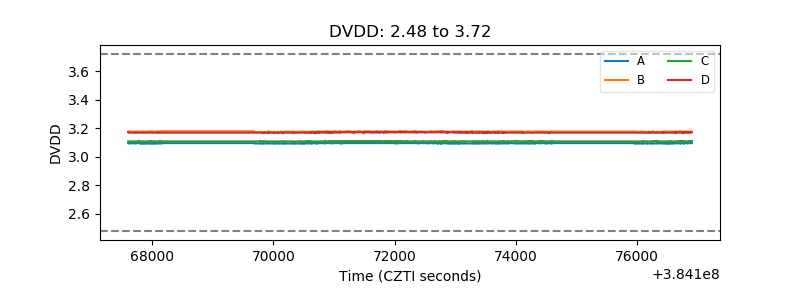 |
| Temperature 1 | 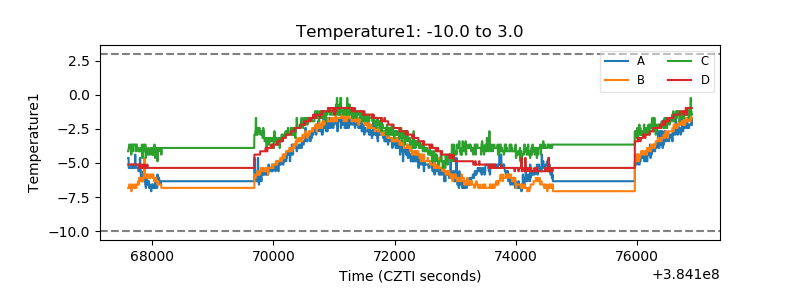 |
| Veto HV Monitor | 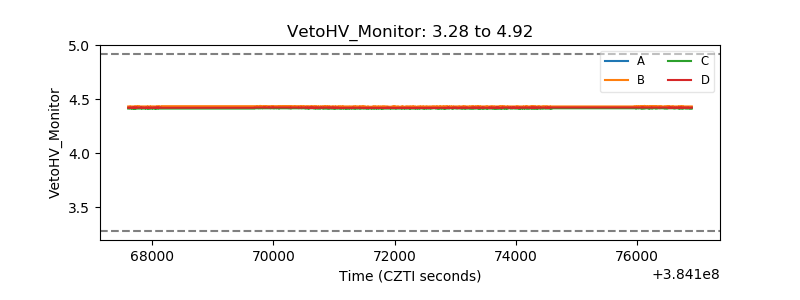 |
| Veto LLD | 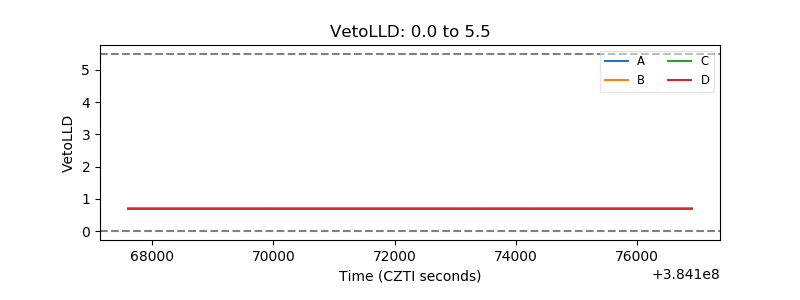 |
| Alpha Counter | 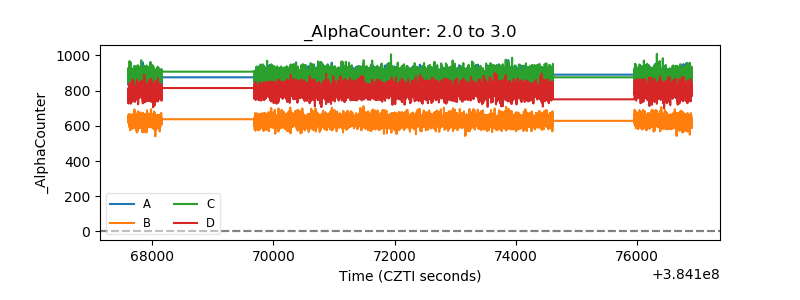 |
| _CPM_Rate | 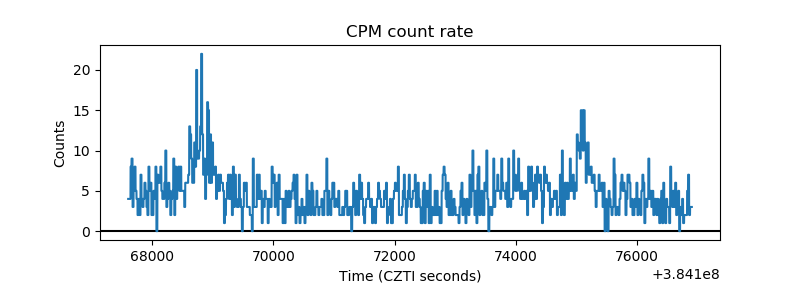 |
| CZT Counter | 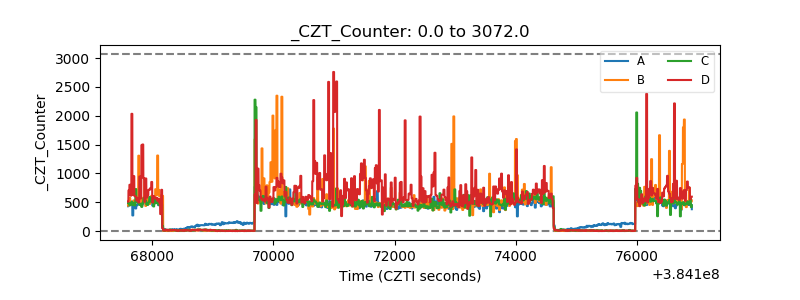 |
| +2.5 Volts monitor | 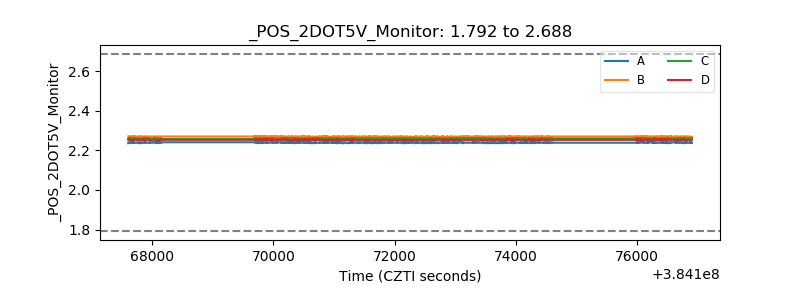 |
| +5 Volts monitor | 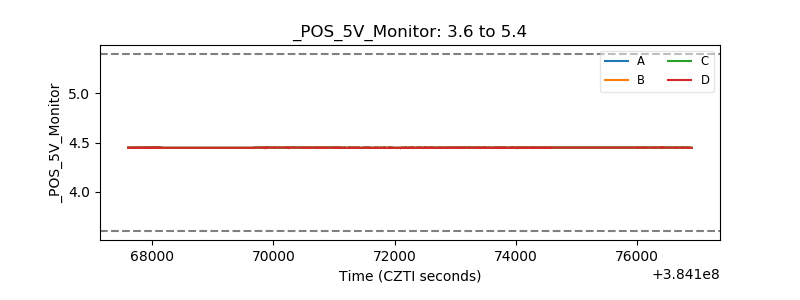 |
| _ROLL_ROT | 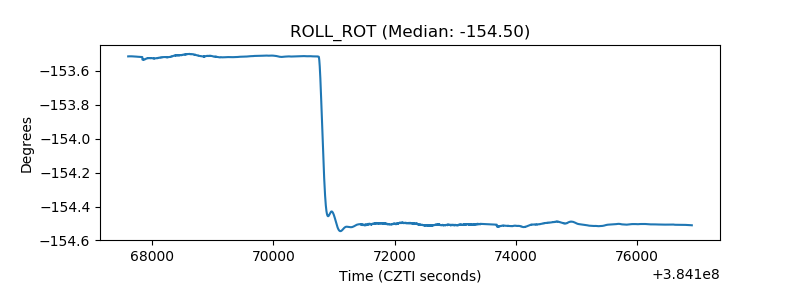 |
| _Roll_DEC | 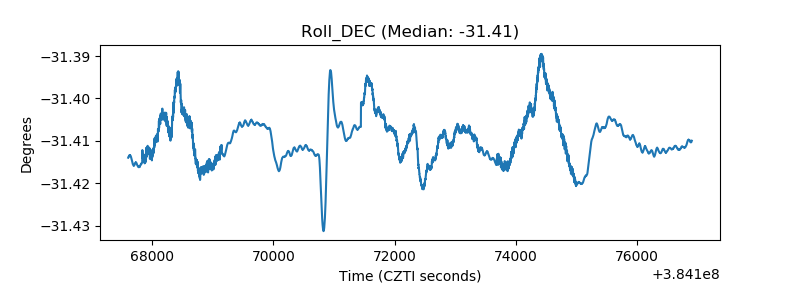 |
| _Roll_RA | 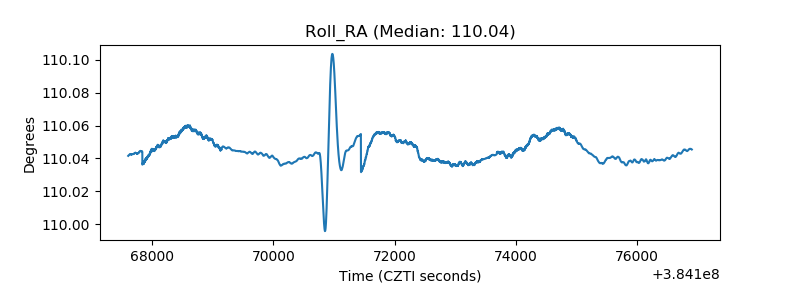 |
| Veto Counter | 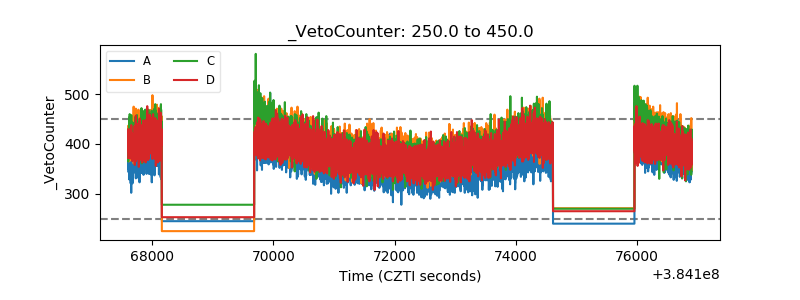 |