| Param | Original file | Final file |
|---|---|---|
| Filename | modeM0/AS1C07_004T01_9000004990_34788cztM0_level2.evt | modeM0/AS1C07_004T01_9000004990_34788cztM0_level2_quad_clean.evt |
| Size (bytes) | 553,694,400 | 93,009,600 |
| Size | 528.0 MB | 88.7 MB |
| Events in quadrant A | 4,007,091 | 576,222 |
| Events in quadrant B | 4,256,483 | 602,167 |
| Events in quadrant C | 3,311,591 | 616,026 |
| Events in quadrant D | 4,760,454 | 576,293 |
| Mode M9 | |||
|---|---|---|---|
| Quadrant | BADHDUFLAG | Total packets | Discarded packets |
| A | 0 | 33 | 0 |
| B | 0 | 33 | 0 |
| C | 0 | 33 | 0 |
| D | 0 | 33 | 0 |
| Mode M0 | |||
|---|---|---|---|
| Quadrant | BADHDUFLAG | Total packets | Discarded packets |
| A | 0 | 15852 | 3 |
| B | 0 | 16714 | 2 |
| C | 0 | 13403 | 2 |
| D | 0 | 18418 | 2 |
| Mode SS | |||
|---|---|---|---|
| Quadrant | BADHDUFLAG | Total packets | Discarded packets |
| A | 0 | 134 | 0 |
| B | 0 | 134 | 0 |
| C | 0 | 134 | 0 |
| D | 0 | 134 | 0 |
| Quadrant | Total seconds | Saturated seconds | Saturation percentage |
|---|---|---|---|
| A | 6382 | 403 | 6.314635% |
| B | 6382 | 333 | 5.217800% |
| C | 6382 | 42 | 0.658101% |
| D | 6382 | 120 | 1.880288% |
Noise dominated data is calculated using 1-second bins in cleaned event files. If a bin has >2000 counts, and if more than 50% of those come from <1% of pixels, then it is considered to be noise-dominated and hence unusable.
| Quadrant | # 1 sec bins | Bins with >0 counts | Bins with >2000 counts | High rate bins dominated by noise | Noise dominated (total time) | Noise dominated (detector-on time) | Marked lightcurve |
|---|---|---|---|---|---|---|---|
| A | 9758 | 6384 | 362 | 362 | 3.71% | 5.67% | 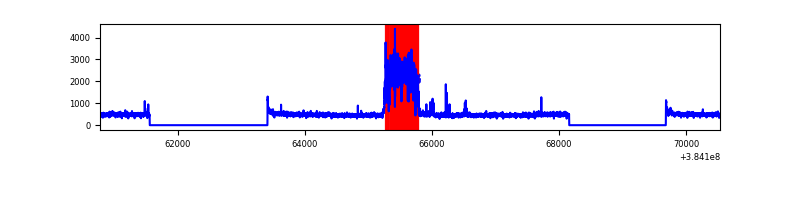 |
| B | 9758 | 6384 | 225 | 225 | 2.31% | 3.52% | 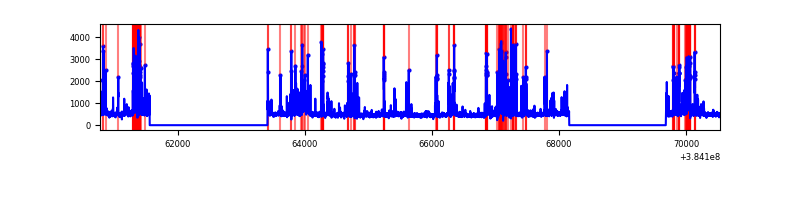 |
| C | 9758 | 6384 | 29 | 29 | 0.30% | 0.45% | 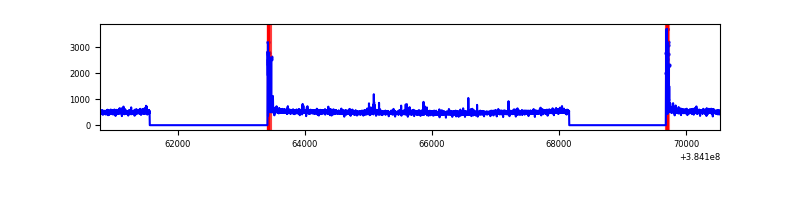 |
| D | 9758 | 6384 | 102 | 102 | 1.05% | 1.60% | 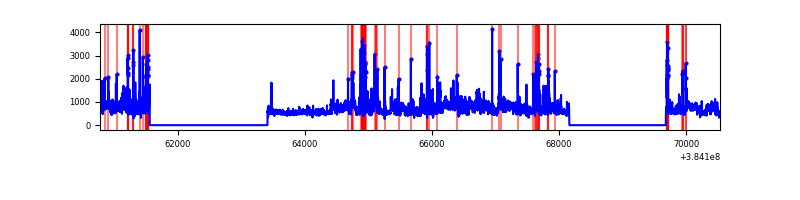 |
Top three noisy pixels from each quadrant. If the there are fewer than three noisy pixels in the level2.evt file, extra rows are filled as -1
| Pixel properties | Quadrant properties | ||||||
|---|---|---|---|---|---|---|---|
| Quadrant | DetID | PixID | Counts | Sigma | Mean | Median | Sigma |
| A | 7 | 32 | 1043799 | 7062.05 | 731 | 715 | 147.7 |
| A | 15 | 169 | 59780 | 399.89 | 731 | 715 | 147.7 |
| A | 10 | 83 | 51022 | 340.6 | 731 | 715 | 147.7 |
| B | 5 | 172 | 917052 | 6427.91 | 737 | 719 | 142.6 |
| B | 5 | 255 | 185122 | 1293.55 | 737 | 719 | 142.6 |
| B | 4 | 232 | 126736 | 883.99 | 737 | 719 | 142.6 |
| C | 15 | 214 | 274096 | 1594.43 | 734 | 741 | 171.4 |
| C | 0 | 10 | 123996 | 718.92 | 734 | 741 | 171.4 |
| C | 14 | 67 | 22795 | 128.63 | 734 | 741 | 171.4 |
| D | 8 | 195 | 1252674 | 7044.6 | 727 | 709 | 177.7 |
| D | 2 | 249 | 264944 | 1486.81 | 727 | 709 | 177.7 |
| D | 13 | 249 | 144417 | 808.62 | 727 | 709 | 177.7 |
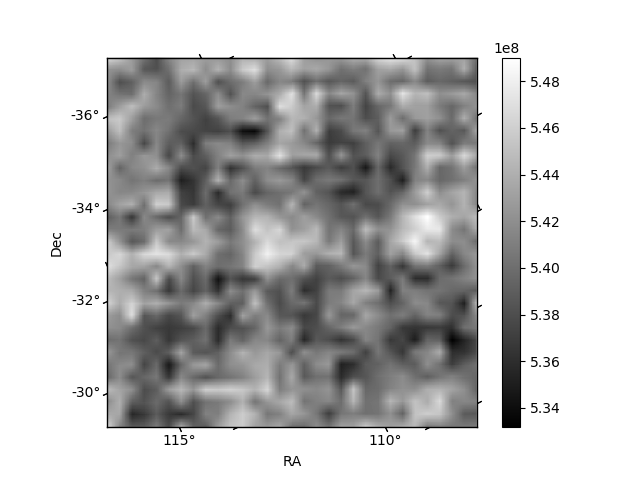
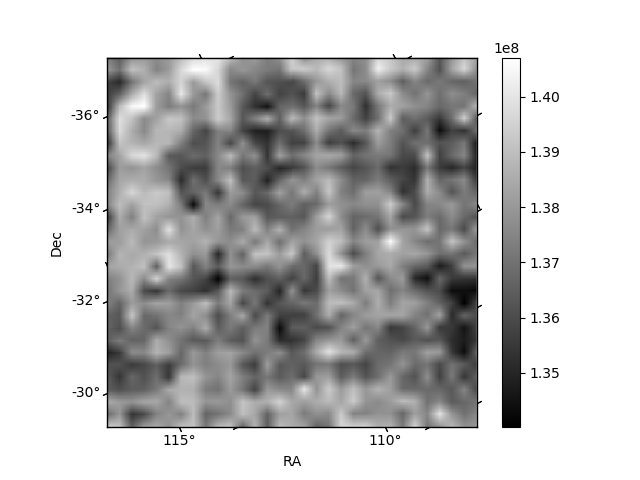
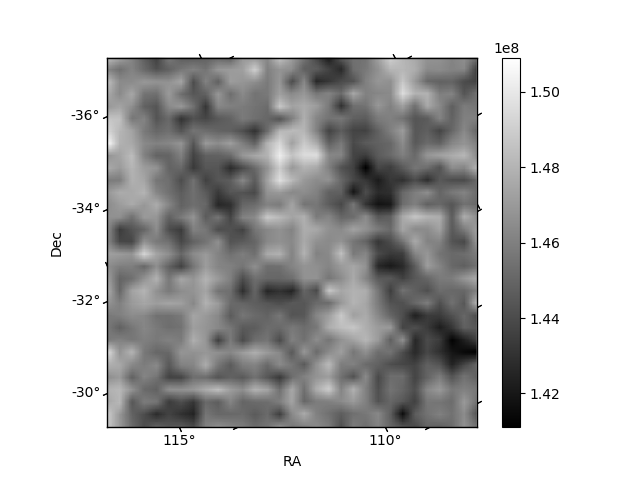
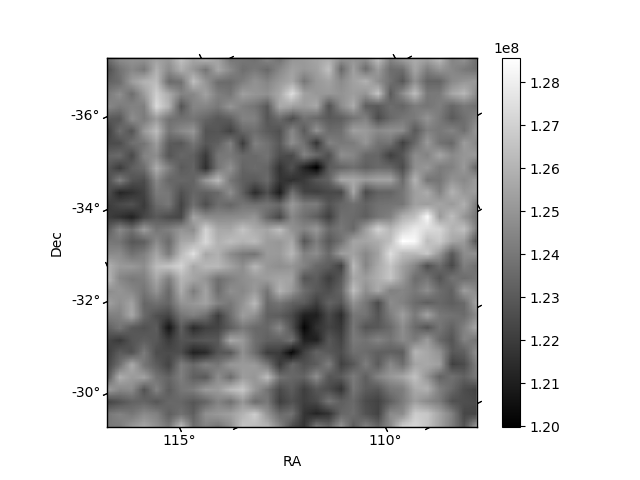
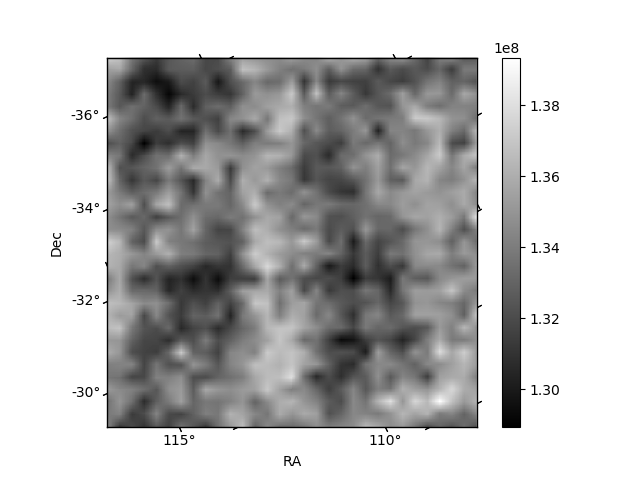
Histogram calculated using DETX and DETY for each event in the final _common_clean file
| Quadrant A | 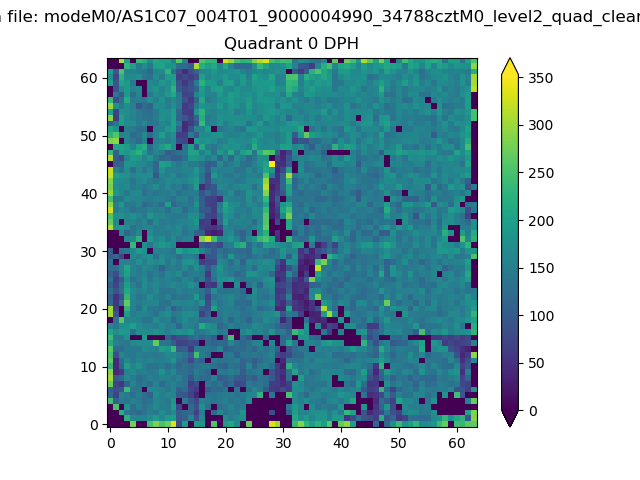 |
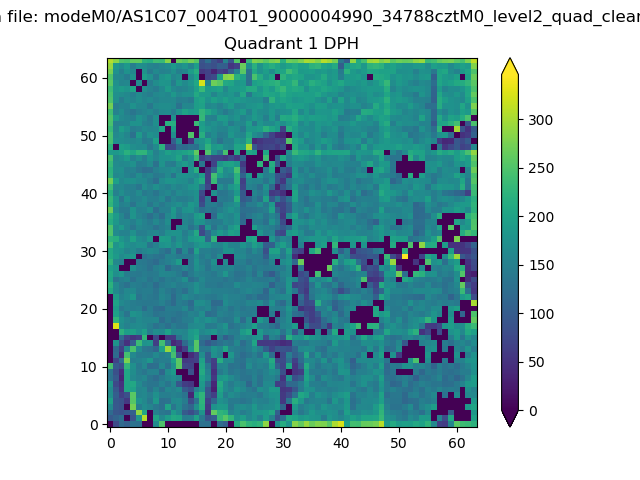 |
Quadrant B |
|---|---|---|---|
| Quadrant D | 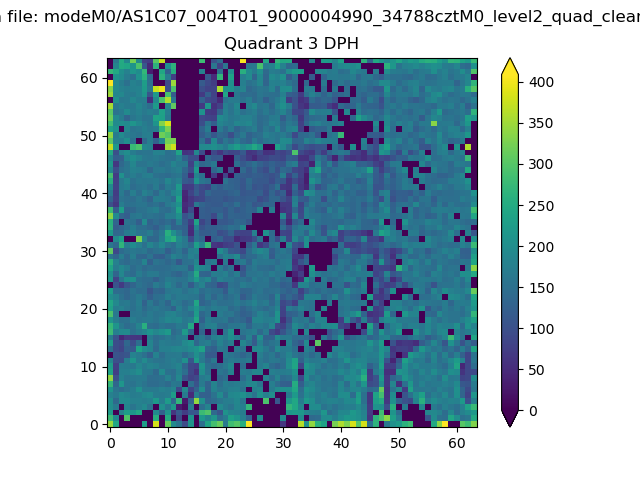 |
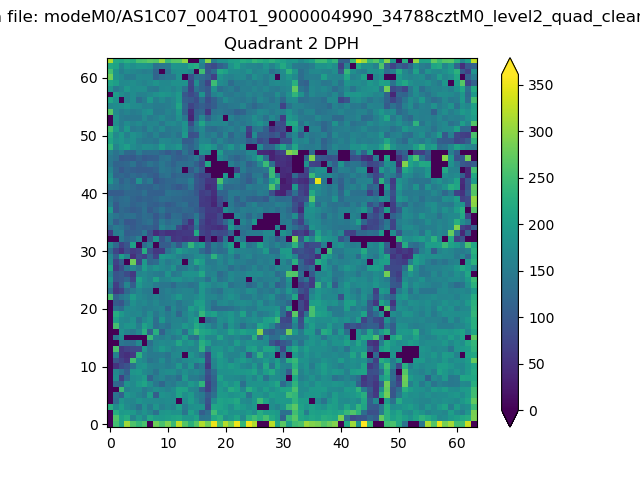 |
Quadrant C |
| Plot type | Count rate plots | Images |
|---|---|---|
| Comparison with Poisson distribution Blue bars denote a histogram of data divided into 1 sec bins. Red curve is a Poisson curve with rate = median count rate of data. |
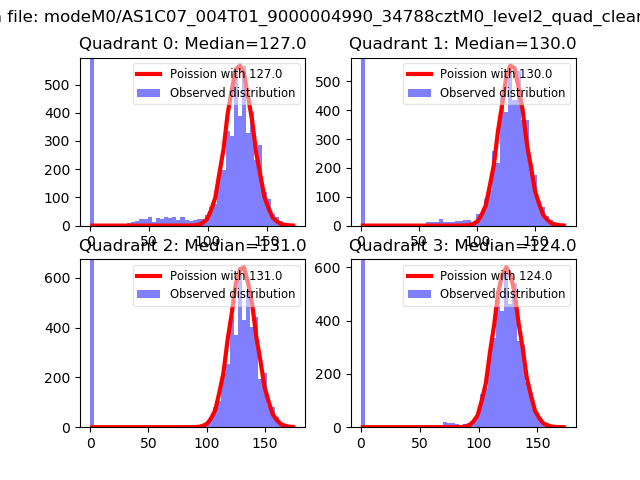 |
 |
| Quadrant-wise count rates Data is divided into 100 sec bins |
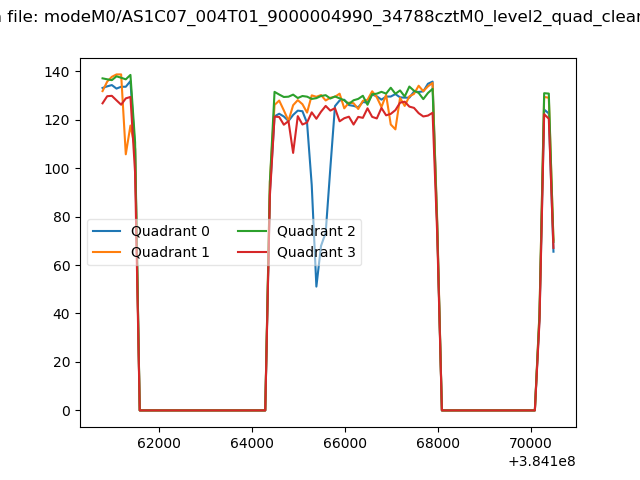 |
|
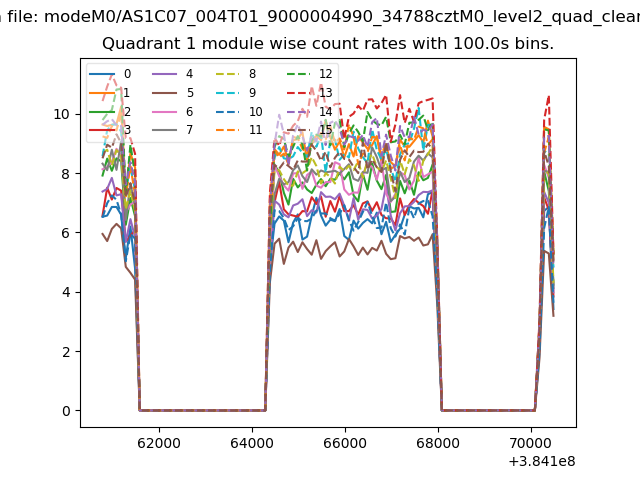
| Module-wise count rates for Quadrant A Data is divided into 100 sec bins |
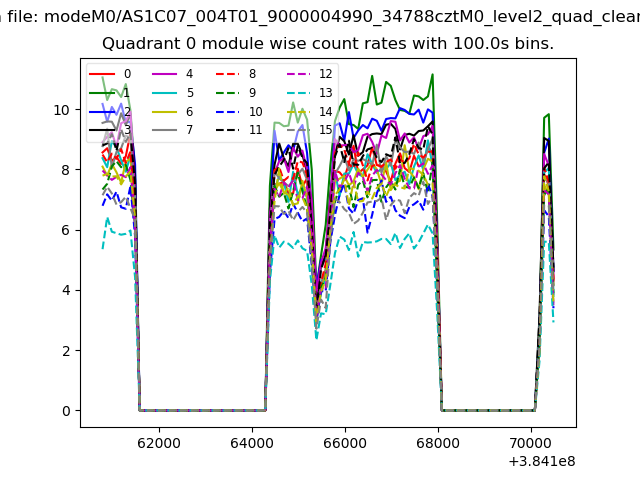 |
 |
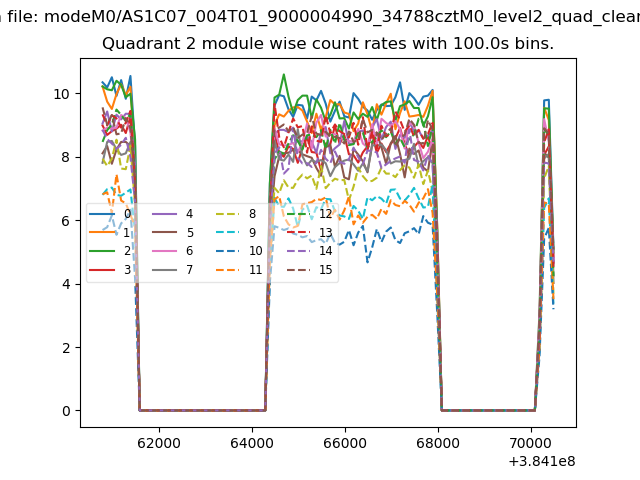
| Module-wise count rates for Quadrant B Data is divided into 100 sec bins |
 |
 |
| Module-wise count rates for Quadrant C Data is divided into 100 sec bins |
 |
 |
| Module-wise count rates for Quadrant D Data is divided into 100 sec bins |
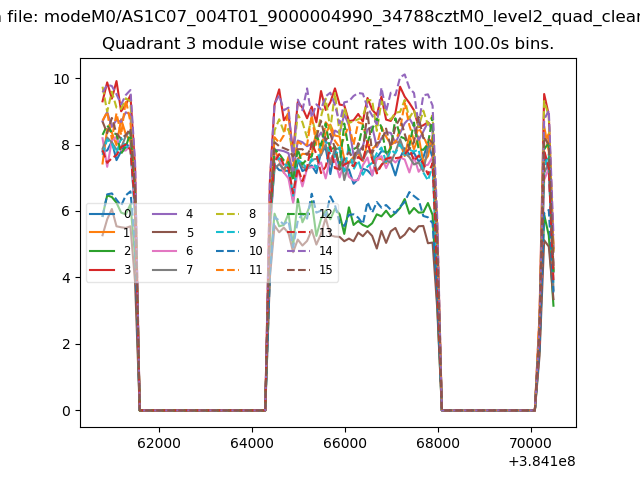 |
 |
| Parameter | Plot |
|---|---|
| CZT HV Monitor | 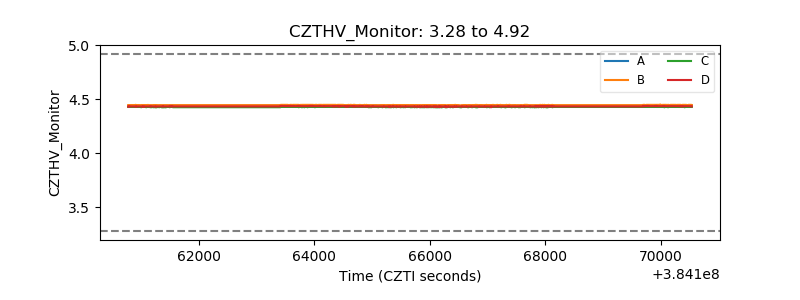 |
| D_VDD | 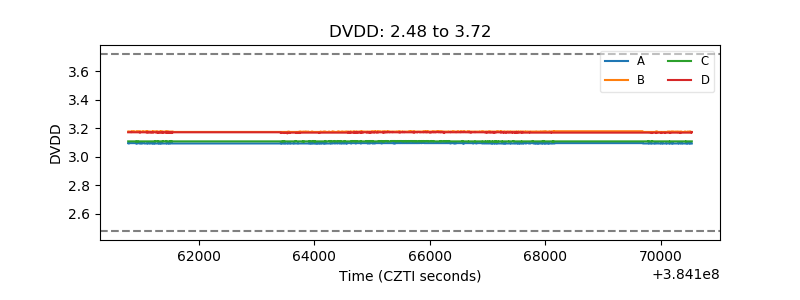 |
| Temperature 1 | 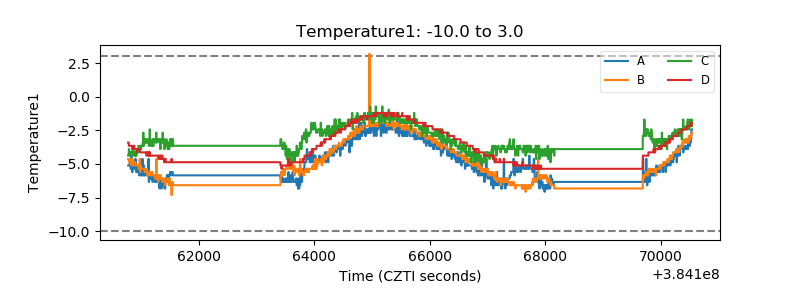 |
| Veto HV Monitor | 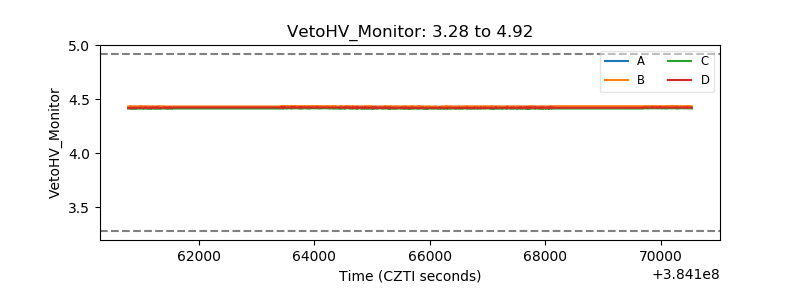 |
| Veto LLD | 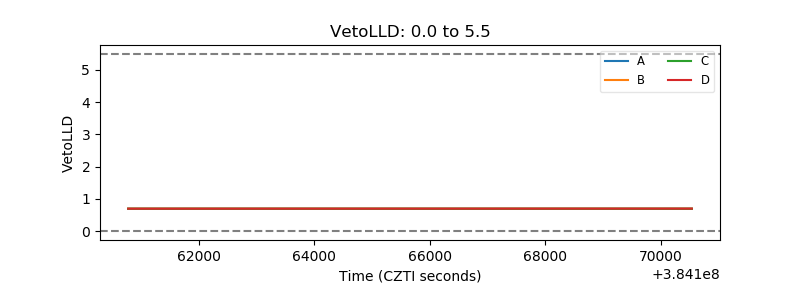 |
| Alpha Counter | 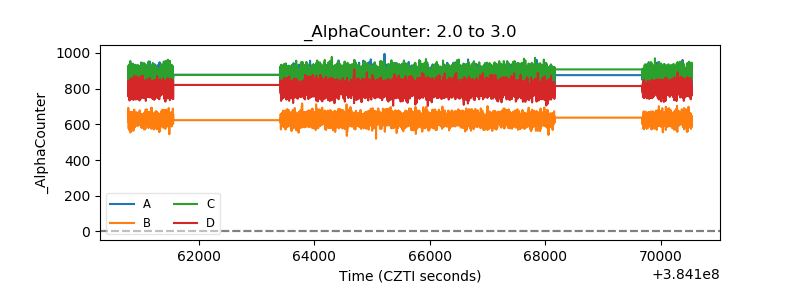 |
| _CPM_Rate | 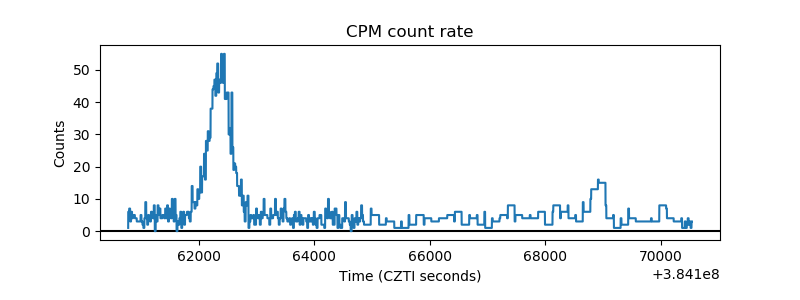 |
| CZT Counter | 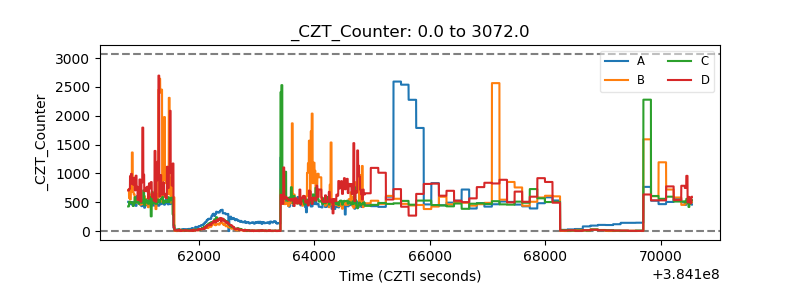 |
| +2.5 Volts monitor | 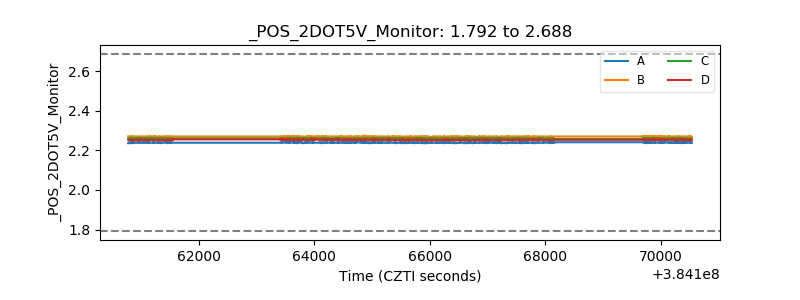 |
| +5 Volts monitor | 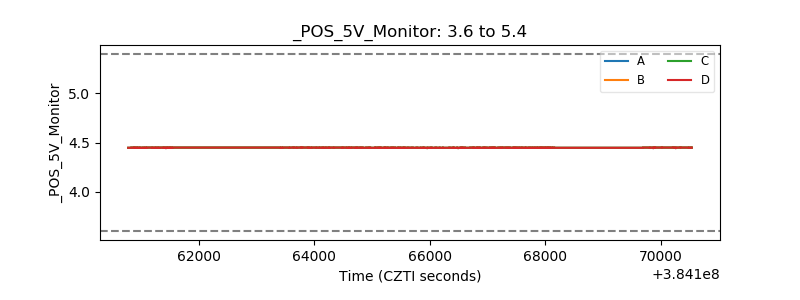 |
| _ROLL_ROT | 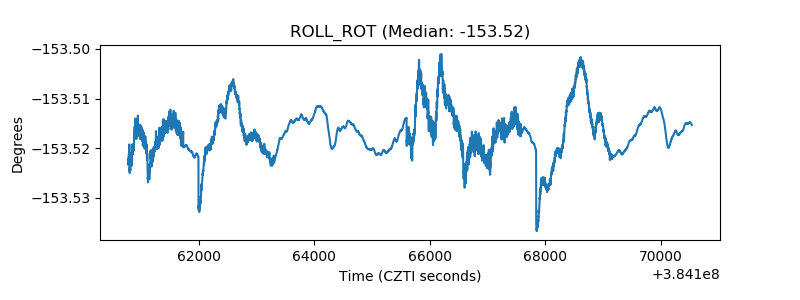 |
| _Roll_DEC | 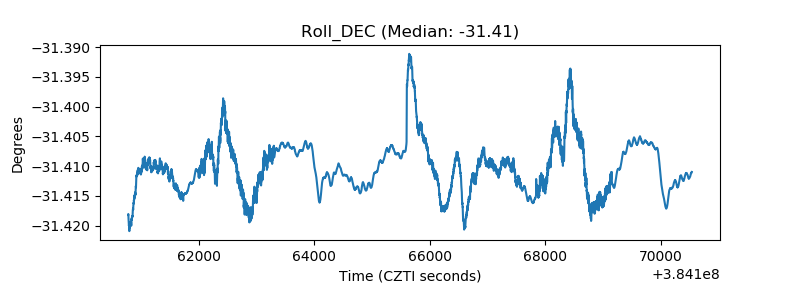 |
| _Roll_RA | 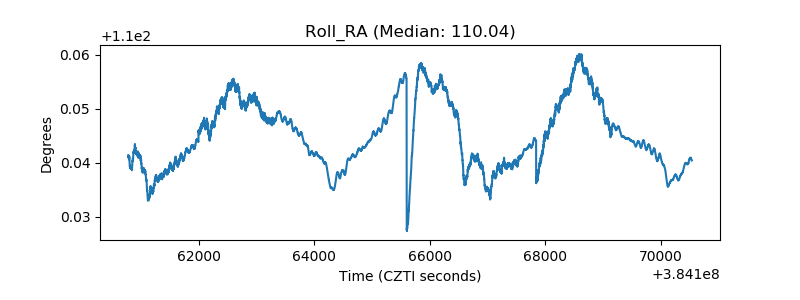 |
| Veto Counter | 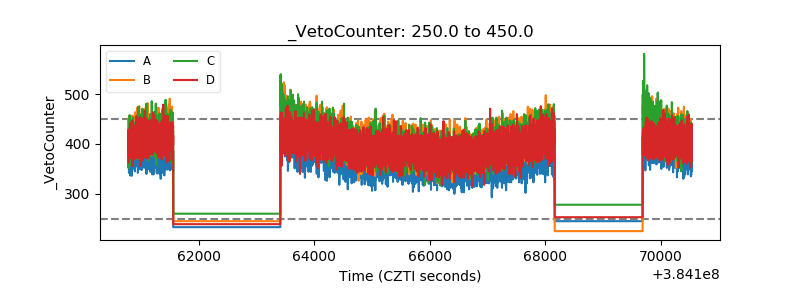 |