| Param | Original file | Final file |
|---|---|---|
| Filename | modeM0/AS1C07_004T01_9000004990_34786cztM0_level2.evt | modeM0/AS1C07_004T01_9000004990_34786cztM0_level2_quad_clean.evt |
| Size (bytes) | 450,316,800 | 53,081,280 |
| Size | 429.5 MB | 50.6 MB |
| Events in quadrant A | 2,557,598 | 322,152 |
| Events in quadrant B | 3,684,562 | 312,477 |
| Events in quadrant C | 2,779,462 | 333,199 |
| Events in quadrant D | 4,274,155 | 285,470 |
| Mode M9 | |||
|---|---|---|---|
| Quadrant | BADHDUFLAG | Total packets | Discarded packets |
| A | 0 | 39 | 0 |
| B | 0 | 39 | 0 |
| C | 0 | 39 | 0 |
| D | 0 | 40 | 0 |
| Mode M0 | |||
|---|---|---|---|
| Quadrant | BADHDUFLAG | Total packets | Discarded packets |
| A | 0 | 10412 | 3 |
| B | 0 | 13944 | 2 |
| C | 0 | 10881 | 2 |
| D | 0 | 16188 | 2 |
| Mode SS | |||
|---|---|---|---|
| Quadrant | BADHDUFLAG | Total packets | Discarded packets |
| A | 0 | 102 | 0 |
| B | 0 | 102 | 0 |
| C | 0 | 102 | 0 |
| D | 0 | 102 | 0 |
| Quadrant | Total seconds | Saturated seconds | Saturation percentage |
|---|---|---|---|
| A | 5042 | 21 | 0.416501% |
| B | 5042 | 355 | 7.040857% |
| C | 5042 | 35 | 0.694169% |
| D | 5042 | 367 | 7.278858% |
Noise dominated data is calculated using 1-second bins in cleaned event files. If a bin has >2000 counts, and if more than 50% of those come from <1% of pixels, then it is considered to be noise-dominated and hence unusable.
| Quadrant | # 1 sec bins | Bins with >0 counts | Bins with >2000 counts | High rate bins dominated by noise | Noise dominated (total time) | Noise dominated (detector-on time) | Marked lightcurve |
|---|---|---|---|---|---|---|---|
| A | 7135 | 5043 | 14 | 14 | 0.20% | 0.28% | 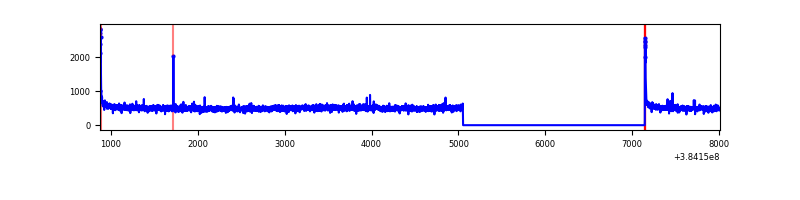 |
| B | 7135 | 5043 | 270 | 270 | 3.78% | 5.35% | 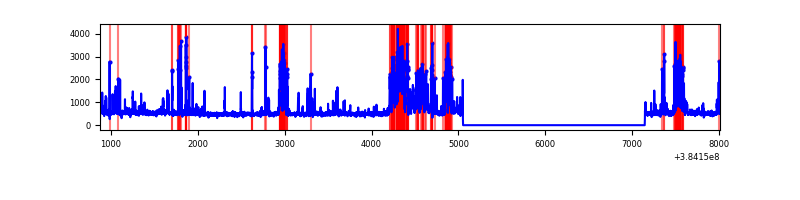 |
| C | 7135 | 5043 | 14 | 14 | 0.20% | 0.28% | 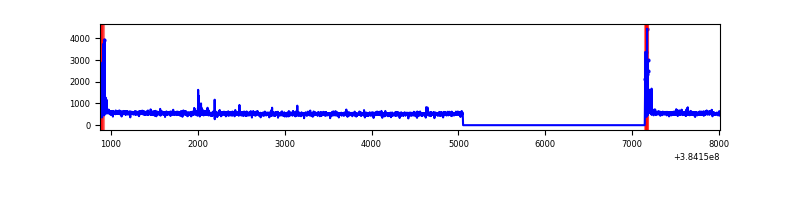 |
| D | 7135 | 5043 | 296 | 296 | 4.15% | 5.87% | 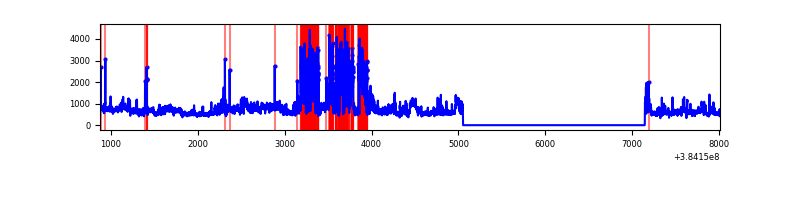 |
Top three noisy pixels from each quadrant. If the there are fewer than three noisy pixels in the level2.evt file, extra rows are filled as -1
| Pixel properties | Quadrant properties | ||||||
|---|---|---|---|---|---|---|---|
| Quadrant | DetID | PixID | Counts | Sigma | Mean | Median | Sigma |
| A | 10 | 83 | 46154 | 363.12 | 627 | 615 | 125.4 |
| A | 8 | 192 | 37746 | 296.07 | 627 | 615 | 125.4 |
| A | 15 | 169 | 32646 | 255.41 | 627 | 615 | 125.4 |
| B | 5 | 172 | 1118913 | 9616.53 | 613 | 599 | 116.3 |
| B | 5 | 255 | 72939 | 622.06 | 613 | 599 | 116.3 |
| B | 0 | 218 | 27415 | 230.59 | 613 | 599 | 116.3 |
| C | 15 | 214 | 216827 | 1521.63 | 618 | 623 | 142.1 |
| C | 0 | 10 | 97343 | 680.71 | 618 | 623 | 142.1 |
| C | 3 | 233 | 18225 | 123.88 | 618 | 623 | 142.1 |
| D | 8 | 195 | 946518 | 6631.42 | 593 | 578 | 142.6 |
| D | 2 | 249 | 935814 | 6556.38 | 593 | 578 | 142.6 |
| D | 10 | 204 | 29123 | 200.11 | 593 | 578 | 142.6 |
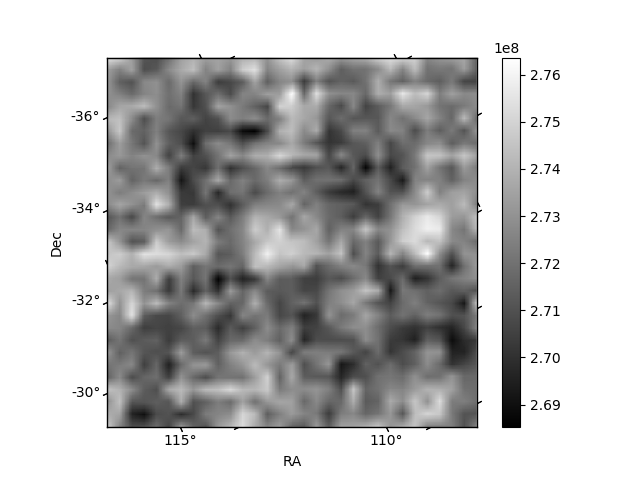
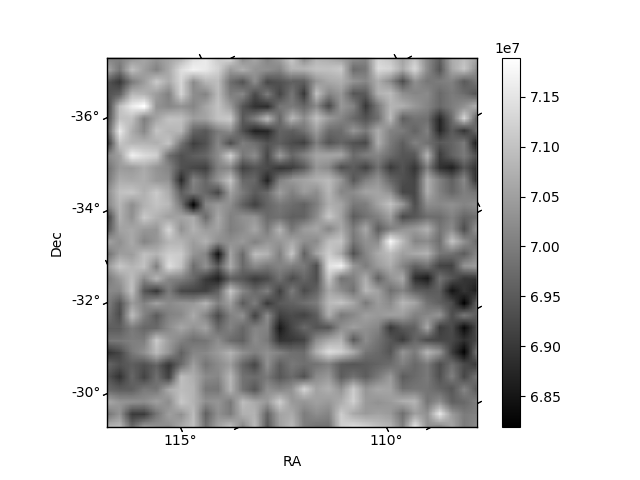
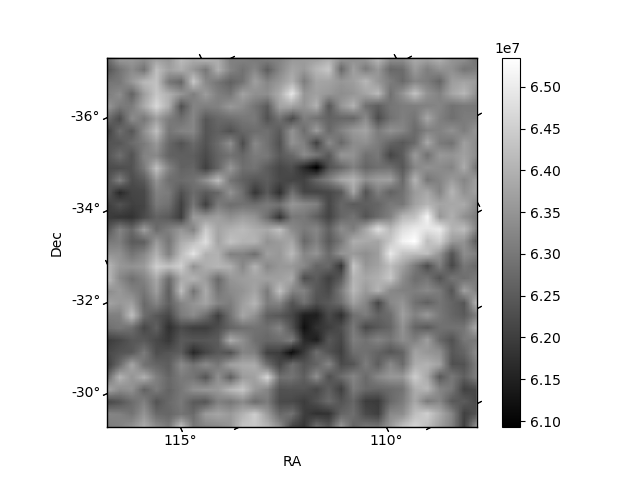
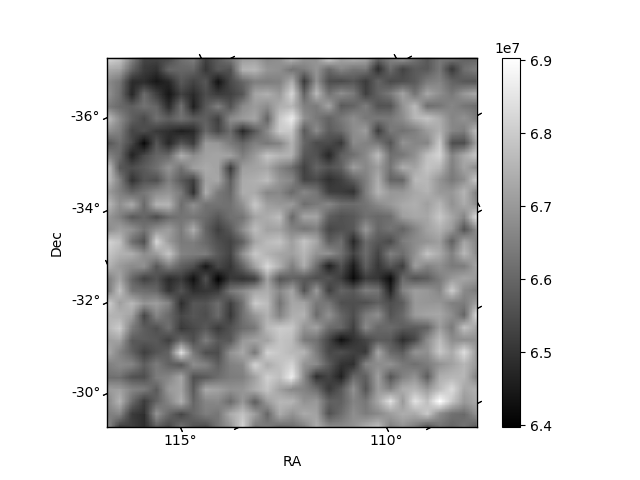
Histogram calculated using DETX and DETY for each event in the final _common_clean file
| Quadrant A | 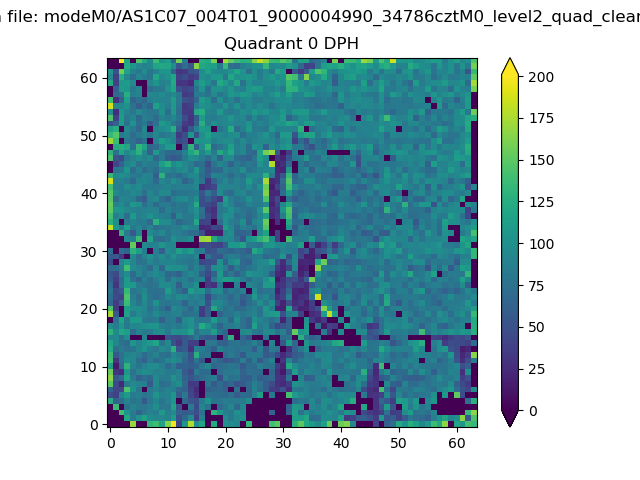 |
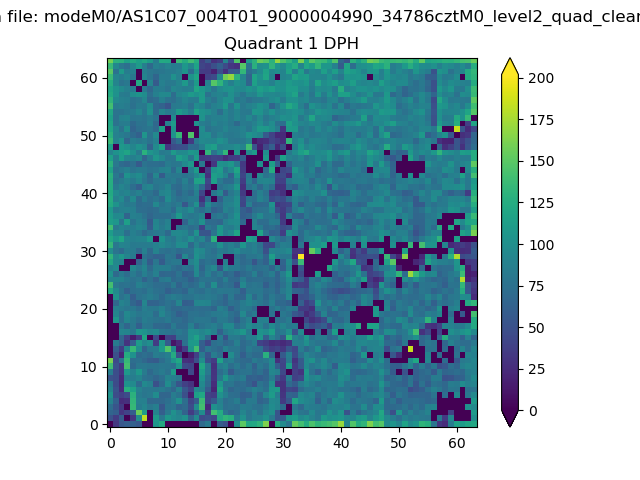 |
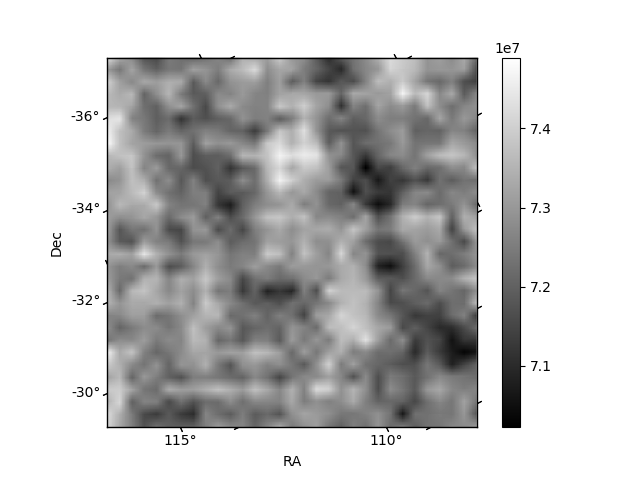
Quadrant B |
|---|---|---|---|
| Quadrant D | 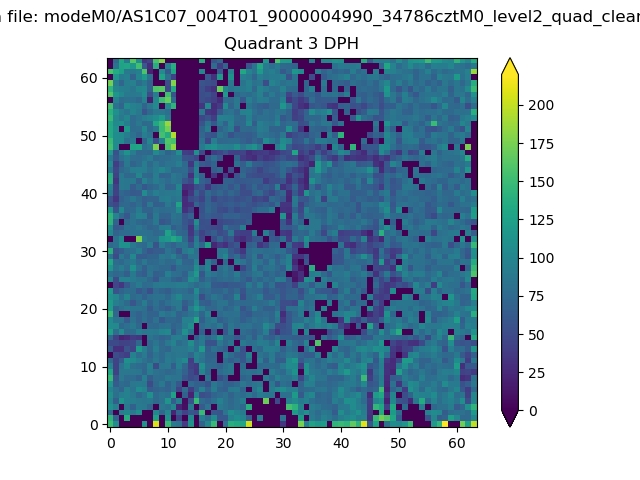 |
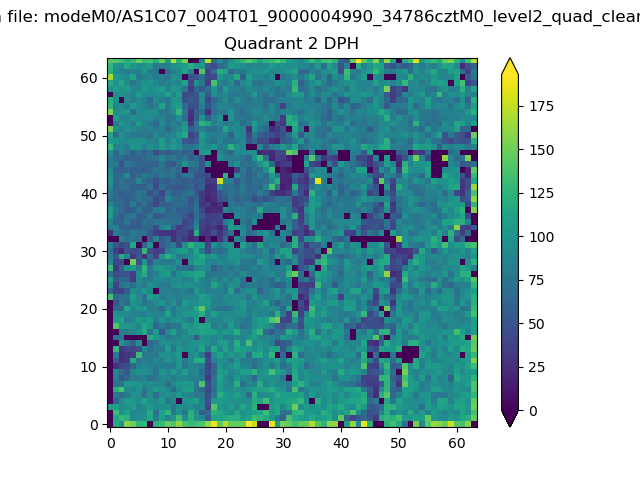 |
Quadrant C |
| Plot type | Count rate plots | Images |
|---|---|---|
| Comparison with Poisson distribution Blue bars denote a histogram of data divided into 1 sec bins. Red curve is a Poisson curve with rate = median count rate of data. |
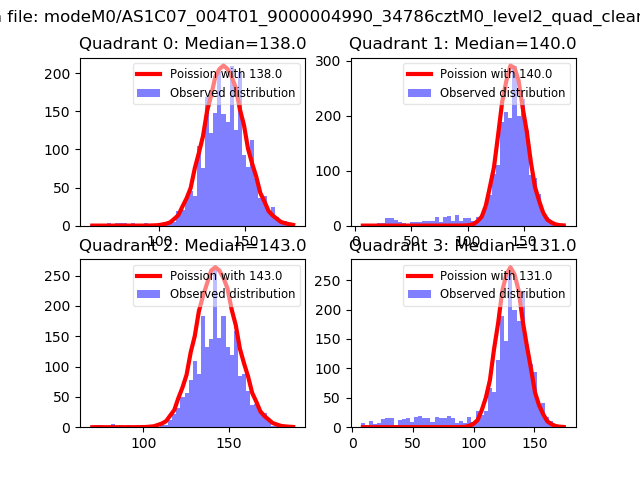 |
 |
| Quadrant-wise count rates Data is divided into 100 sec bins |
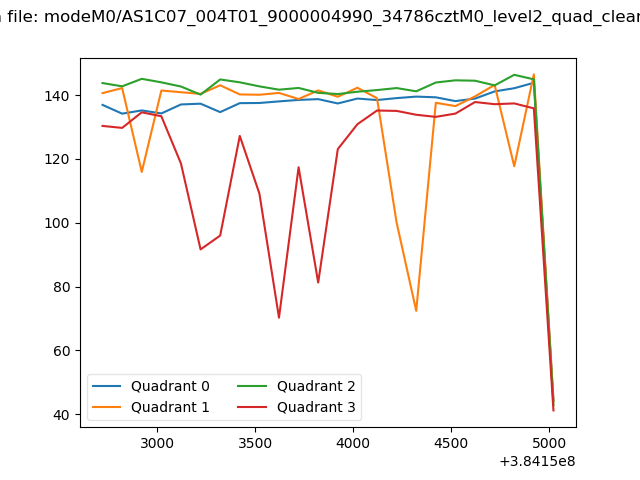 |
|
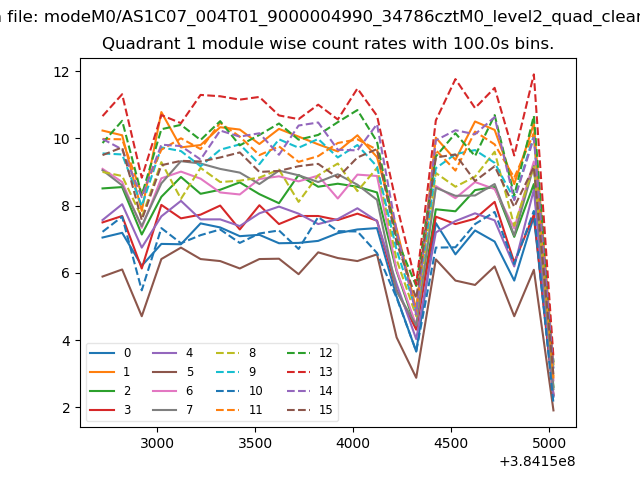
| Module-wise count rates for Quadrant A Data is divided into 100 sec bins |
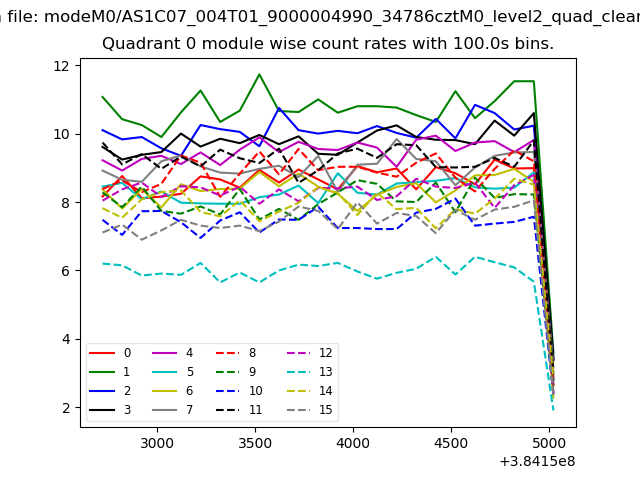 |
 |
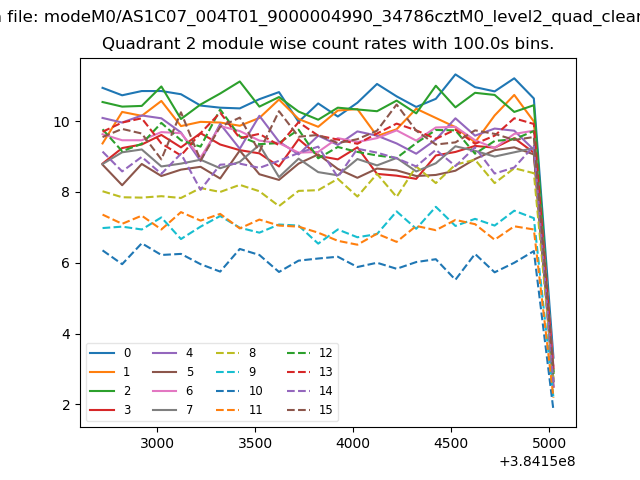
| Module-wise count rates for Quadrant B Data is divided into 100 sec bins |
 |
 |
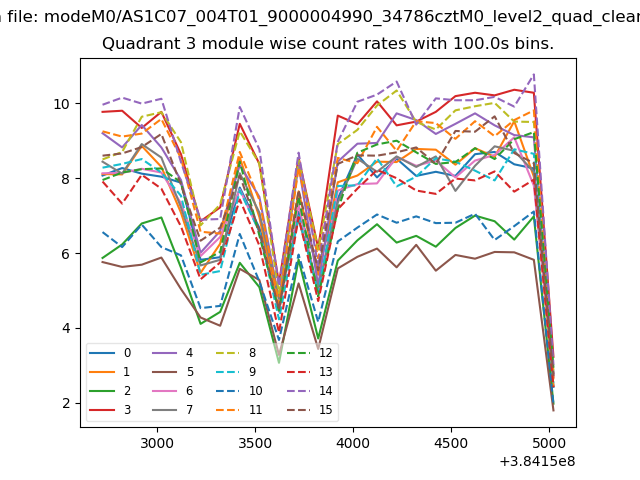
| Module-wise count rates for Quadrant C Data is divided into 100 sec bins |
 |
 |
| Module-wise count rates for Quadrant D Data is divided into 100 sec bins |
 |
 |
| Parameter | Plot |
|---|---|
| CZT HV Monitor | 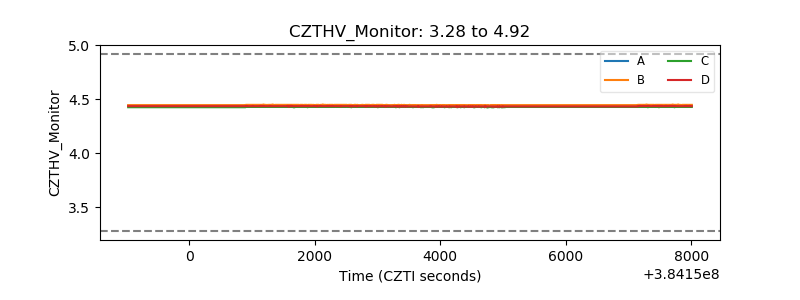 |
| D_VDD | 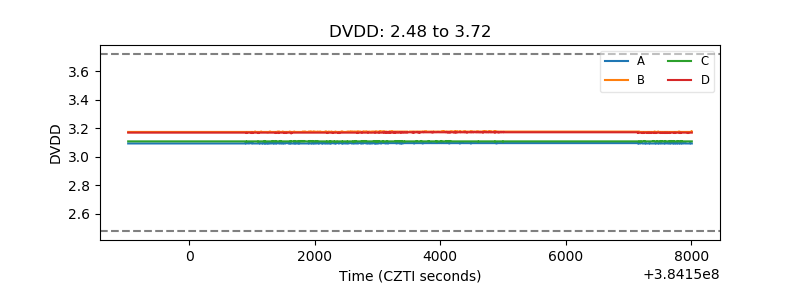 |
| Temperature 1 | 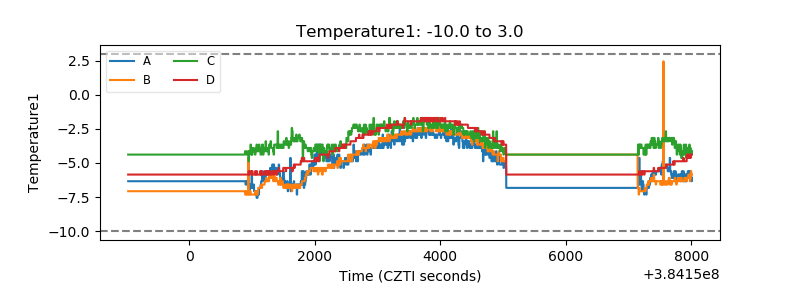 |
| Veto HV Monitor | 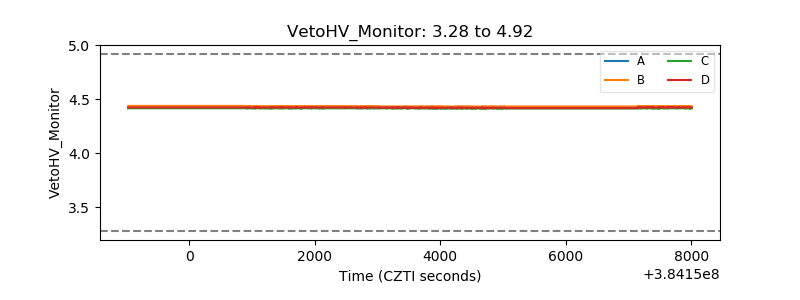 |
| Veto LLD | 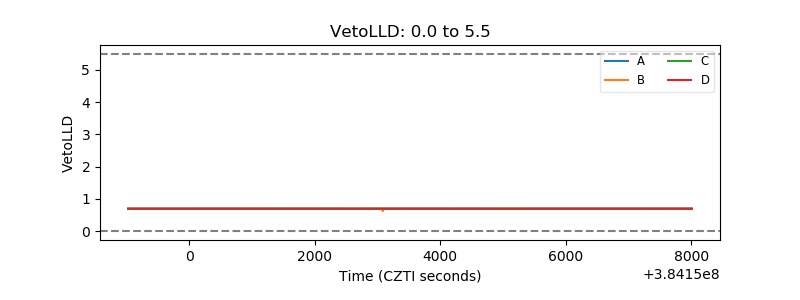 |
| Alpha Counter | 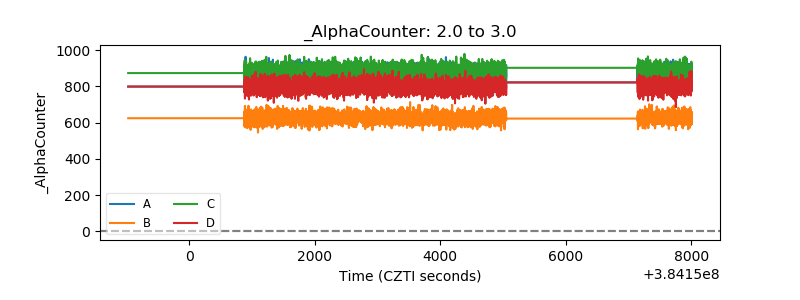 |
| _CPM_Rate | 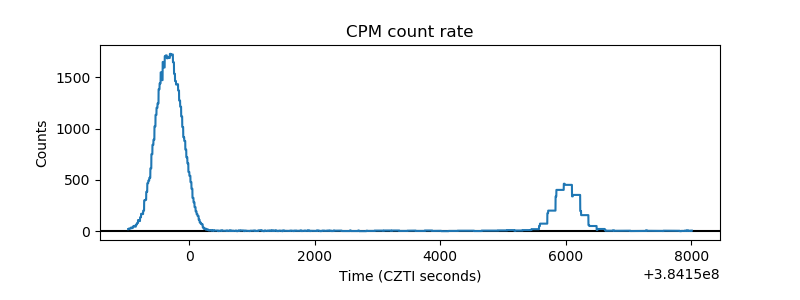 |
| CZT Counter | 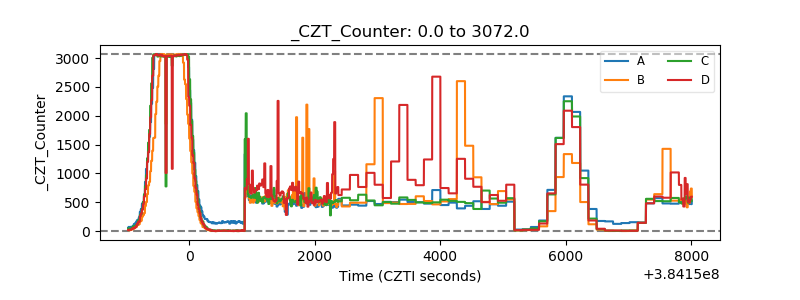 |
| +2.5 Volts monitor | 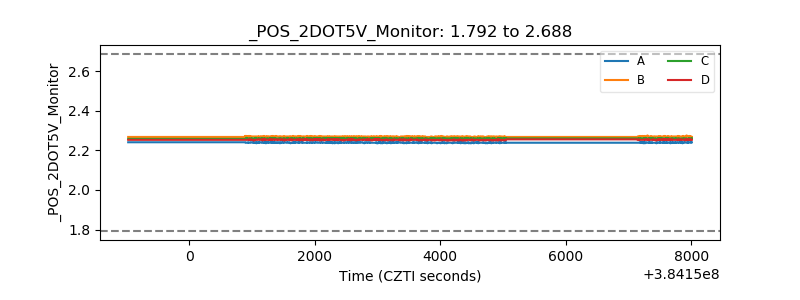 |
| +5 Volts monitor | 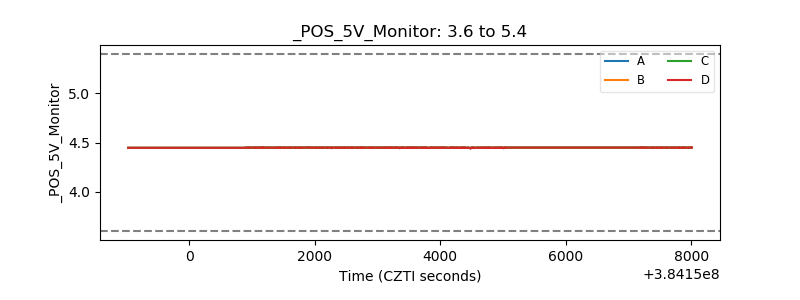 |
| _ROLL_ROT | 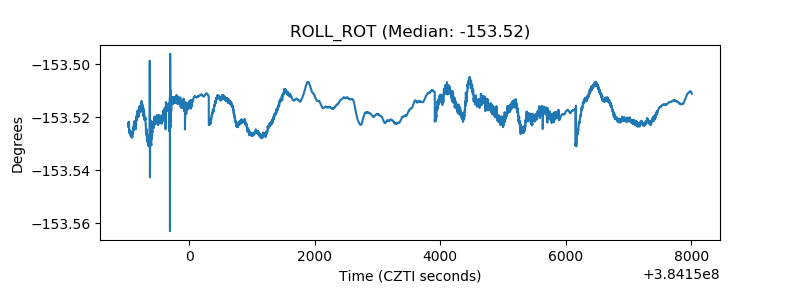 |
| _Roll_DEC | 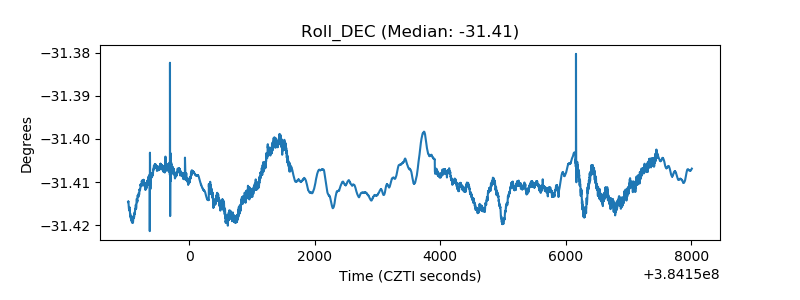 |
| _Roll_RA | 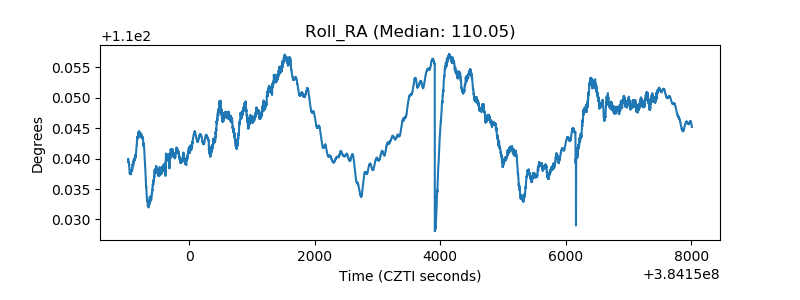 |
| Veto Counter | 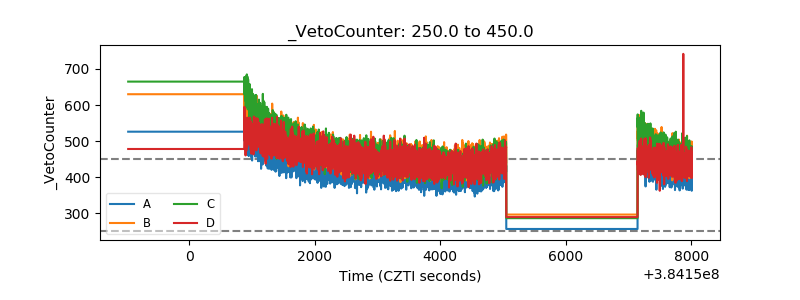 |