| Param | Original file | Final file |
|---|---|---|
| Filename | modeM0/AS1C07_004T01_9000004990_34785cztM0_level2.evt | modeM0/AS1C07_004T01_9000004990_34785cztM0_level2_quad_clean.evt |
| Size (bytes) | 402,822,720 | 47,597,760 |
| Size | 384.2 MB | 45.4 MB |
| Events in quadrant A | 2,582,026 | 270,513 |
| Events in quadrant B | 2,961,957 | 282,292 |
| Events in quadrant C | 2,797,813 | 281,319 |
| Events in quadrant D | 3,523,190 | 261,201 |
| Mode M9 | |||
|---|---|---|---|
| Quadrant | BADHDUFLAG | Total packets | Discarded packets |
| A | 0 | 27 | 0 |
| B | 0 | 27 | 0 |
| C | 0 | 27 | 0 |
| D | 0 | 28 | 0 |
| Mode M0 | |||
|---|---|---|---|
| Quadrant | BADHDUFLAG | Total packets | Discarded packets |
| A | 0 | 10333 | 3 |
| B | 0 | 11616 | 2 |
| C | 0 | 10920 | 2 |
| D | 0 | 13765 | 2 |
| Mode SS | |||
|---|---|---|---|
| Quadrant | BADHDUFLAG | Total packets | Discarded packets |
| A | 0 | 100 | 0 |
| B | 0 | 100 | 0 |
| C | 0 | 100 | 0 |
| D | 0 | 100 | 0 |
| Quadrant | Total seconds | Saturated seconds | Saturation percentage |
|---|---|---|---|
| A | 4926 | 26 | 0.527812% |
| B | 4926 | 95 | 1.928542% |
| C | 4926 | 43 | 0.872919% |
| D | 4926 | 57 | 1.157125% |
Noise dominated data is calculated using 1-second bins in cleaned event files. If a bin has >2000 counts, and if more than 50% of those come from <1% of pixels, then it is considered to be noise-dominated and hence unusable.
| Quadrant | # 1 sec bins | Bins with >0 counts | Bins with >2000 counts | High rate bins dominated by noise | Noise dominated (total time) | Noise dominated (detector-on time) | Marked lightcurve |
|---|---|---|---|---|---|---|---|
| A | 7079 | 4927 | 14 | 14 | 0.20% | 0.28% | 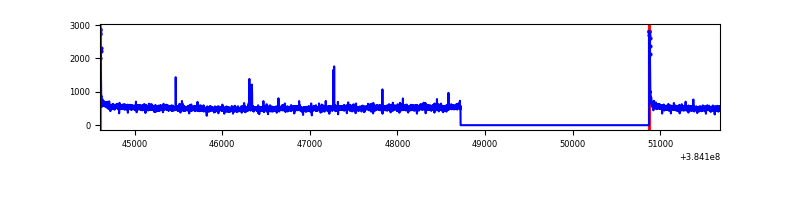 |
| B | 7079 | 4927 | 60 | 60 | 0.85% | 1.22% | 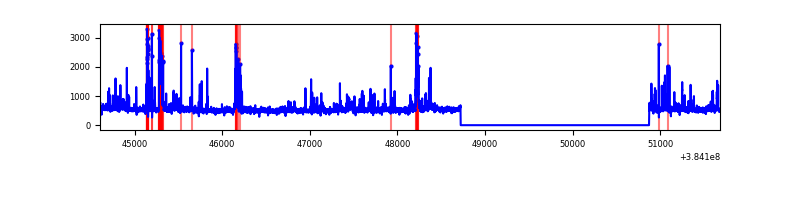 |
| C | 7079 | 4927 | 19 | 19 | 0.27% | 0.39% | 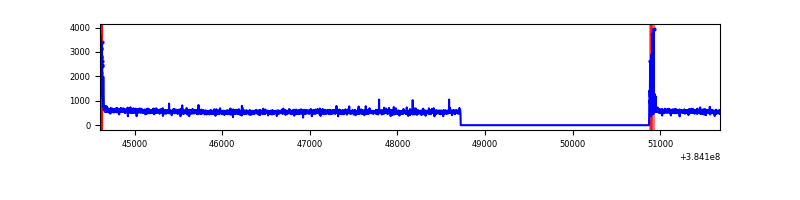 |
| D | 7079 | 4927 | 50 | 50 | 0.71% | 1.01% | 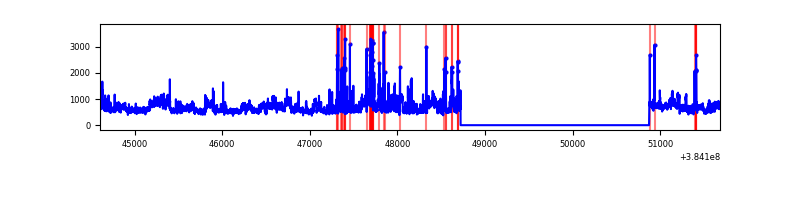 |
Top three noisy pixels from each quadrant. If the there are fewer than three noisy pixels in the level2.evt file, extra rows are filled as -1
| Pixel properties | Quadrant properties | ||||||
|---|---|---|---|---|---|---|---|
| Quadrant | DetID | PixID | Counts | Sigma | Mean | Median | Sigma |
| A | 10 | 83 | 45534 | 357.52 | 632 | 622 | 125.6 |
| A | 8 | 192 | 40300 | 315.86 | 632 | 622 | 125.6 |
| A | 15 | 169 | 34552 | 270.1 | 632 | 622 | 125.6 |
| B | 5 | 172 | 328971 | 2754.48 | 634 | 619 | 119.2 |
| B | 0 | 190 | 38741 | 319.8 | 634 | 619 | 119.2 |
| B | 5 | 255 | 33252 | 273.75 | 634 | 619 | 119.2 |
| C | 15 | 214 | 211224 | 1467.83 | 628 | 635 | 143.5 |
| C | 0 | 10 | 110584 | 766.36 | 628 | 635 | 143.5 |
| C | 14 | 67 | 19812 | 133.67 | 628 | 635 | 143.5 |
| D | 8 | 195 | 859480 | 5643.04 | 623 | 606 | 152.2 |
| D | 2 | 249 | 99273 | 648.27 | 623 | 606 | 152.2 |
| D | 12 | 6 | 51733 | 335.92 | 623 | 606 | 152.2 |
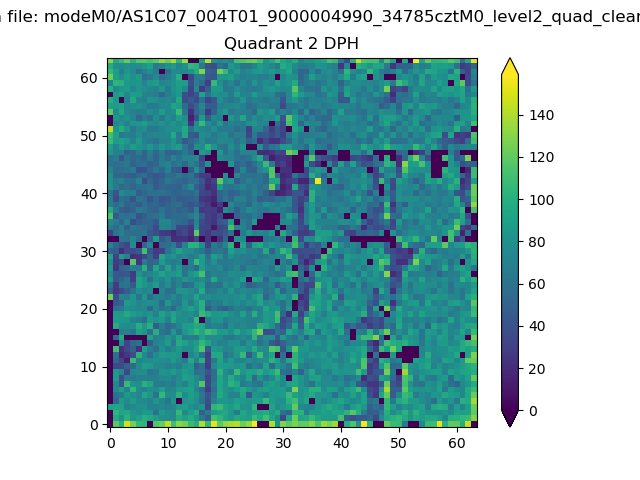
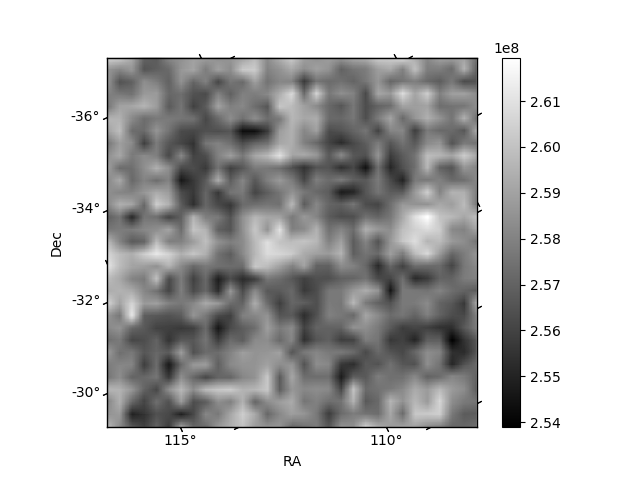
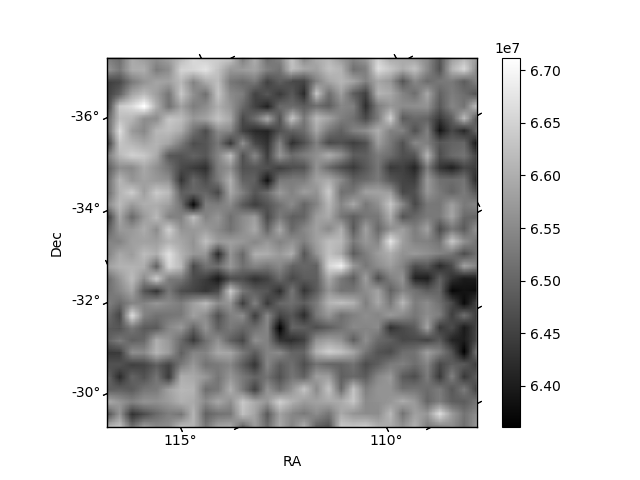
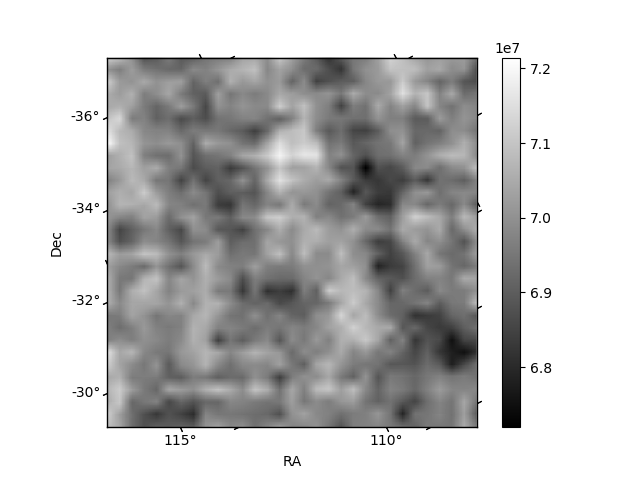
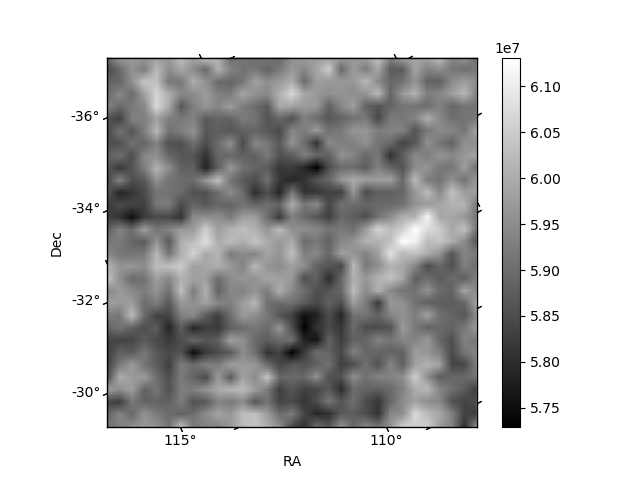
Histogram calculated using DETX and DETY for each event in the final _common_clean file
| Quadrant A | 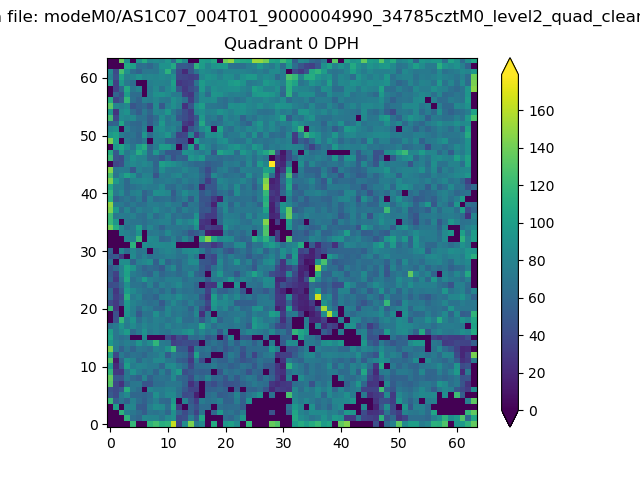 |
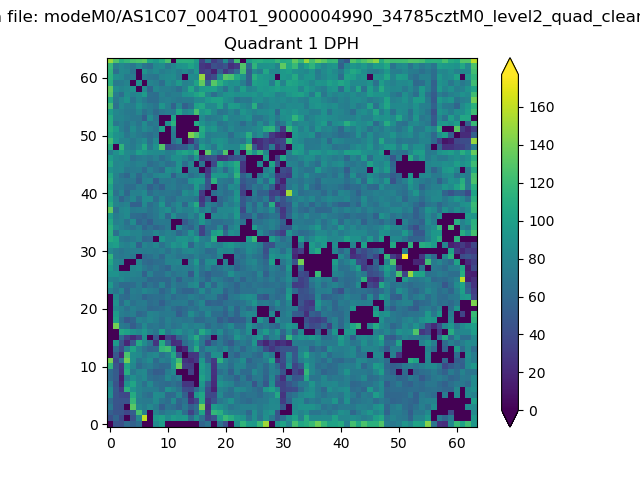 |
Quadrant B |
|---|---|---|---|
| Quadrant D | 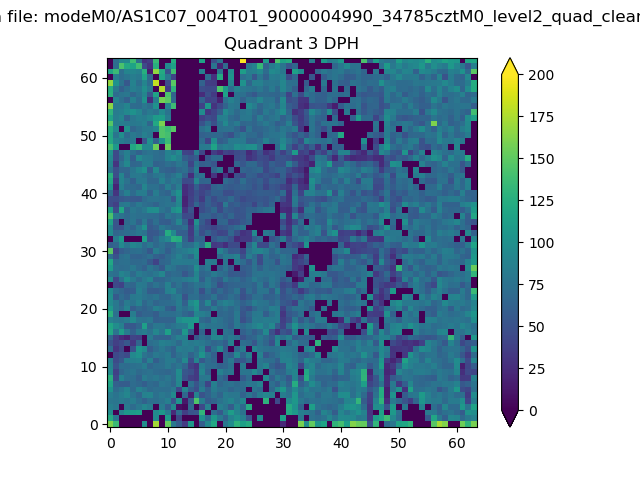 |
 |
Quadrant C |
| Plot type | Count rate plots | Images |
|---|---|---|
| Comparison with Poisson distribution Blue bars denote a histogram of data divided into 1 sec bins. Red curve is a Poisson curve with rate = median count rate of data. |
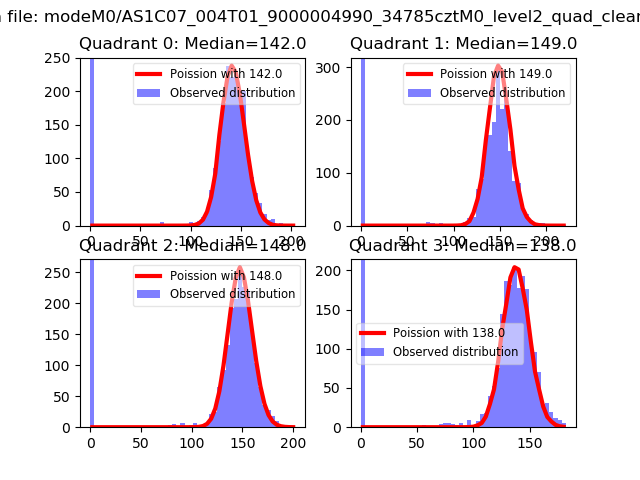 |
 |
| Quadrant-wise count rates Data is divided into 100 sec bins |
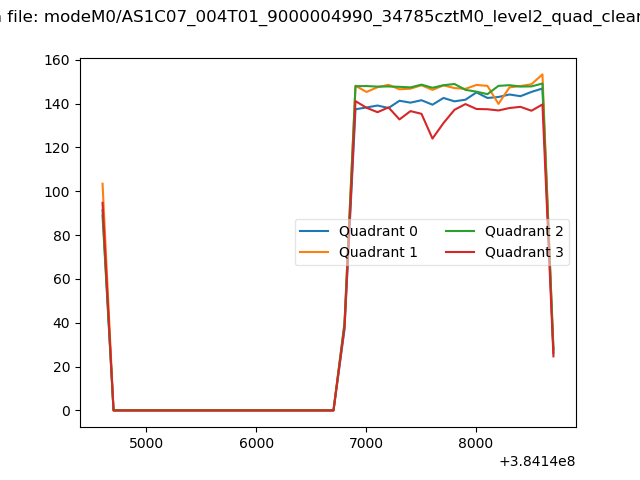 |
|
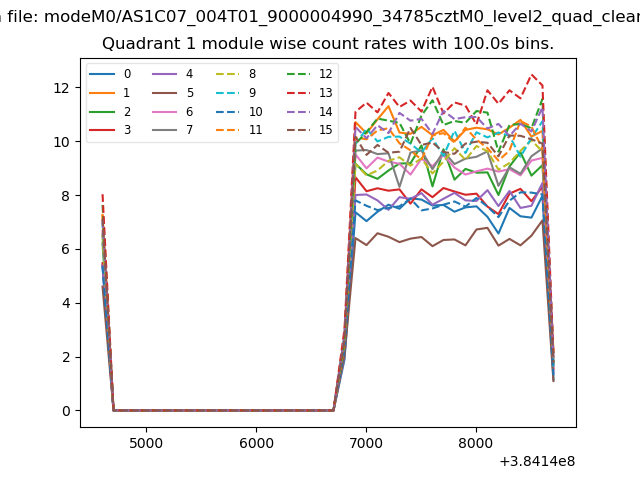
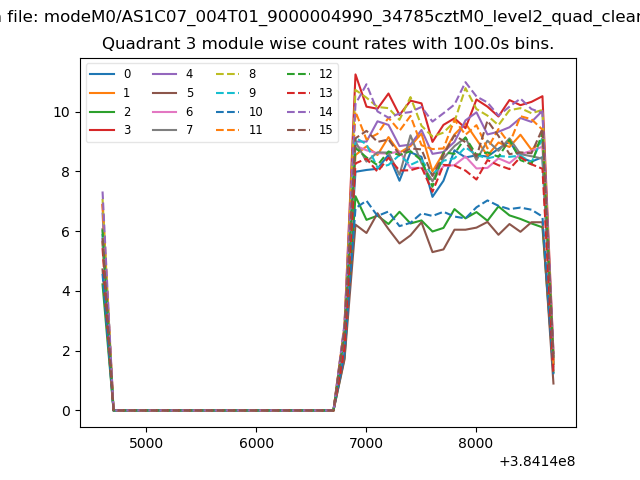
| Module-wise count rates for Quadrant A Data is divided into 100 sec bins |
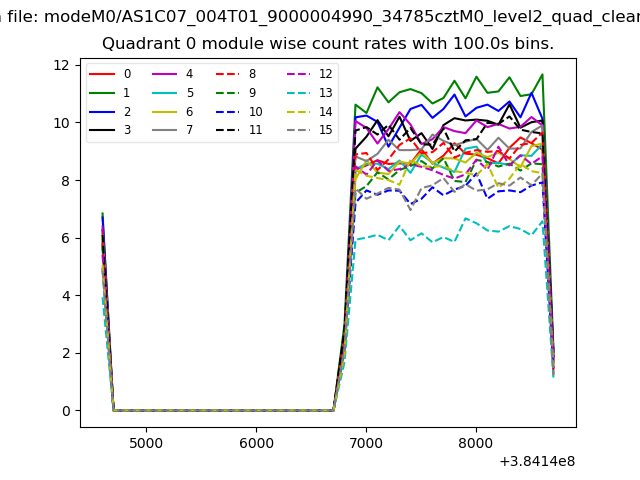 |
 |
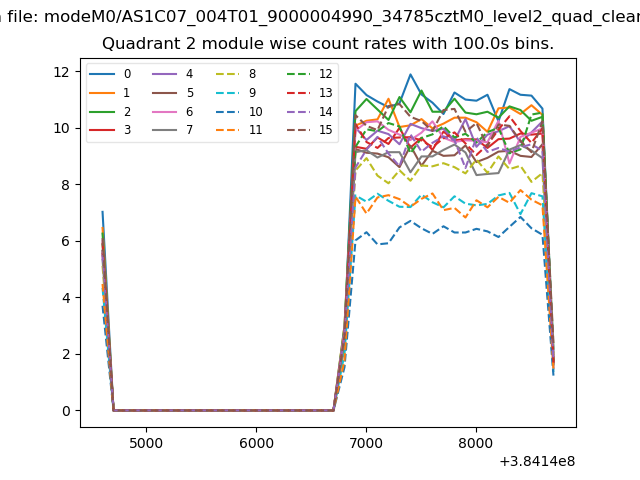
| Module-wise count rates for Quadrant B Data is divided into 100 sec bins |
 |
 |
| Module-wise count rates for Quadrant C Data is divided into 100 sec bins |
 |
 |
| Module-wise count rates for Quadrant D Data is divided into 100 sec bins |
 |
 |
| Parameter | Plot |
|---|---|
| CZT HV Monitor | 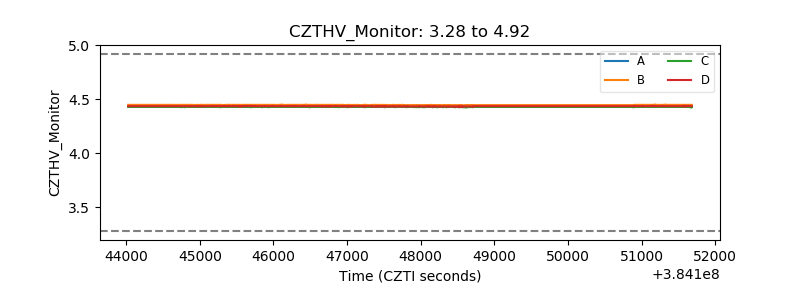 |
| D_VDD | 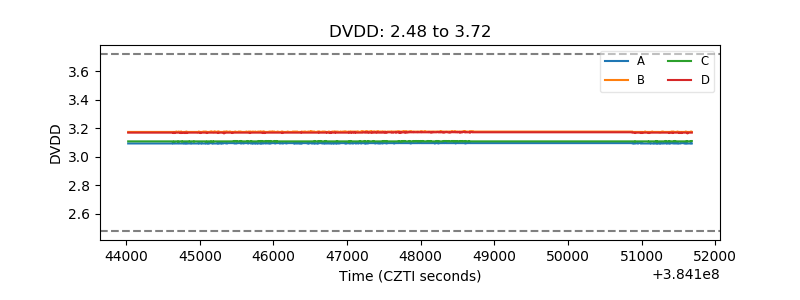 |
| Temperature 1 | 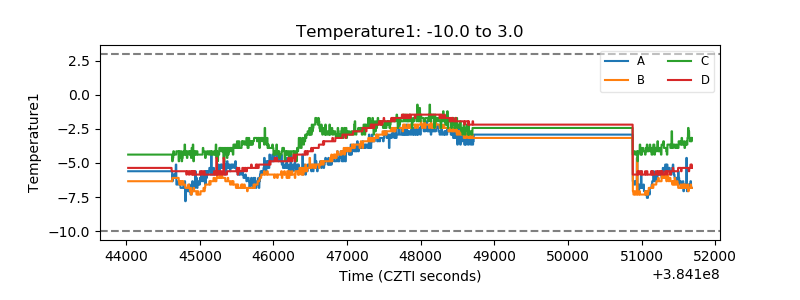 |
| Veto HV Monitor |  |
| Veto LLD | 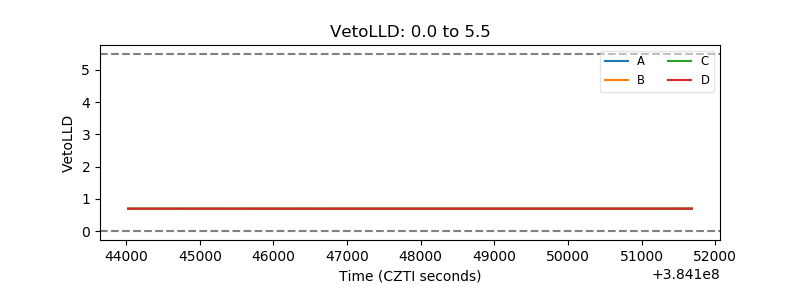 |
| Alpha Counter | 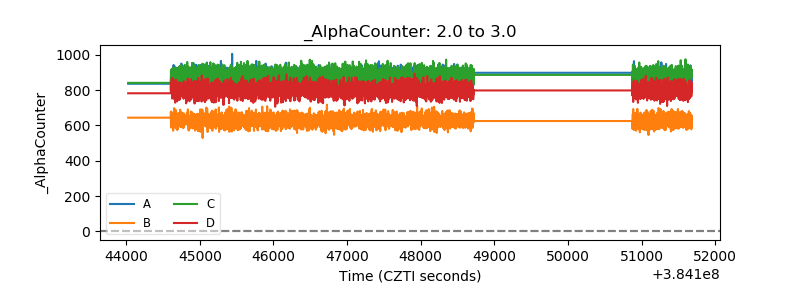 |
| _CPM_Rate | 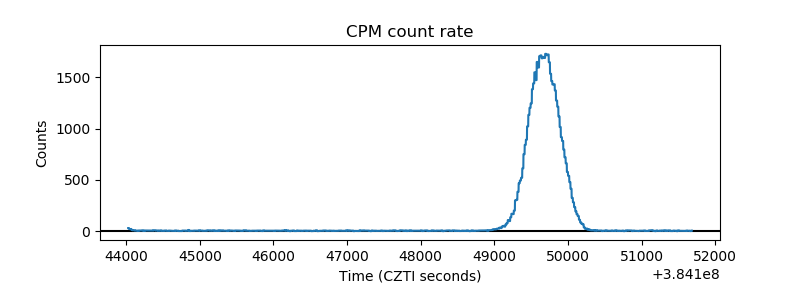 |
| CZT Counter | 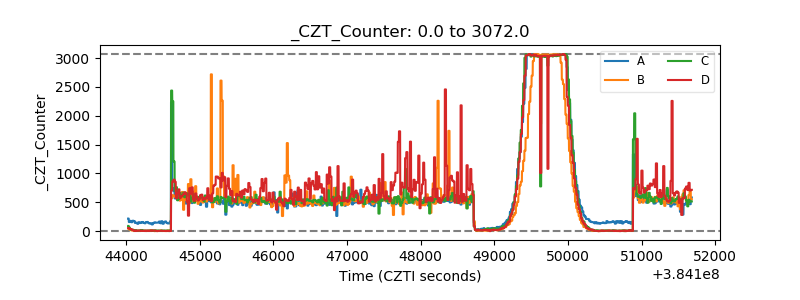 |
| +2.5 Volts monitor | 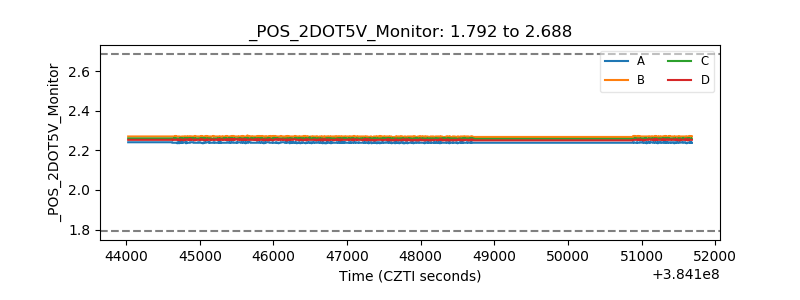 |
| +5 Volts monitor | 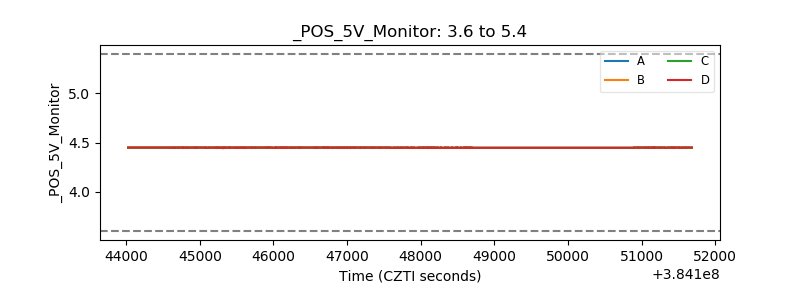 |
| _ROLL_ROT | 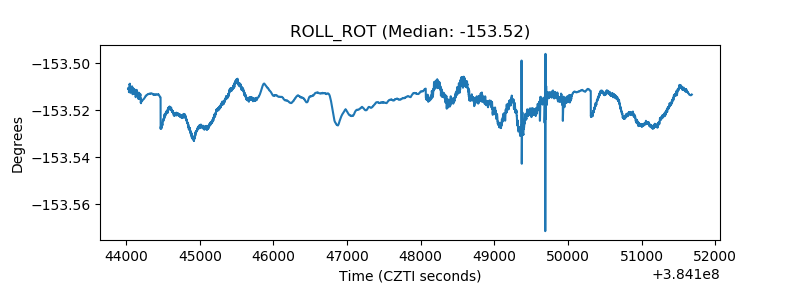 |
| _Roll_DEC | 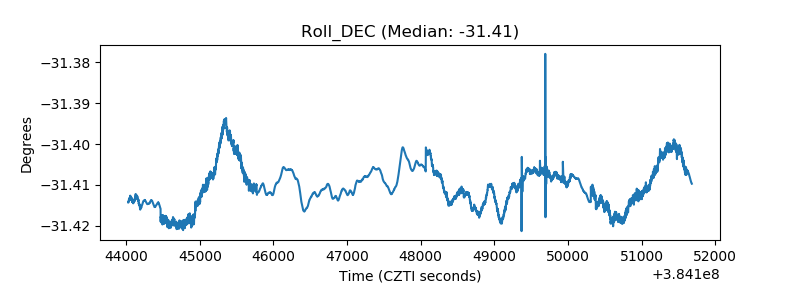 |
| _Roll_RA | 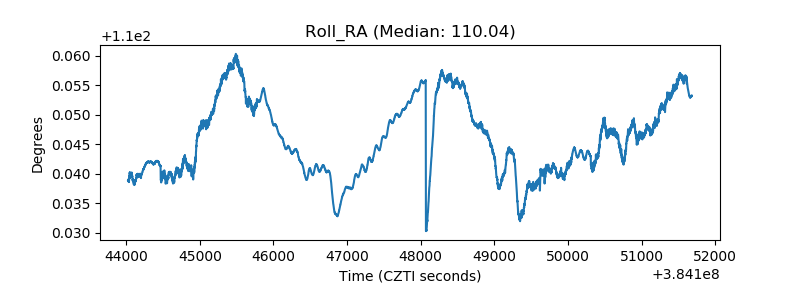 |
| Veto Counter | 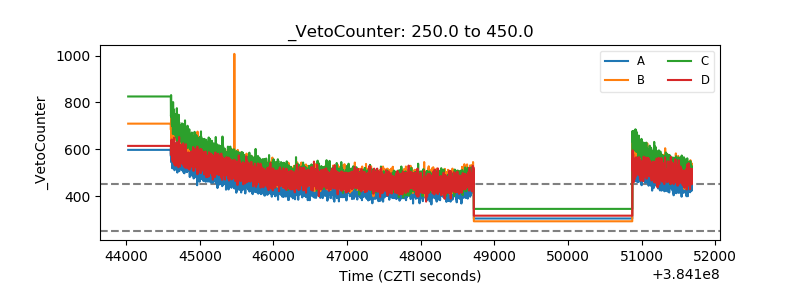 |