| Param | Original file | Final file |
|---|---|---|
| Filename | modeM0/AS1C07_004T01_9000004990_34779cztM0_level2.evt | modeM0/AS1C07_004T01_9000004990_34779cztM0_level2_quad_clean.evt |
| Size (bytes) | 885,769,920 | 118,264,320 |
| Size | 844.7 MB | 112.8 MB |
| Events in quadrant A | 5,235,384 | 731,845 |
| Events in quadrant B | 7,686,032 | 711,093 |
| Events in quadrant C | 5,398,830 | 735,038 |
| Events in quadrant D | 7,810,430 | 690,278 |
| Mode M9 | |||
|---|---|---|---|
| Quadrant | BADHDUFLAG | Total packets | Discarded packets |
| A | 0 | 32 | 0 |
| B | 0 | 32 | 0 |
| C | 0 | 32 | 0 |
| D | 0 | 33 | 0 |
| Mode M0 | |||
|---|---|---|---|
| Quadrant | BADHDUFLAG | Total packets | Discarded packets |
| A | 0 | 22332 | 3 |
| B | 0 | 29571 | 2 |
| C | 0 | 22387 | 2 |
| D | 0 | 30401 | 2 |
| Mode SS | |||
|---|---|---|---|
| Quadrant | BADHDUFLAG | Total packets | Discarded packets |
| A | 0 | 208 | 0 |
| B | 0 | 208 | 0 |
| C | 0 | 208 | 0 |
| D | 0 | 208 | 0 |
| Quadrant | Total seconds | Saturated seconds | Saturation percentage |
|---|---|---|---|
| A | 10299 | 103 | 1.000097% |
| B | 10299 | 750 | 7.282260% |
| C | 10299 | 71 | 0.689387% |
| D | 10299 | 218 | 2.116710% |
Noise dominated data is calculated using 1-second bins in cleaned event files. If a bin has >2000 counts, and if more than 50% of those come from <1% of pixels, then it is considered to be noise-dominated and hence unusable.
| Quadrant | # 1 sec bins | Bins with >0 counts | Bins with >2000 counts | High rate bins dominated by noise | Noise dominated (total time) | Noise dominated (detector-on time) | Marked lightcurve |
|---|---|---|---|---|---|---|---|
| A | 13404 | 10301 | 83 | 83 | 0.62% | 0.81% | 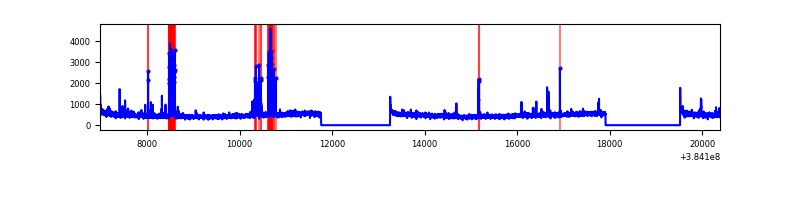 |
| B | 13404 | 10301 | 494 | 494 | 3.69% | 4.80% | 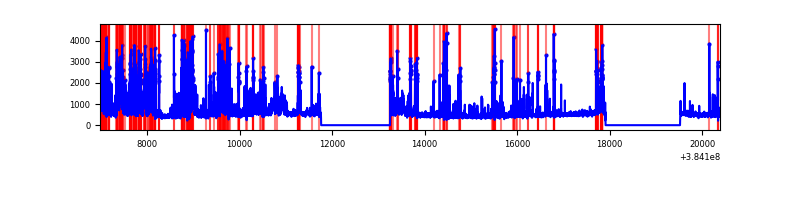 |
| C | 13404 | 10301 | 52 | 52 | 0.39% | 0.50% | 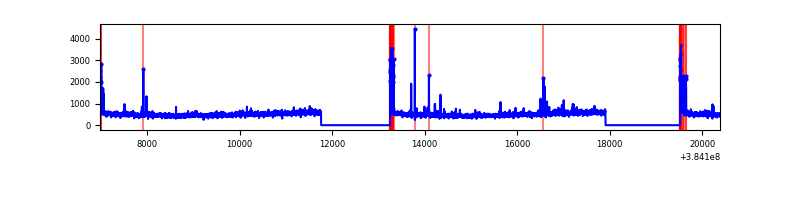 |
| D | 13404 | 10301 | 194 | 194 | 1.45% | 1.88% | 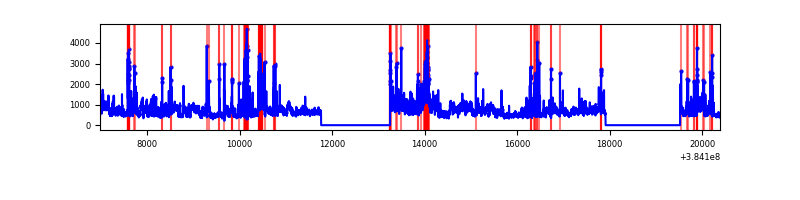 |
Top three noisy pixels from each quadrant. If the there are fewer than three noisy pixels in the level2.evt file, extra rows are filled as -1
| Pixel properties | Quadrant properties | ||||||
|---|---|---|---|---|---|---|---|
| Quadrant | DetID | PixID | Counts | Sigma | Mean | Median | Sigma |
| A | 7 | 16 | 429046 | 1793.13 | 1188 | 1166 | 238.6 |
| A | 15 | 169 | 96627 | 400.05 | 1188 | 1166 | 238.6 |
| A | 10 | 83 | 80534 | 332.61 | 1188 | 1166 | 238.6 |
| B | 5 | 172 | 2140305 | 9616.46 | 1163 | 1132 | 222.4 |
| B | 0 | 244 | 477400 | 2141.02 | 1163 | 1132 | 222.4 |
| B | 5 | 255 | 219359 | 981.02 | 1163 | 1132 | 222.4 |
| C | 15 | 214 | 438435 | 1612.67 | 1163 | 1174 | 271.1 |
| C | 0 | 10 | 181330 | 664.43 | 1163 | 1174 | 271.1 |
| C | 14 | 67 | 102302 | 372.97 | 1163 | 1174 | 271.1 |
| D | 8 | 195 | 2101715 | 7495.43 | 1148 | 1115 | 280.3 |
| D | 2 | 250 | 524885 | 1868.93 | 1148 | 1115 | 280.3 |
| D | 1 | 52 | 370922 | 1319.56 | 1148 | 1115 | 280.3 |
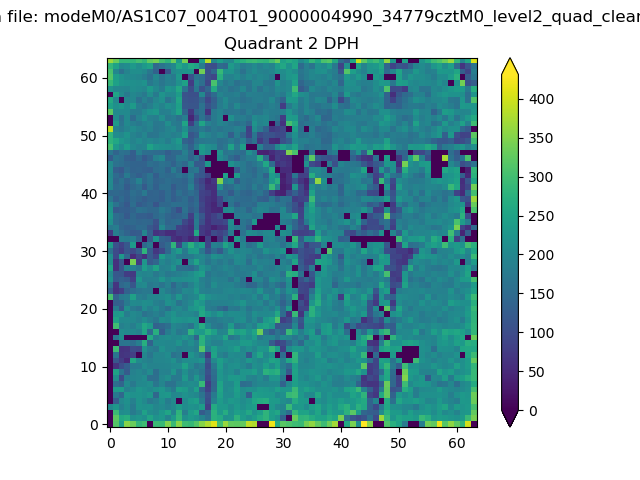
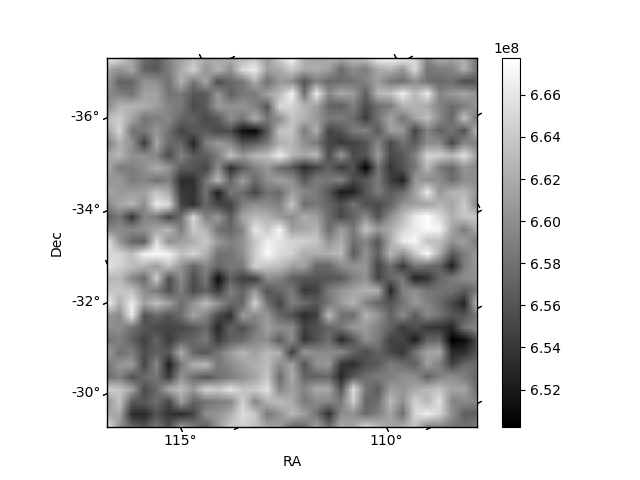
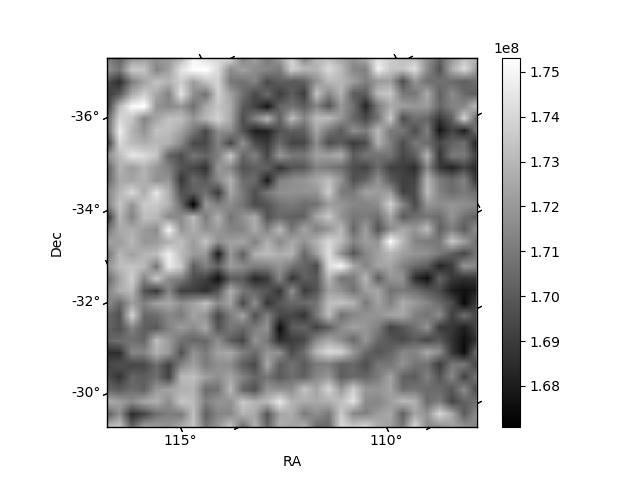
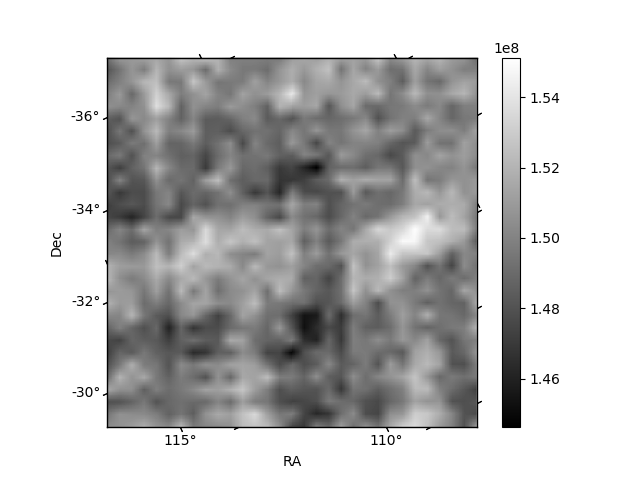
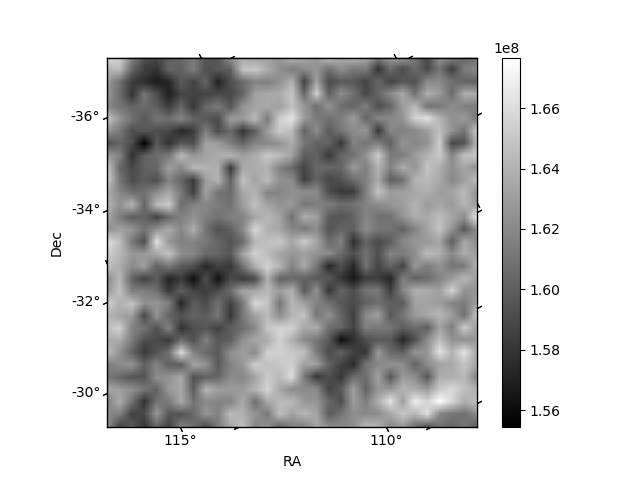
Histogram calculated using DETX and DETY for each event in the final _common_clean file
| Quadrant A | 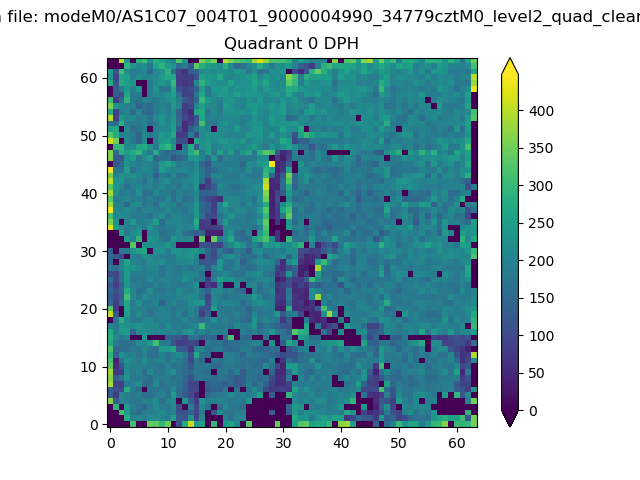 |
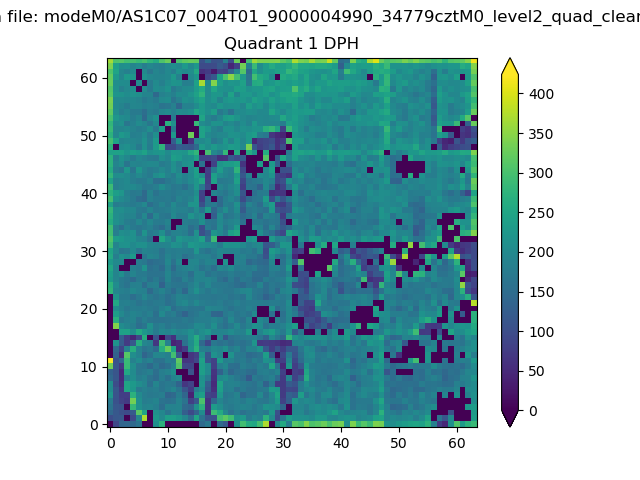 |
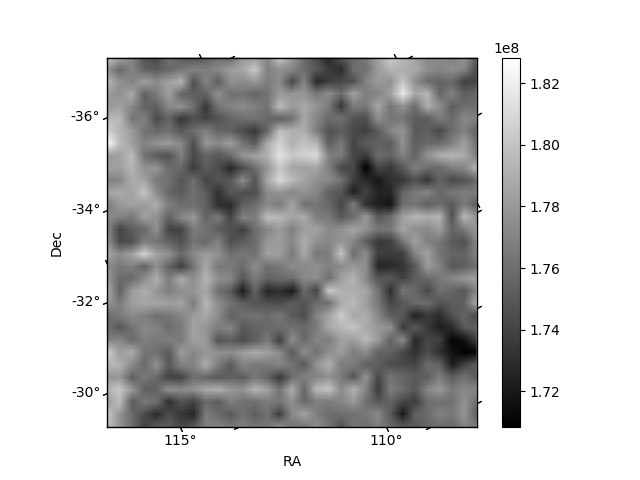
Quadrant B |
|---|---|---|---|
| Quadrant D | 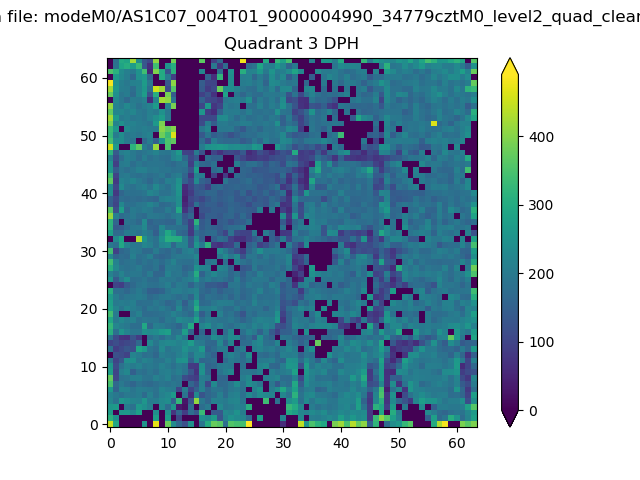 |
 |
Quadrant C |
| Plot type | Count rate plots | Images |
|---|---|---|
| Comparison with Poisson distribution Blue bars denote a histogram of data divided into 1 sec bins. Red curve is a Poisson curve with rate = median count rate of data. |
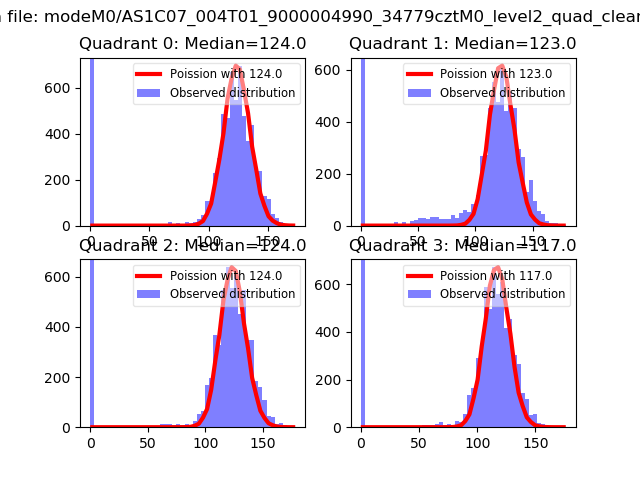 |
 |
| Quadrant-wise count rates Data is divided into 100 sec bins |
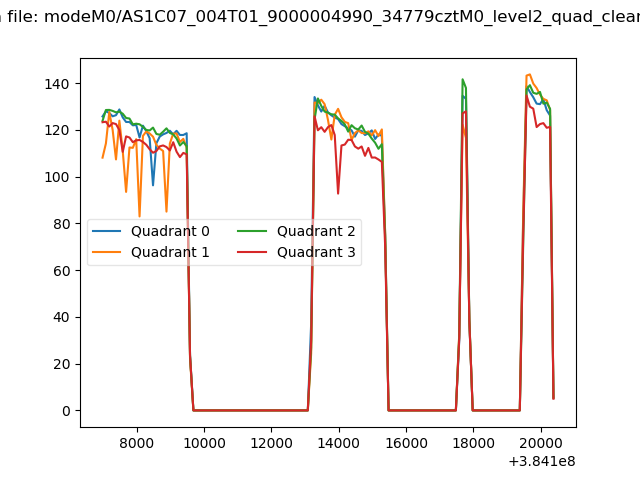 |
|
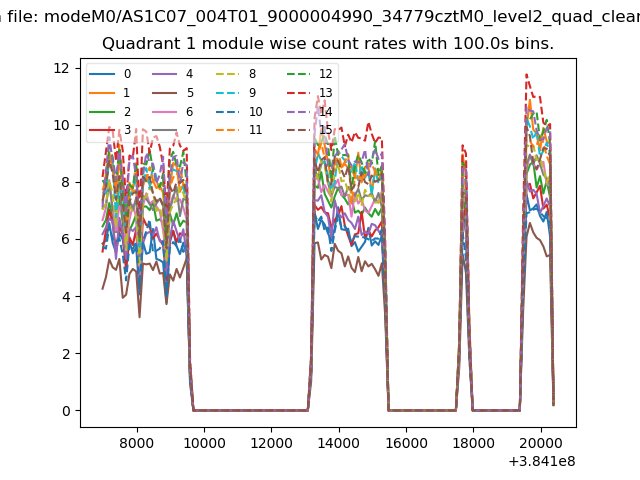
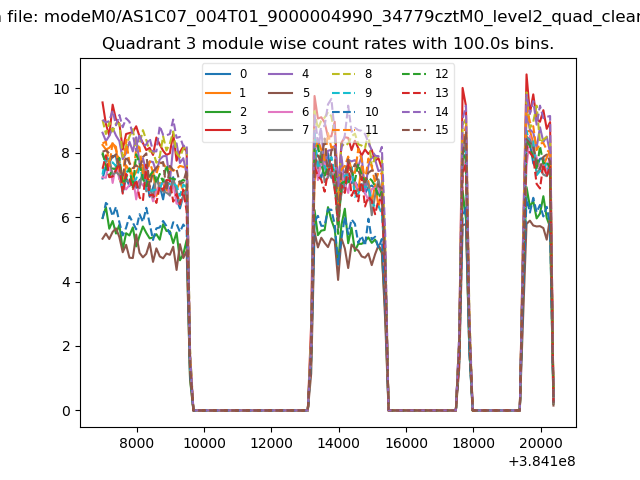
| Module-wise count rates for Quadrant A Data is divided into 100 sec bins |
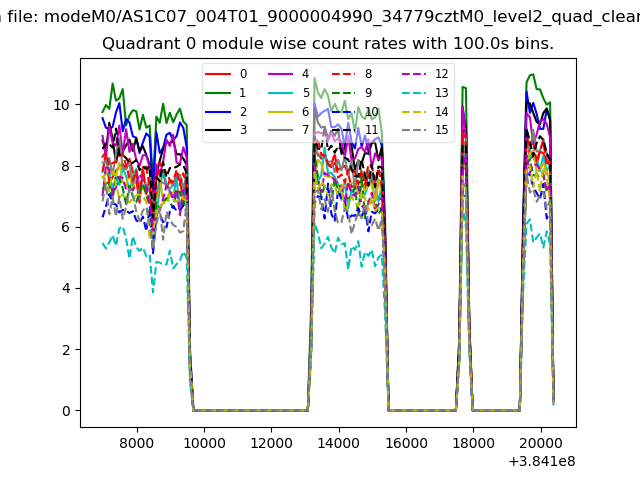 |
 |
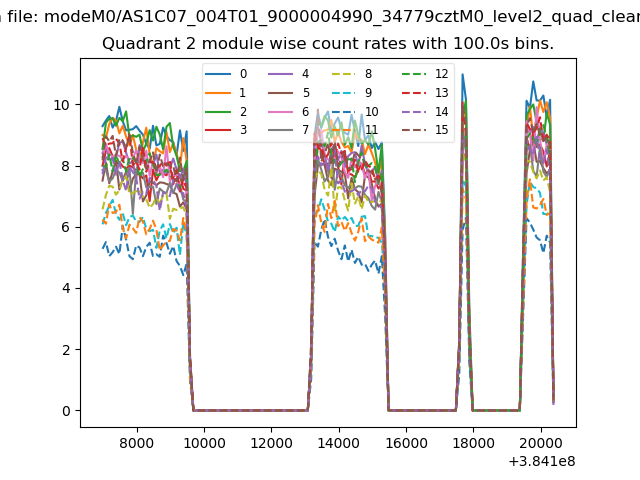
| Module-wise count rates for Quadrant B Data is divided into 100 sec bins |
 |
 |
| Module-wise count rates for Quadrant C Data is divided into 100 sec bins |
 |
 |
| Module-wise count rates for Quadrant D Data is divided into 100 sec bins |
 |
 |
| Parameter | Plot |
|---|---|
| CZT HV Monitor | 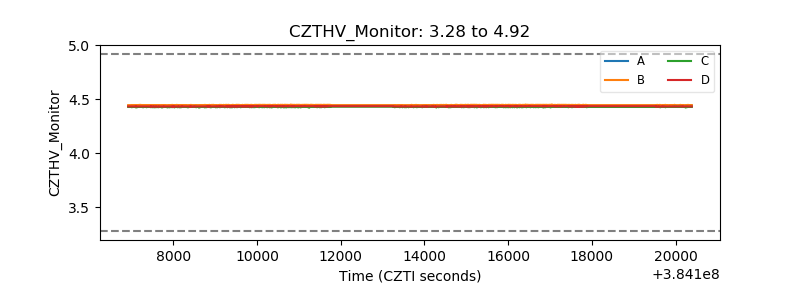 |
| D_VDD | 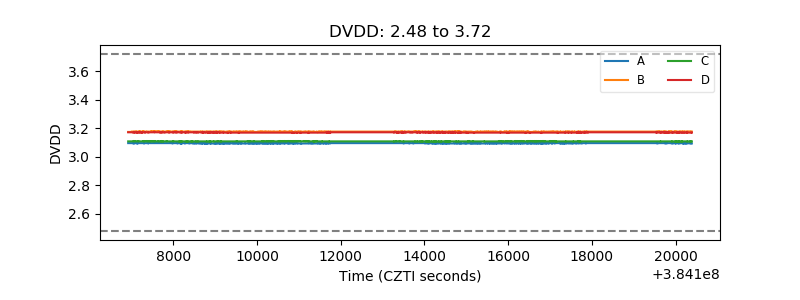 |
| Temperature 1 | 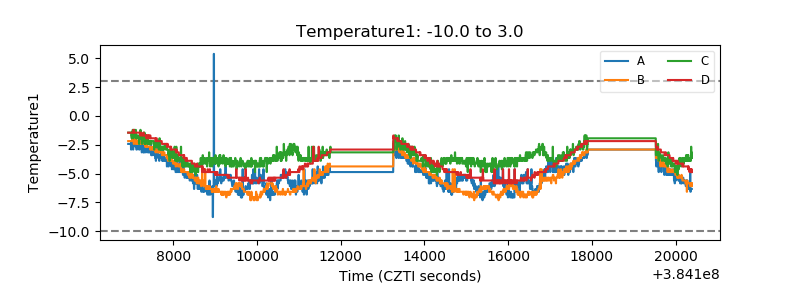 |
| Veto HV Monitor | 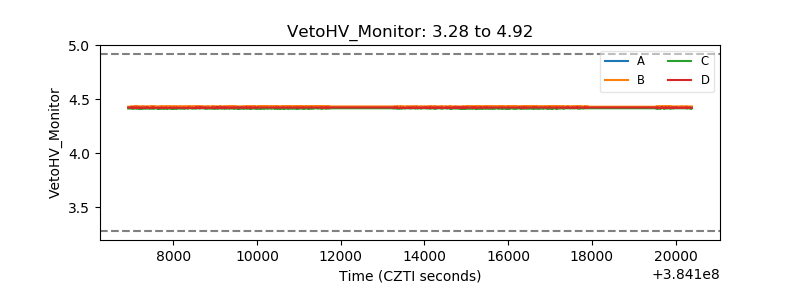 |
| Veto LLD | 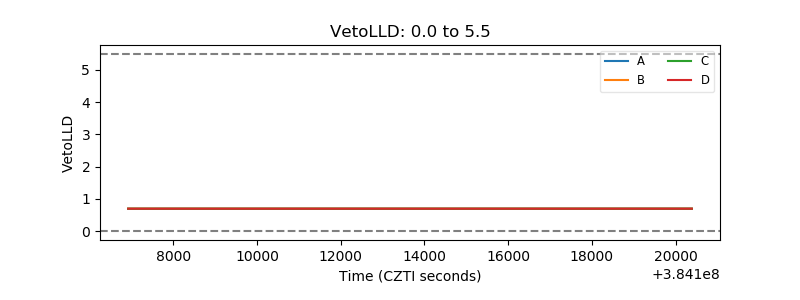 |
| Alpha Counter | 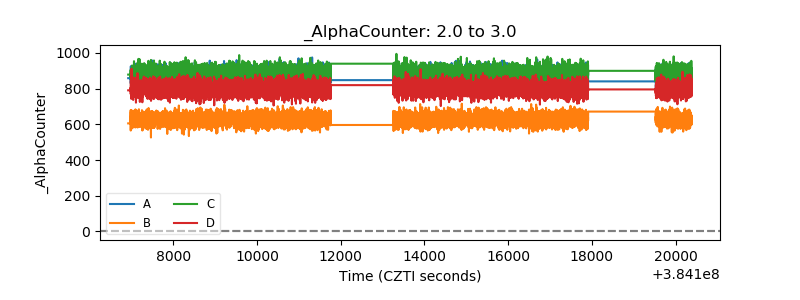 |
| _CPM_Rate | 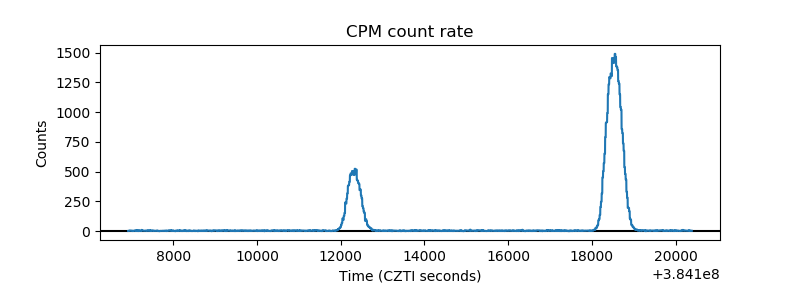 |
| CZT Counter | 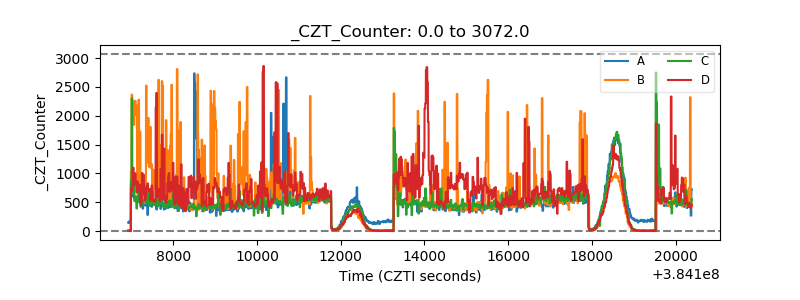 |
| +2.5 Volts monitor | 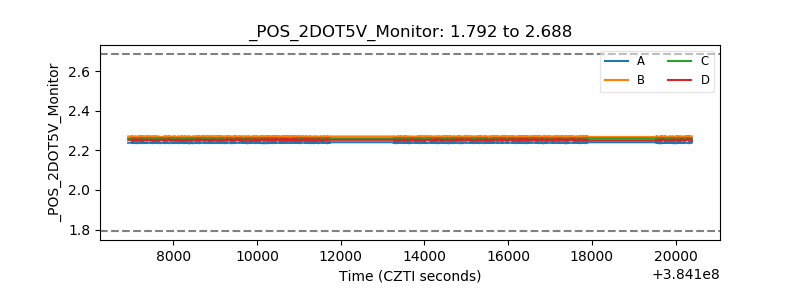 |
| +5 Volts monitor | 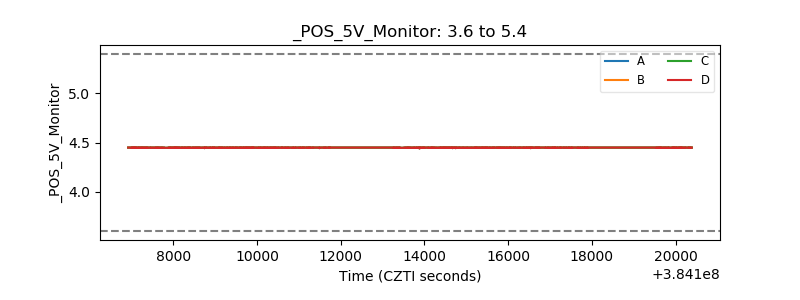 |
| _ROLL_ROT | 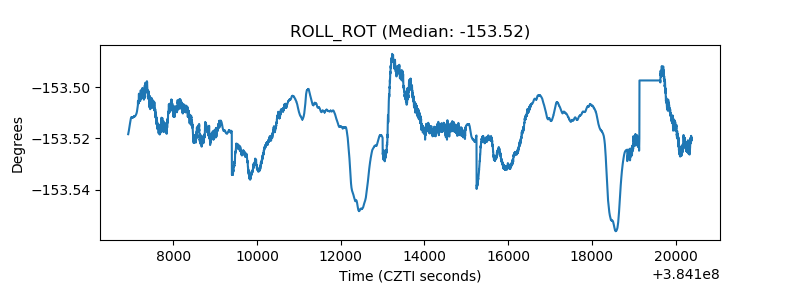 |
| _Roll_DEC | 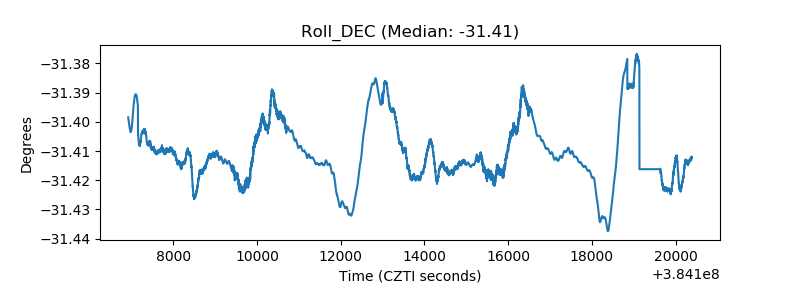 |
| _Roll_RA | 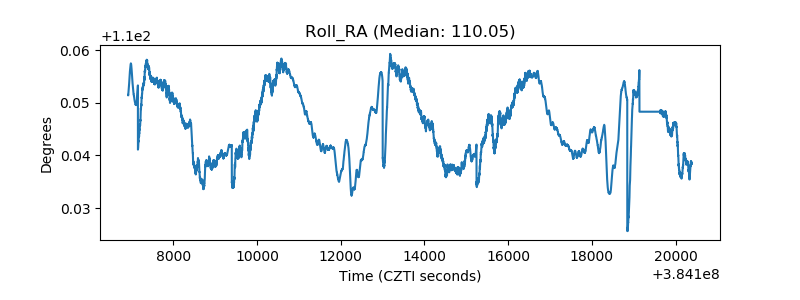 |
| Veto Counter | 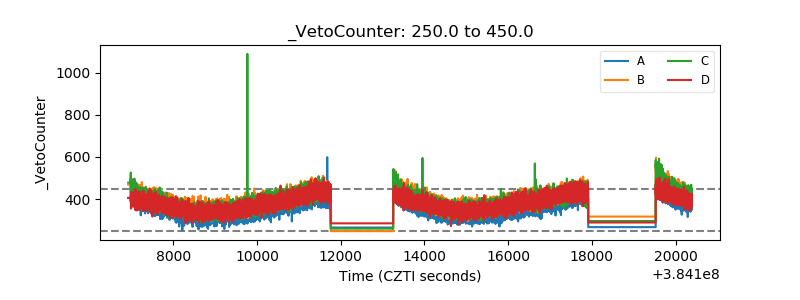 |