| Param | Original file | Final file |
|---|---|---|
| Filename | modeM0/AS1C07_004T01_9000004990_34773cztM0_level2.evt | modeM0/AS1C07_004T01_9000004990_34773cztM0_level2_quad_clean.evt |
| Size (bytes) | 456,770,880 | 82,221,120 |
| Size | 435.6 MB | 78.4 MB |
| Events in quadrant A | 2,758,944 | 519,502 |
| Events in quadrant B | 2,887,029 | 533,720 |
| Events in quadrant C | 3,119,726 | 533,499 |
| Events in quadrant D | 4,672,873 | 496,461 |
| Mode M9 | |||
|---|---|---|---|
| Quadrant | BADHDUFLAG | Total packets | Discarded packets |
| A | 0 | 36 | 0 |
| B | 0 | 36 | 0 |
| C | 0 | 36 | 0 |
| D | 0 | 36 | 0 |
| Mode M0 | |||
|---|---|---|---|
| Quadrant | BADHDUFLAG | Total packets | Discarded packets |
| A | 0 | 11822 | 3 |
| B | 0 | 12030 | 2 |
| C | 0 | 12450 | 2 |
| D | 0 | 17693 | 2 |
| Mode SS | |||
|---|---|---|---|
| Quadrant | BADHDUFLAG | Total packets | Discarded packets |
| A | 0 | 122 | 0 |
| B | 0 | 122 | 0 |
| C | 0 | 122 | 0 |
| D | 0 | 122 | 0 |
| Quadrant | Total seconds | Saturated seconds | Saturation percentage |
|---|---|---|---|
| A | 5813 | 6 | 0.103217% |
| B | 5813 | 21 | 0.361259% |
| C | 5813 | 34 | 0.584896% |
| D | 5813 | 90 | 1.548254% |
Noise dominated data is calculated using 1-second bins in cleaned event files. If a bin has >2000 counts, and if more than 50% of those come from <1% of pixels, then it is considered to be noise-dominated and hence unusable.
| Quadrant | # 1 sec bins | Bins with >0 counts | Bins with >2000 counts | High rate bins dominated by noise | Noise dominated (total time) | Noise dominated (detector-on time) | Marked lightcurve |
|---|---|---|---|---|---|---|---|
| A | 9488 | 5815 | 0 | 0 | 0.00% | 0.00% | 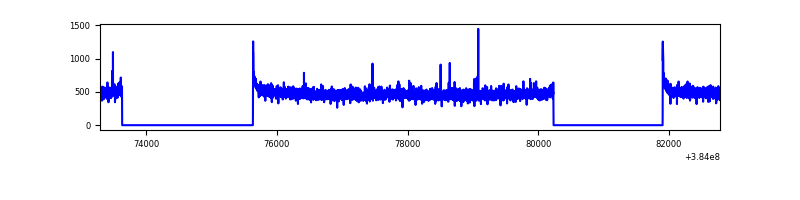 |
| B | 9488 | 5815 | 7 | 7 | 0.07% | 0.12% | 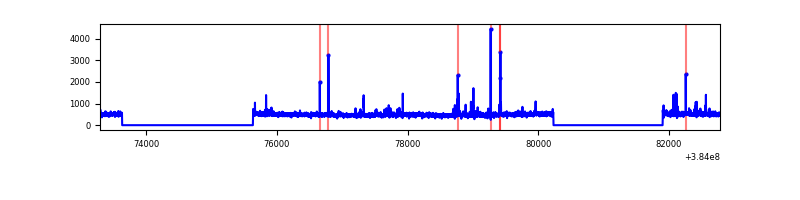 |
| C | 9488 | 5815 | 19 | 19 | 0.20% | 0.33% | 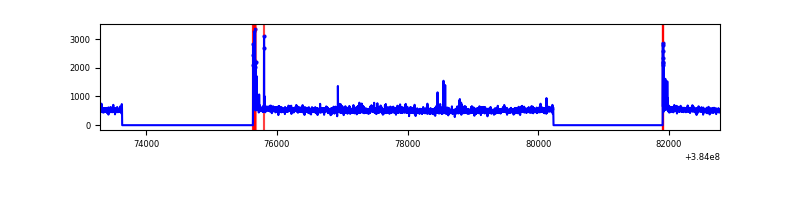 |
| D | 9488 | 5815 | 94 | 94 | 0.99% | 1.62% | 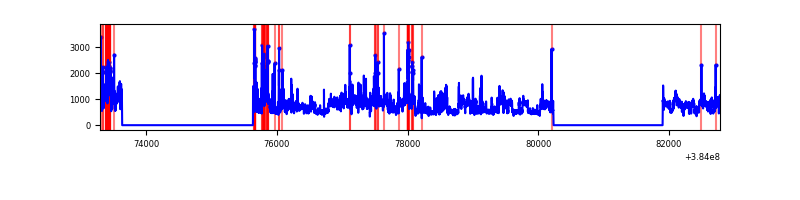 |
Top three noisy pixels from each quadrant. If the there are fewer than three noisy pixels in the level2.evt file, extra rows are filled as -1
| Pixel properties | Quadrant properties | ||||||
|---|---|---|---|---|---|---|---|
| Quadrant | DetID | PixID | Counts | Sigma | Mean | Median | Sigma |
| A | 10 | 83 | 50213 | 355.11 | 692 | 678 | 139.5 |
| A | 13 | 6 | 17253 | 118.82 | 692 | 678 | 139.5 |
| A | 15 | 169 | 10112 | 67.63 | 692 | 678 | 139.5 |
| B | 0 | 190 | 66698 | 495.16 | 691 | 675 | 133.3 |
| B | 5 | 255 | 44235 | 326.69 | 691 | 675 | 133.3 |
| B | 0 | 189 | 27677 | 202.51 | 691 | 675 | 133.3 |
| C | 15 | 214 | 250838 | 1587.85 | 677 | 685 | 157.5 |
| C | 14 | 67 | 118678 | 748.96 | 677 | 685 | 157.5 |
| C | 0 | 10 | 88170 | 555.31 | 677 | 685 | 157.5 |
| D | 8 | 195 | 1333300 | 8084.03 | 672 | 654 | 164.8 |
| D | 10 | 118 | 219695 | 1328.74 | 672 | 654 | 164.8 |
| D | 2 | 250 | 182157 | 1101.02 | 672 | 654 | 164.8 |
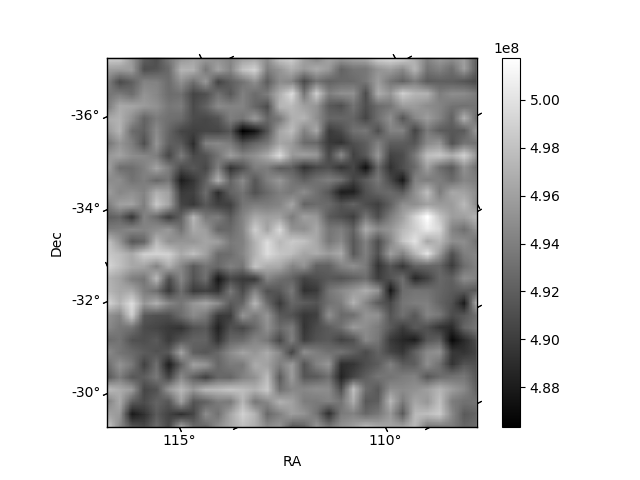
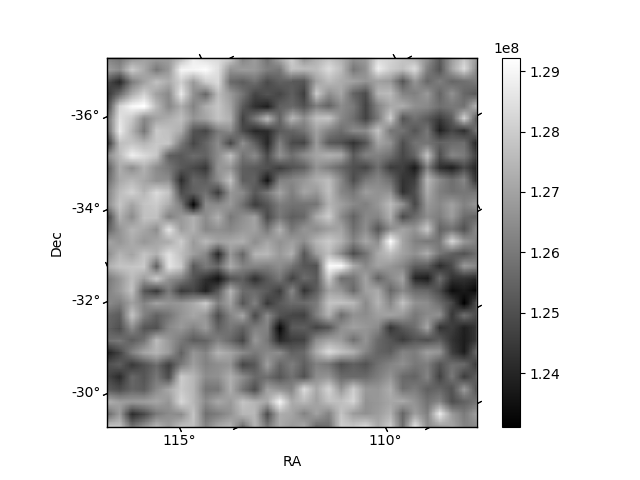
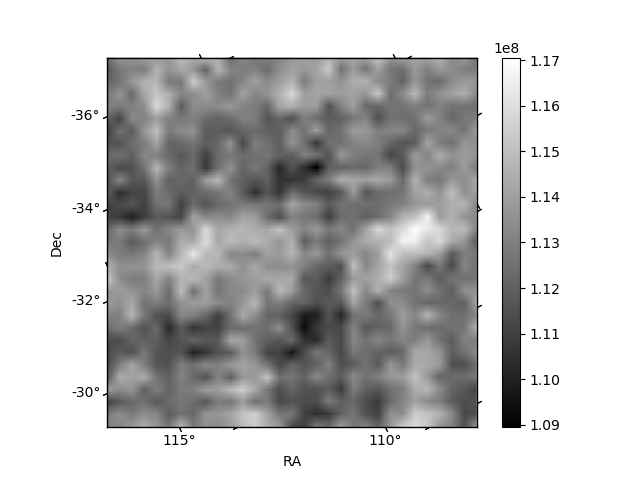
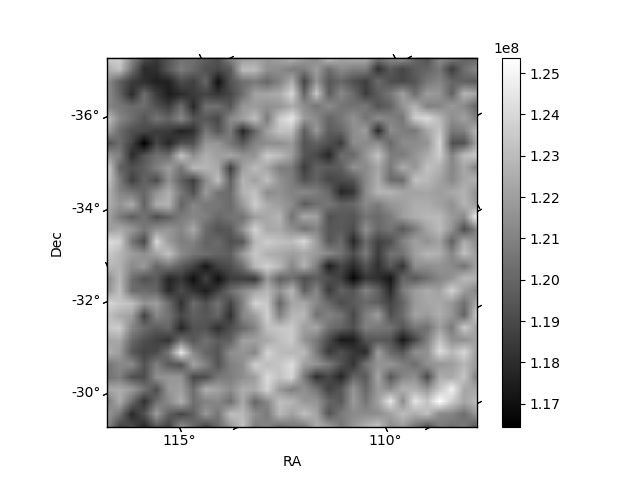
Histogram calculated using DETX and DETY for each event in the final _common_clean file
| Quadrant A | 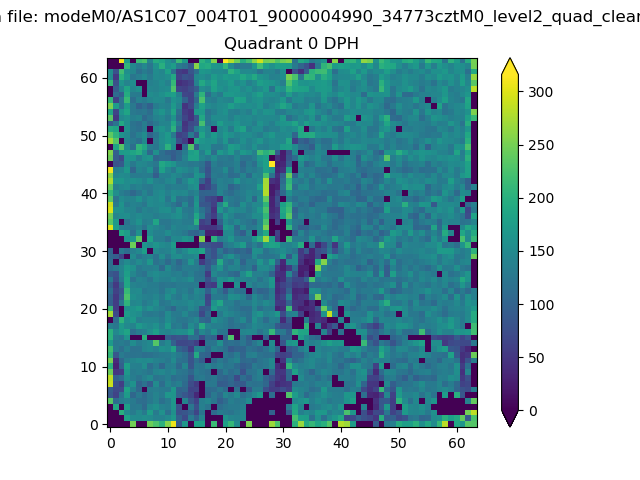 |
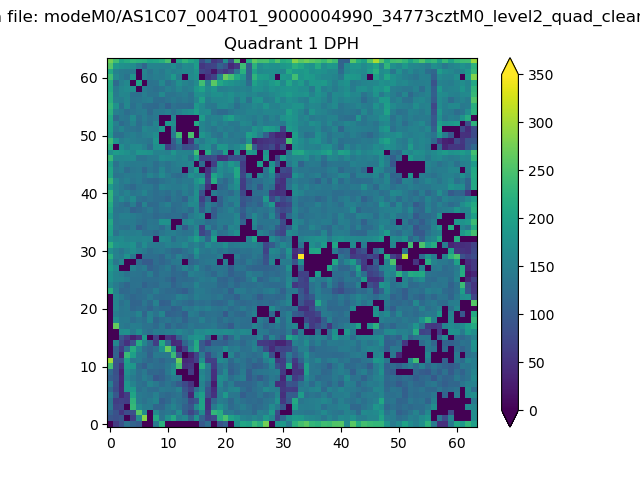 |
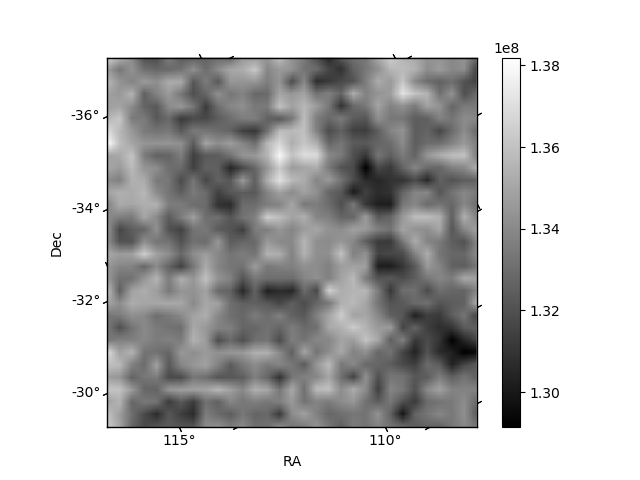
Quadrant B |
|---|---|---|---|
| Quadrant D | 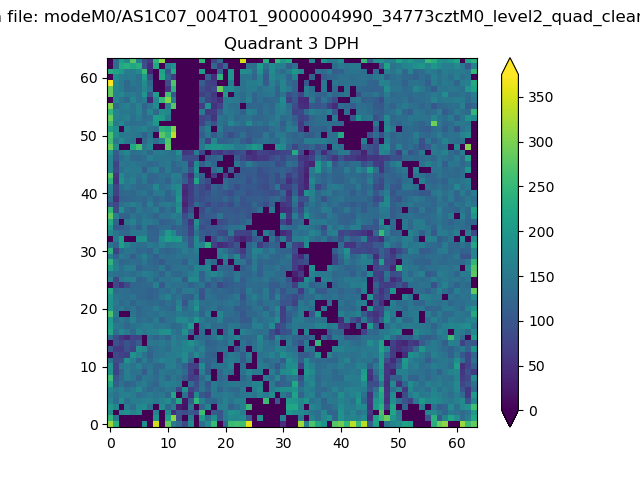 |
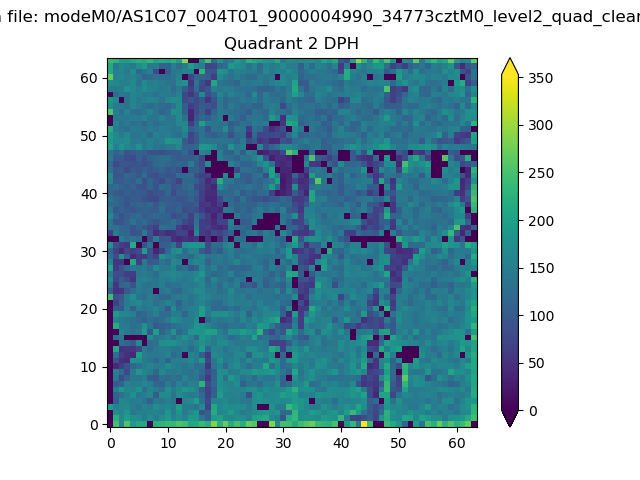 |
Quadrant C |
| Plot type | Count rate plots | Images |
|---|---|---|
| Comparison with Poisson distribution Blue bars denote a histogram of data divided into 1 sec bins. Red curve is a Poisson curve with rate = median count rate of data. |
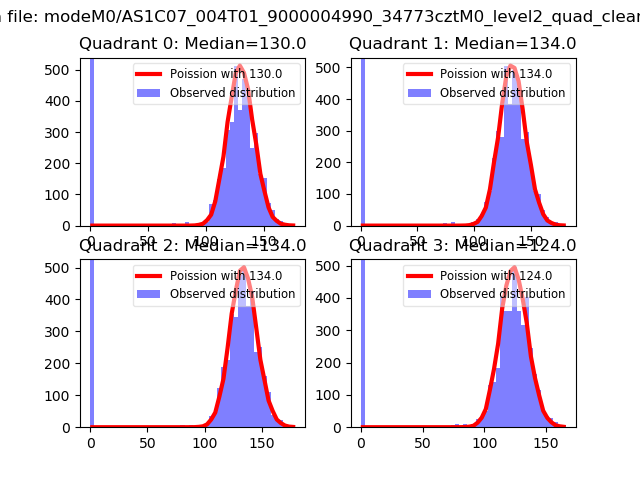 |
 |
| Quadrant-wise count rates Data is divided into 100 sec bins |
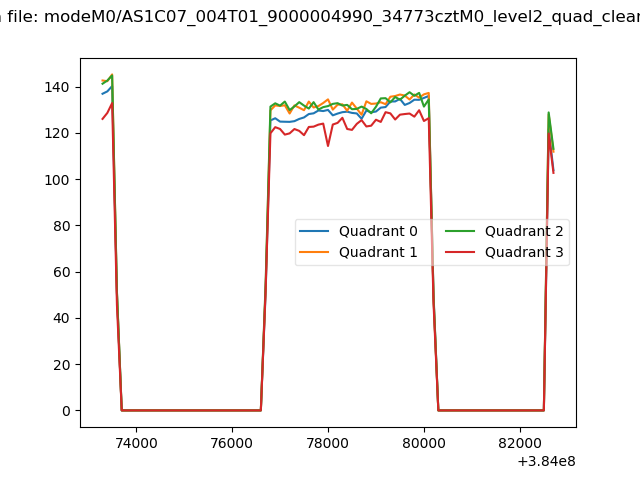 |
|
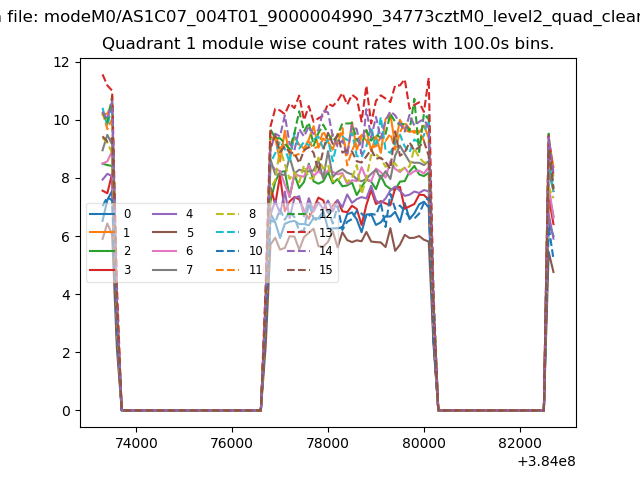
| Module-wise count rates for Quadrant A Data is divided into 100 sec bins |
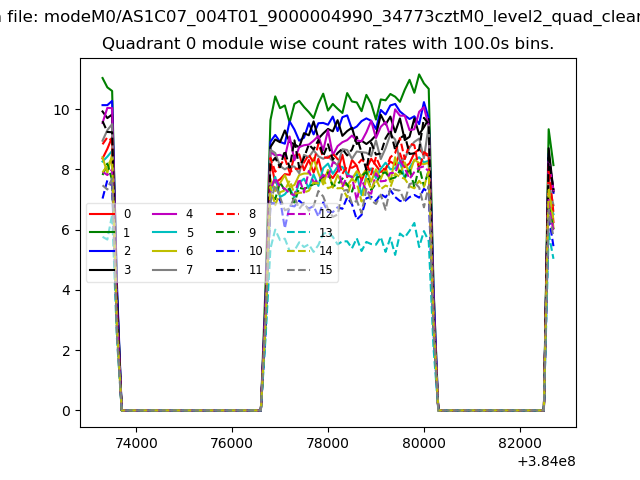 |
 |
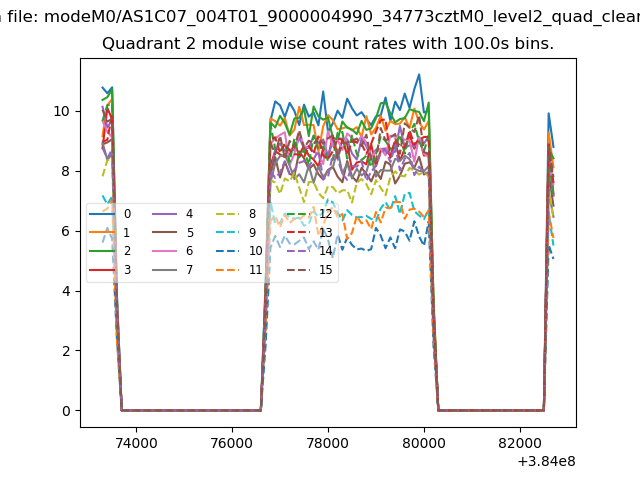
| Module-wise count rates for Quadrant B Data is divided into 100 sec bins |
 |
 |
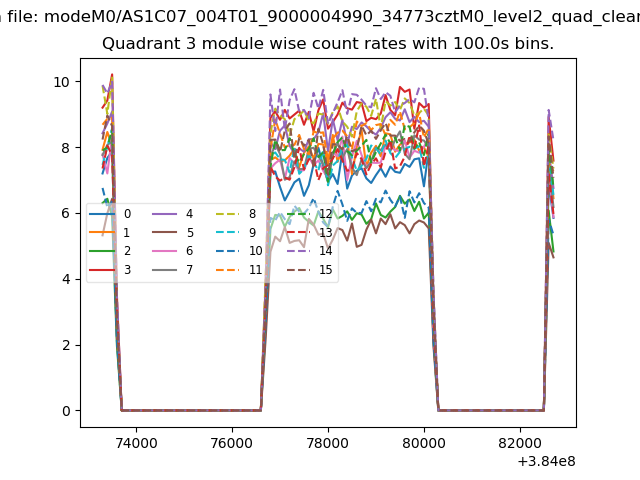
| Module-wise count rates for Quadrant C Data is divided into 100 sec bins |
 |
 |
| Module-wise count rates for Quadrant D Data is divided into 100 sec bins |
 |
 |
| Parameter | Plot |
|---|---|
| CZT HV Monitor | 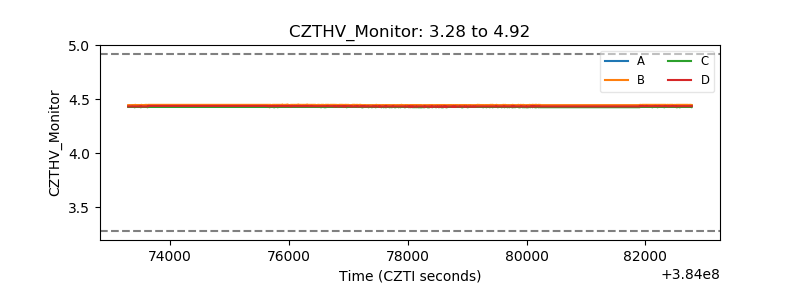 |
| D_VDD | 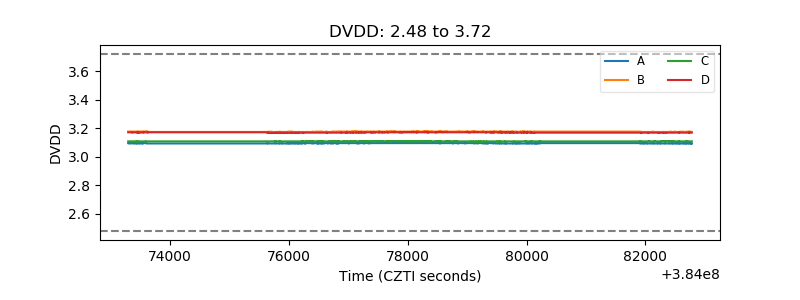 |
| Temperature 1 | 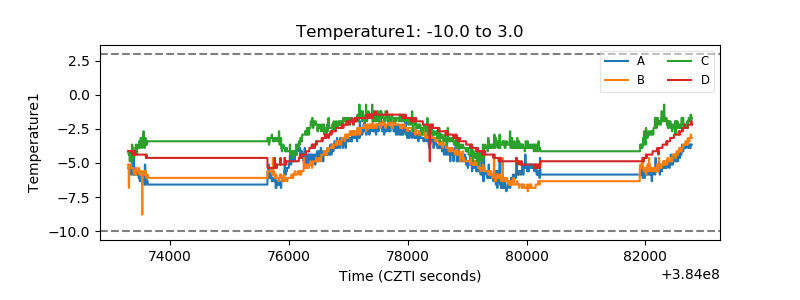 |
| Veto HV Monitor | 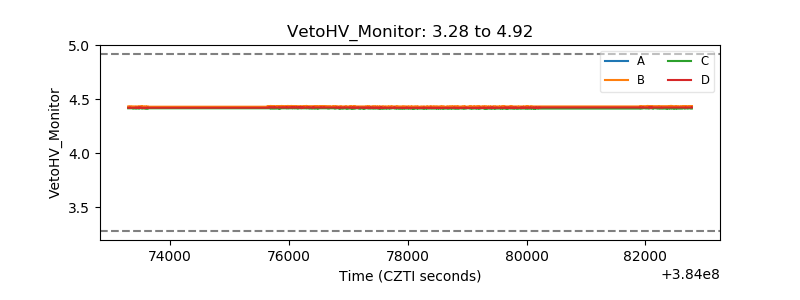 |
| Veto LLD | 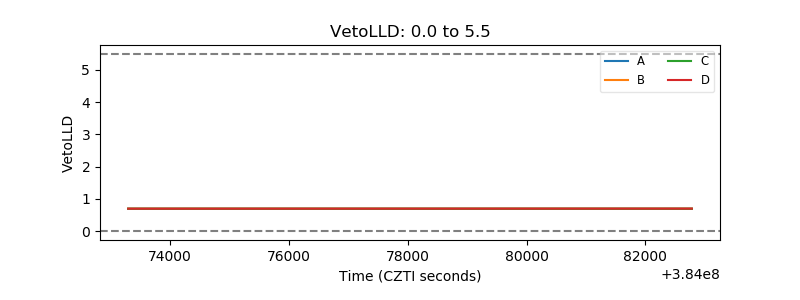 |
| Alpha Counter | 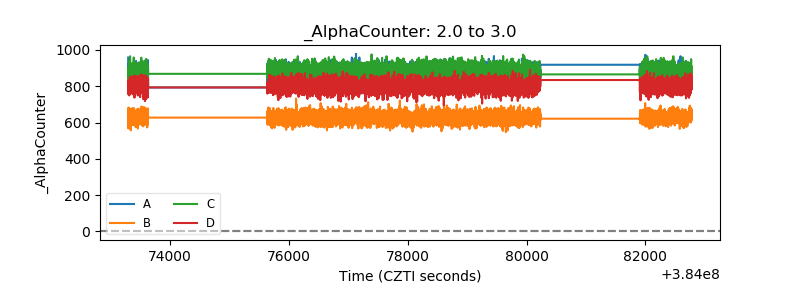 |
| _CPM_Rate | 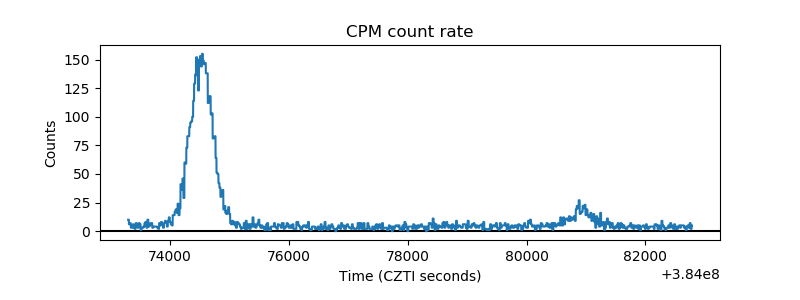 |
| CZT Counter | 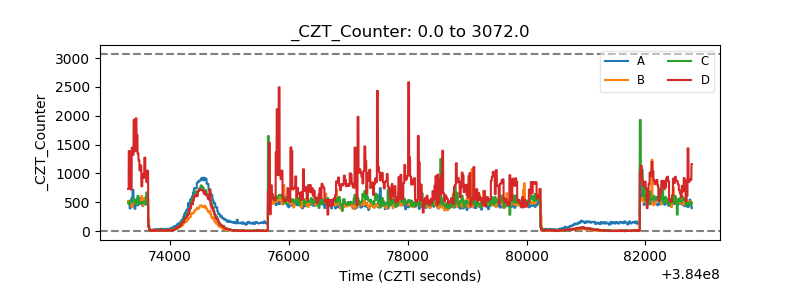 |
| +2.5 Volts monitor | 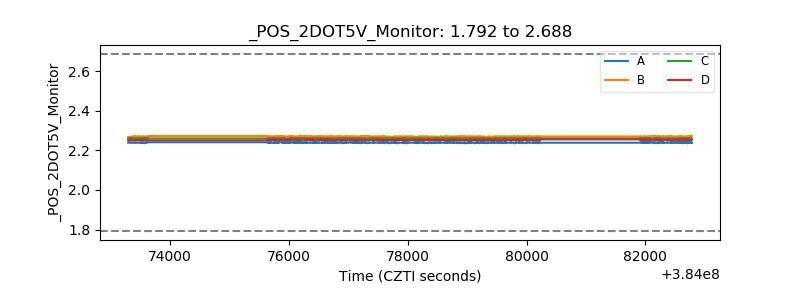 |
| +5 Volts monitor | 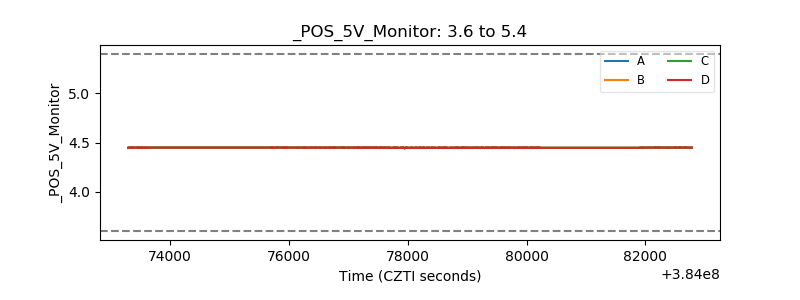 |
| _ROLL_ROT | 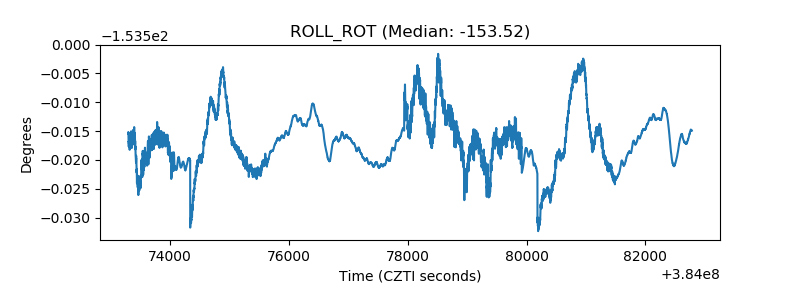 |
| _Roll_DEC | 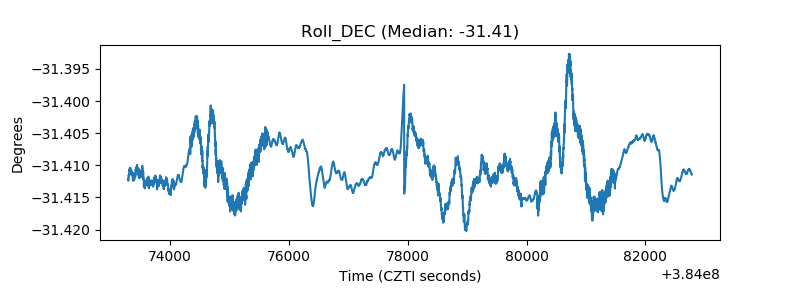 |
| _Roll_RA | 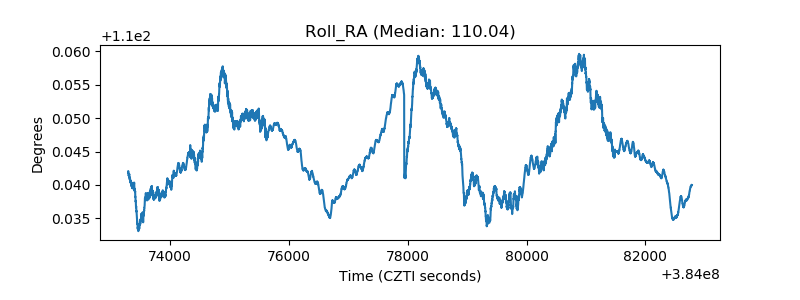 |
| Veto Counter | 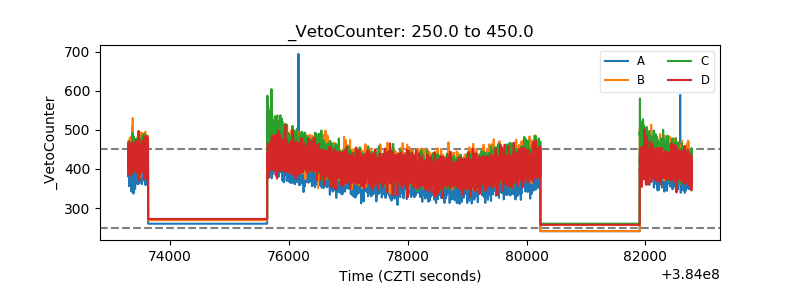 |