| Param | Original file | Final file |
|---|---|---|
| Filename | modeM0/AS1C07_004T01_9000004990_34770cztM0_level2.evt | modeM0/AS1C07_004T01_9000004990_34770cztM0_level2_quad_clean.evt |
| Size (bytes) | 552,594,240 | 47,082,240 |
| Size | 527.0 MB | 44.9 MB |
| Events in quadrant A | 2,770,227 | 282,416 |
| Events in quadrant B | 2,857,024 | 295,564 |
| Events in quadrant C | 3,025,979 | 293,147 |
| Events in quadrant D | 7,732,142 | 191,298 |
| Mode M9 | |||
|---|---|---|---|
| Quadrant | BADHDUFLAG | Total packets | Discarded packets |
| A | 0 | 28 | 0 |
| B | 0 | 28 | 0 |
| C | 0 | 28 | 0 |
| D | 0 | 29 | 0 |
| Mode M0 | |||
|---|---|---|---|
| Quadrant | BADHDUFLAG | Total packets | Discarded packets |
| A | 0 | 11054 | 2 |
| B | 0 | 11312 | 1 |
| C | 0 | 12043 | 1 |
| D | 0 | 26578 | 1 |
| Mode SS | |||
|---|---|---|---|
| Quadrant | BADHDUFLAG | Total packets | Discarded packets |
| A | 0 | 104 | 0 |
| B | 0 | 104 | 0 |
| C | 0 | 104 | 0 |
| D | 0 | 104 | 0 |
| Quadrant | Total seconds | Saturated seconds | Saturation percentage |
|---|---|---|---|
| A | 5176 | 42 | 0.811437% |
| B | 5176 | 16 | 0.309119% |
| C | 5176 | 19 | 0.367079% |
| D | 5176 | 1453 | 28.071870% |
Noise dominated data is calculated using 1-second bins in cleaned event files. If a bin has >2000 counts, and if more than 50% of those come from <1% of pixels, then it is considered to be noise-dominated and hence unusable.
| Quadrant | # 1 sec bins | Bins with >0 counts | Bins with >2000 counts | High rate bins dominated by noise | Noise dominated (total time) | Noise dominated (detector-on time) | Marked lightcurve |
|---|---|---|---|---|---|---|---|
| A | 7299 | 5177 | 26 | 26 | 0.36% | 0.50% | 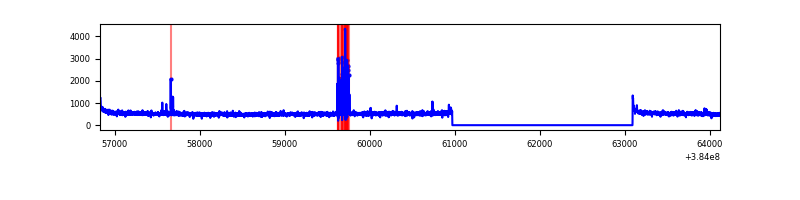 |
| B | 7299 | 5177 | 6 | 6 | 0.08% | 0.12% | 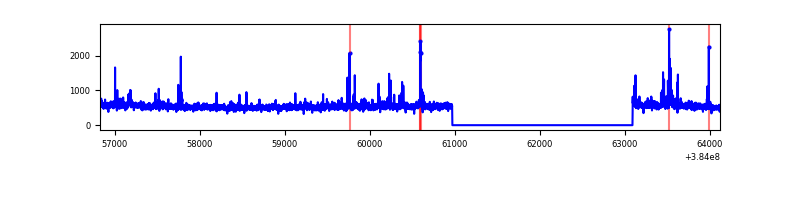 |
| C | 7299 | 5177 | 14 | 14 | 0.19% | 0.27% | 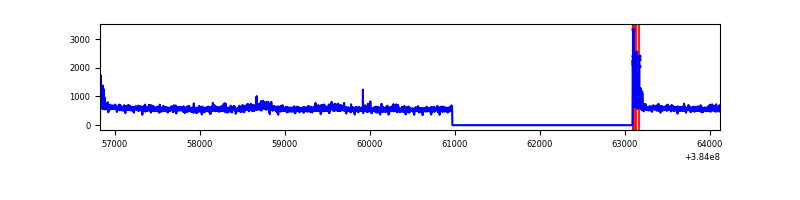 |
| D | 7299 | 5177 | 1270 | 1270 | 17.40% | 24.53% | 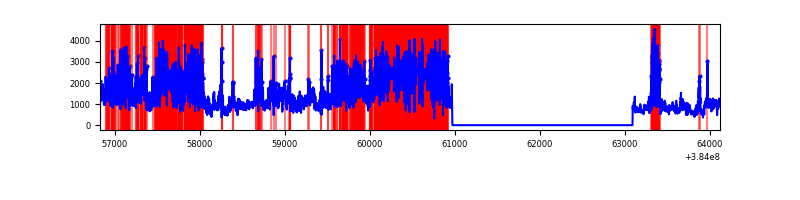 |
Top three noisy pixels from each quadrant. If the there are fewer than three noisy pixels in the level2.evt file, extra rows are filled as -1
| Pixel properties | Quadrant properties | ||||||
|---|---|---|---|---|---|---|---|
| Quadrant | DetID | PixID | Counts | Sigma | Mean | Median | Sigma |
| A | 15 | 174 | 118629 | 886.07 | 672 | 659 | 133.1 |
| A | 10 | 83 | 47699 | 353.32 | 672 | 659 | 133.1 |
| A | 13 | 254 | 9173 | 63.95 | 672 | 659 | 133.1 |
| B | 5 | 255 | 72246 | 564.61 | 679 | 662 | 126.8 |
| B | 0 | 190 | 50781 | 395.31 | 679 | 662 | 126.8 |
| B | 0 | 189 | 24767 | 190.13 | 679 | 662 | 126.8 |
| C | 15 | 214 | 224050 | 1459.26 | 671 | 679 | 153.1 |
| C | 14 | 67 | 96517 | 626.1 | 671 | 679 | 153.1 |
| C | 0 | 10 | 79790 | 516.82 | 671 | 679 | 153.1 |
| D | 10 | 118 | 1903556 | 13679.08 | 577 | 564 | 139.1 |
| D | 2 | 250 | 1243756 | 8936.31 | 577 | 564 | 139.1 |
| D | 8 | 195 | 1233537 | 8862.85 | 577 | 564 | 139.1 |
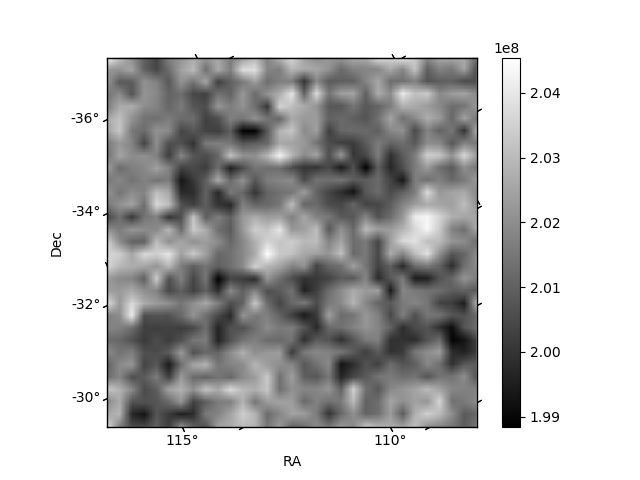
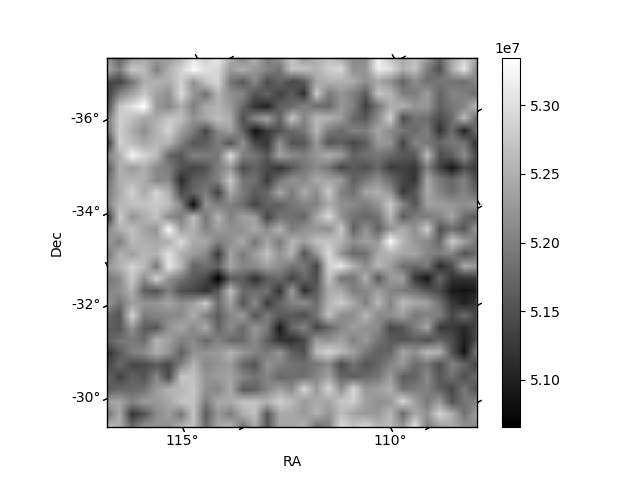
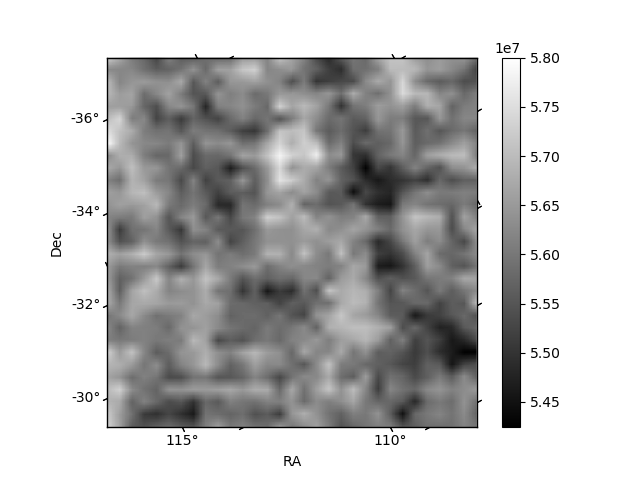
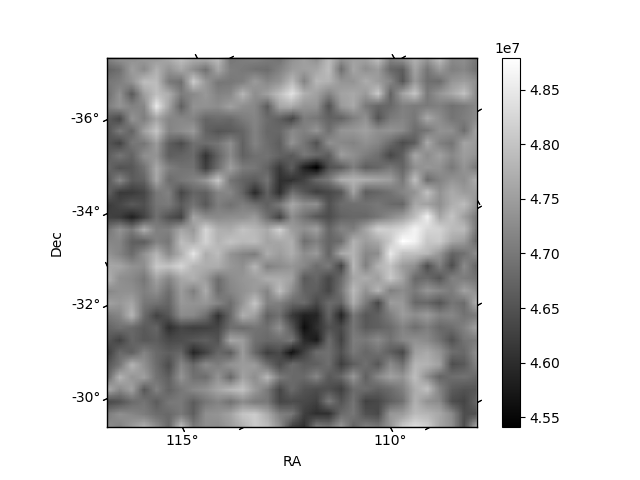
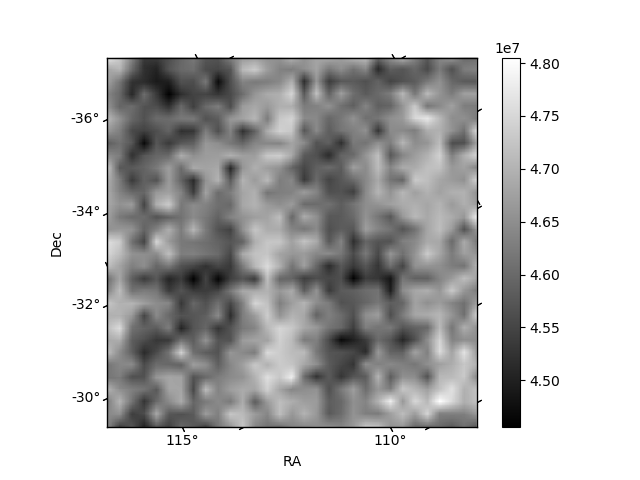
Histogram calculated using DETX and DETY for each event in the final _common_clean file
| Quadrant A | 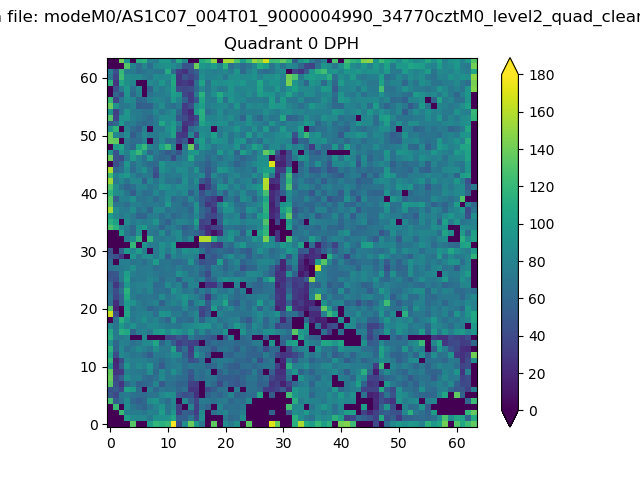 |
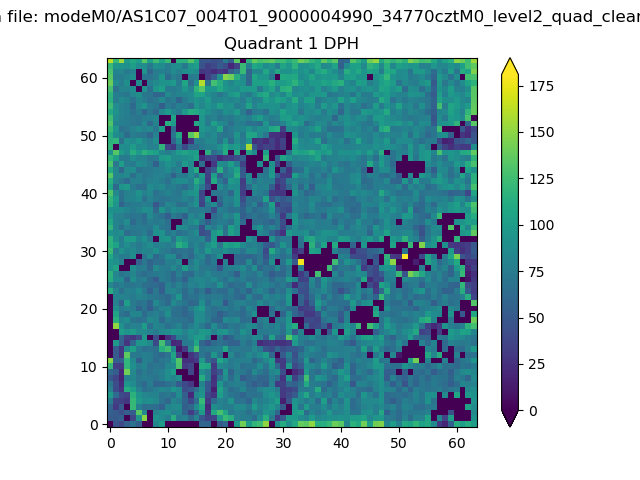 |
Quadrant B |
|---|---|---|---|
| Quadrant D | 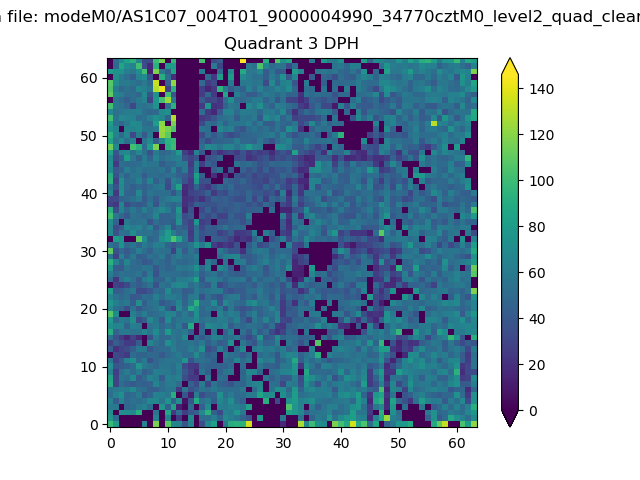 |
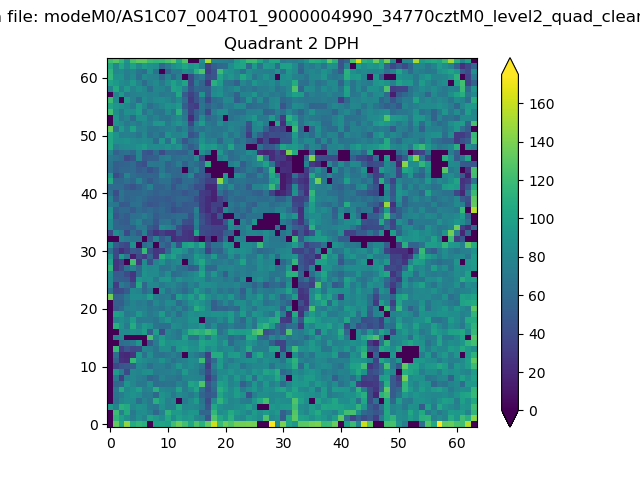 |
Quadrant C |
| Plot type | Count rate plots | Images |
|---|---|---|
| Comparison with Poisson distribution Blue bars denote a histogram of data divided into 1 sec bins. Red curve is a Poisson curve with rate = median count rate of data. |
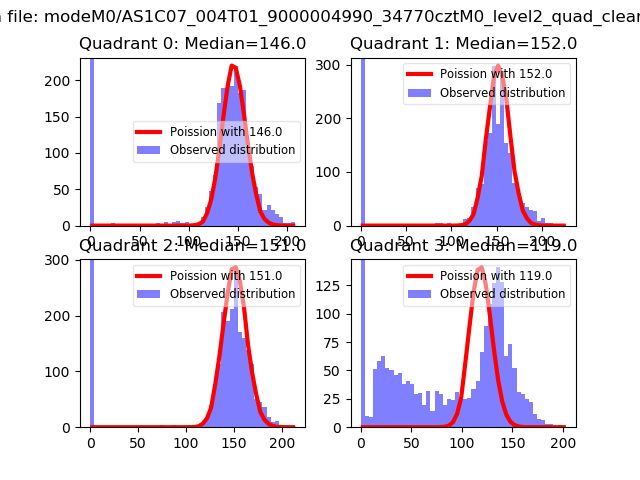 |
 |
| Quadrant-wise count rates Data is divided into 100 sec bins |
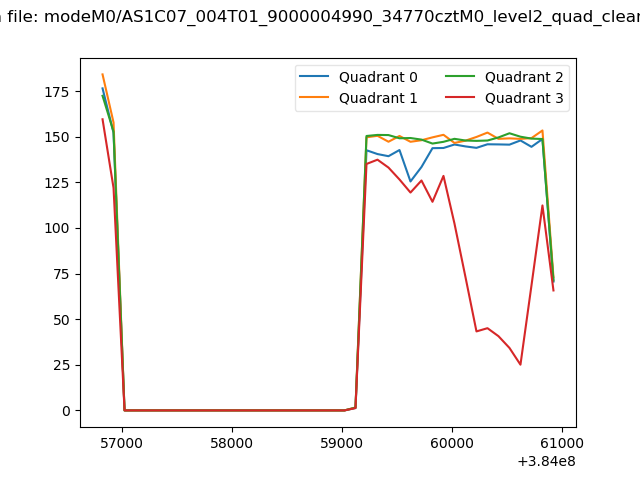 |
|
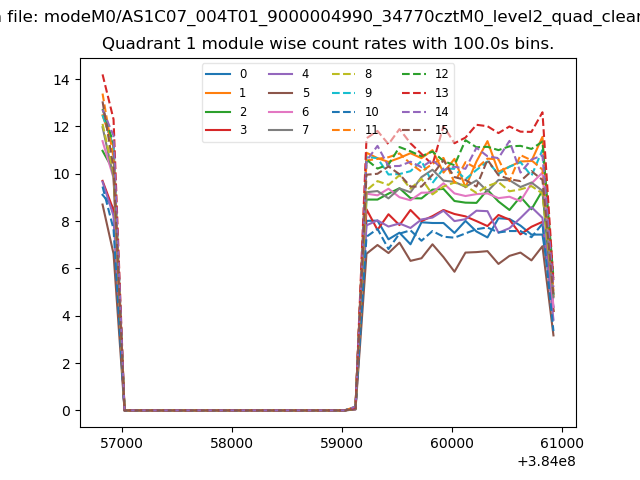
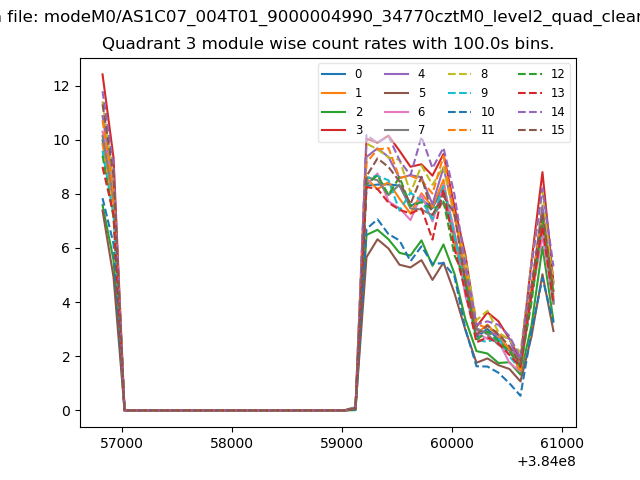
| Module-wise count rates for Quadrant A Data is divided into 100 sec bins |
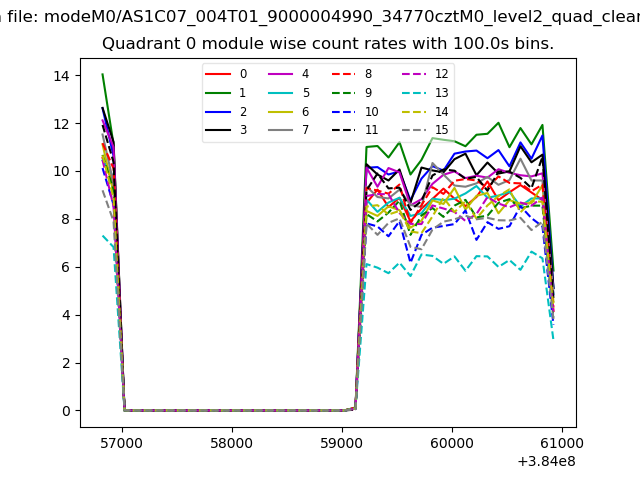 |
 |
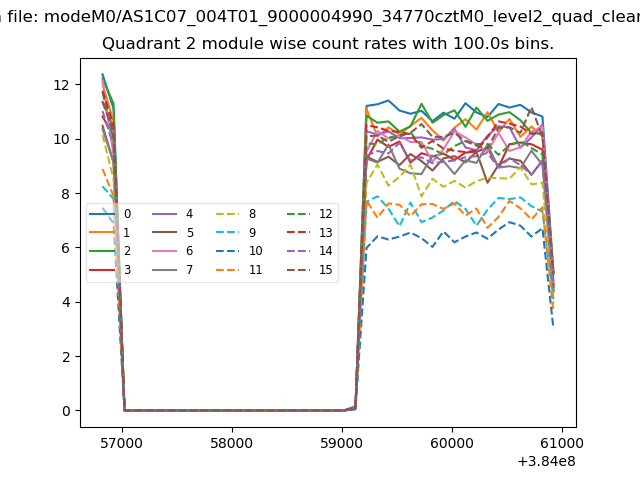
| Module-wise count rates for Quadrant B Data is divided into 100 sec bins |
 |
 |
| Module-wise count rates for Quadrant C Data is divided into 100 sec bins |
 |
 |
| Module-wise count rates for Quadrant D Data is divided into 100 sec bins |
 |
 |
| Parameter | Plot |
|---|---|
| CZT HV Monitor | 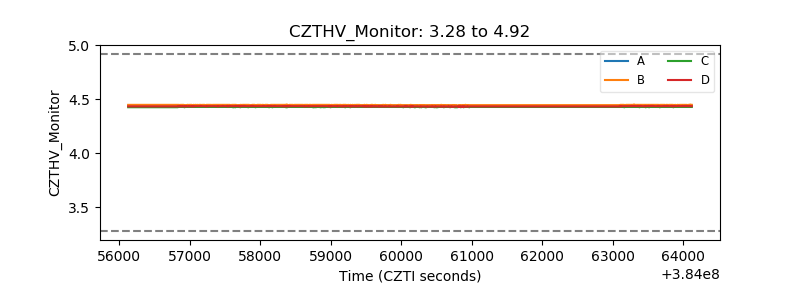 |
| D_VDD | 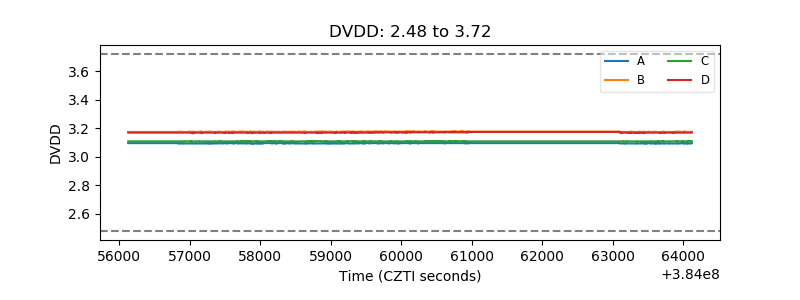 |
| Temperature 1 | 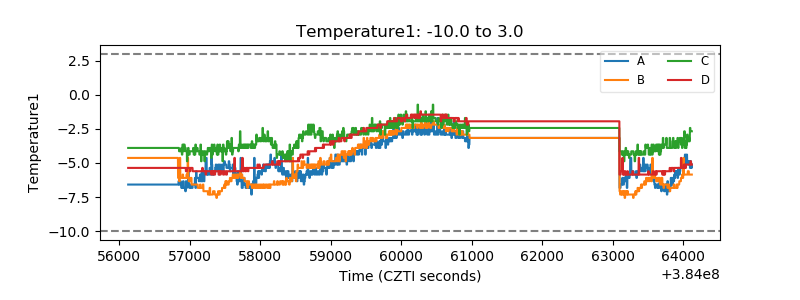 |
| Veto HV Monitor | 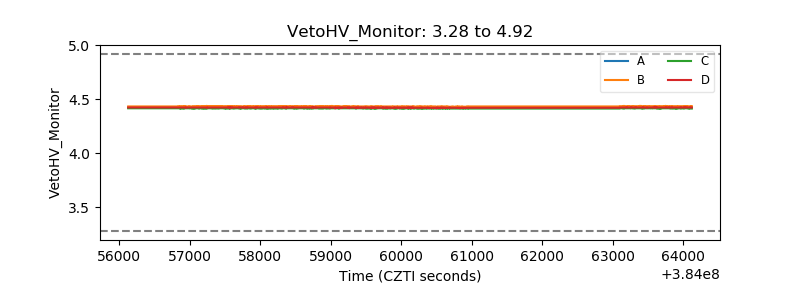 |
| Veto LLD | 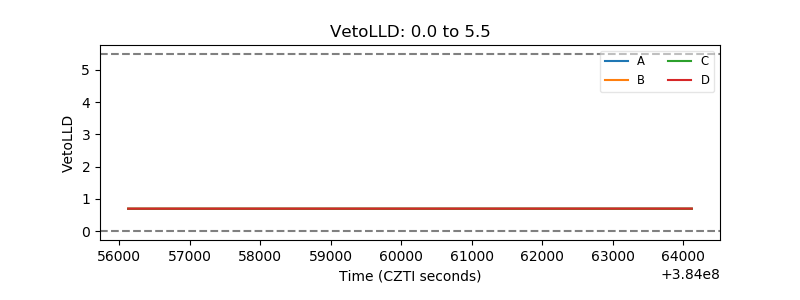 |
| Alpha Counter | 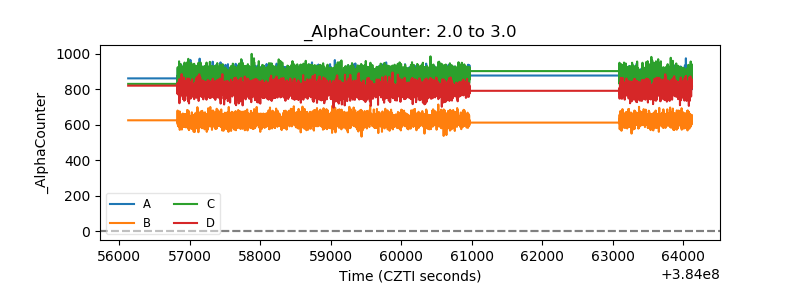 |
| _CPM_Rate | 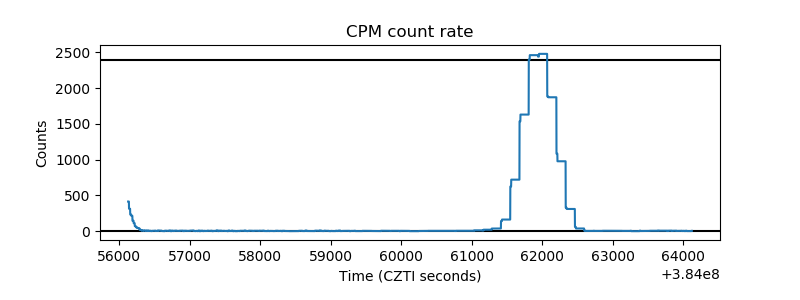 |
| CZT Counter | 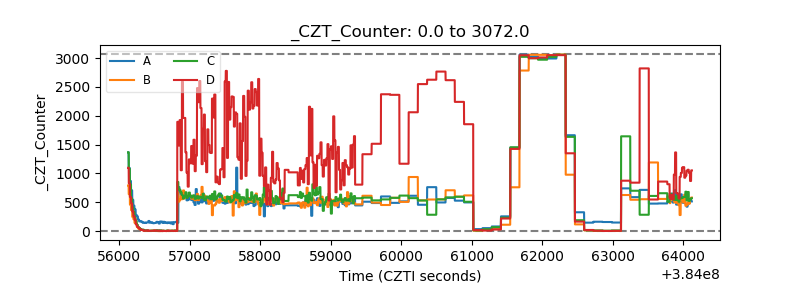 |
| +2.5 Volts monitor | 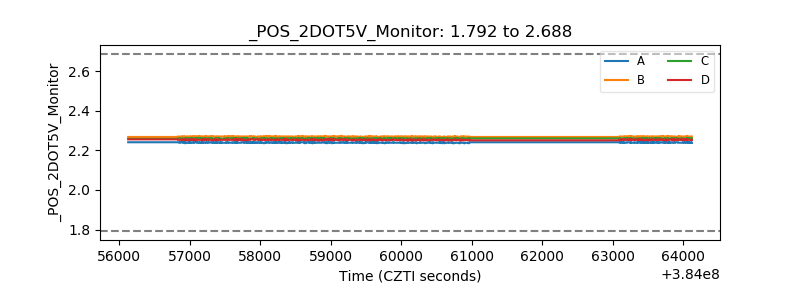 |
| +5 Volts monitor | 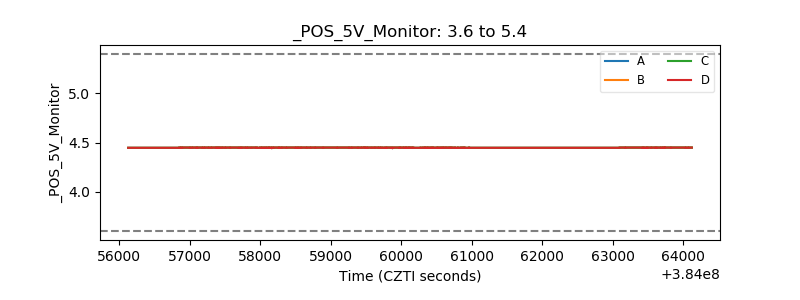 |
| _ROLL_ROT | 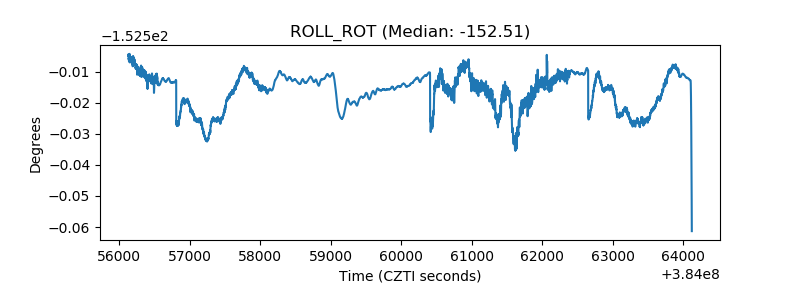 |
| _Roll_DEC | 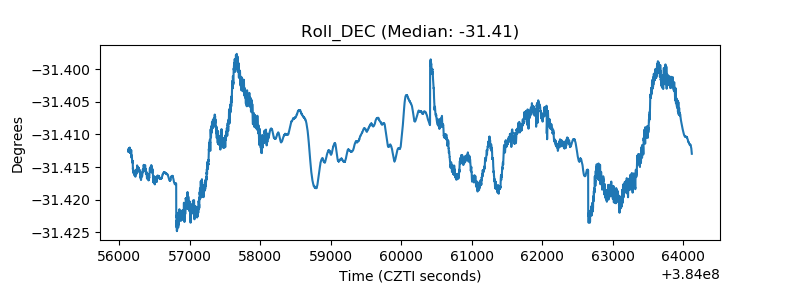 |
| _Roll_RA | 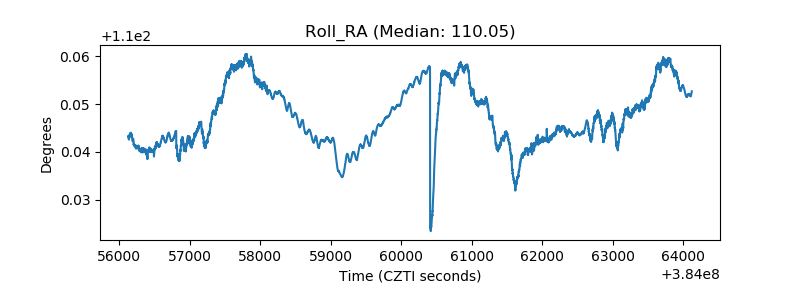 |
| Veto Counter | 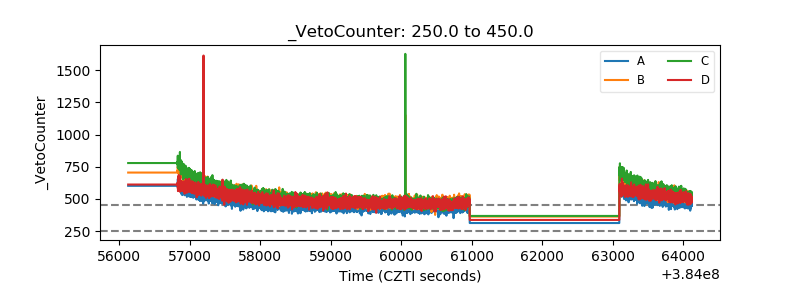 |