| Param | Original file | Final file |
|---|---|---|
| Filename | modeM0/AS1C07_004T01_9000004990_34769cztM0_level2.evt | modeM0/AS1C07_004T01_9000004990_34769cztM0_level2_quad_clean.evt |
| Size (bytes) | 561,746,880 | 54,924,480 |
| Size | 535.7 MB | 52.4 MB |
| Events in quadrant A | 3,723,606 | 325,809 |
| Events in quadrant B | 2,993,519 | 347,482 |
| Events in quadrant C | 3,069,994 | 341,542 |
| Events in quadrant D | 6,871,281 | 280,823 |
| Mode M9 | |||
|---|---|---|---|
| Quadrant | BADHDUFLAG | Total packets | Discarded packets |
| A | 0 | 21 | 0 |
| B | 0 | 21 | 0 |
| C | 0 | 21 | 0 |
| D | 0 | 22 | 0 |
| Mode M0 | |||
|---|---|---|---|
| Quadrant | BADHDUFLAG | Total packets | Discarded packets |
| A | 0 | 14101 | 2 |
| B | 0 | 11803 | 1 |
| C | 0 | 12196 | 1 |
| D | 0 | 24104 | 1 |
| Mode SS | |||
|---|---|---|---|
| Quadrant | BADHDUFLAG | Total packets | Discarded packets |
| A | 0 | 106 | 0 |
| B | 0 | 106 | 0 |
| C | 0 | 106 | 0 |
| D | 0 | 106 | 0 |
| Quadrant | Total seconds | Saturated seconds | Saturation percentage |
|---|---|---|---|
| A | 5240 | 266 | 5.076336% |
| B | 5240 | 56 | 1.068702% |
| C | 5240 | 27 | 0.515267% |
| D | 5240 | 916 | 17.480916% |
Noise dominated data is calculated using 1-second bins in cleaned event files. If a bin has >2000 counts, and if more than 50% of those come from <1% of pixels, then it is considered to be noise-dominated and hence unusable.
| Quadrant | # 1 sec bins | Bins with >0 counts | Bins with >2000 counts | High rate bins dominated by noise | Noise dominated (total time) | Noise dominated (detector-on time) | Marked lightcurve |
|---|---|---|---|---|---|---|---|
| A | 7273 | 5241 | 285 | 285 | 3.92% | 5.44% | 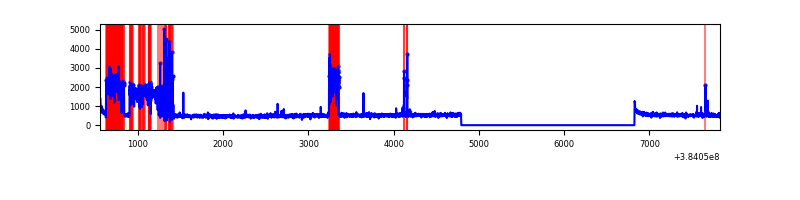 |
| B | 7273 | 5241 | 34 | 34 | 0.47% | 0.65% |  |
| C | 7273 | 5241 | 16 | 16 | 0.22% | 0.31% | 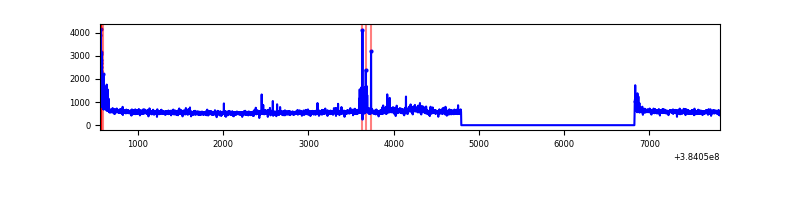 |
| D | 7273 | 5241 | 761 | 761 | 10.46% | 14.52% | 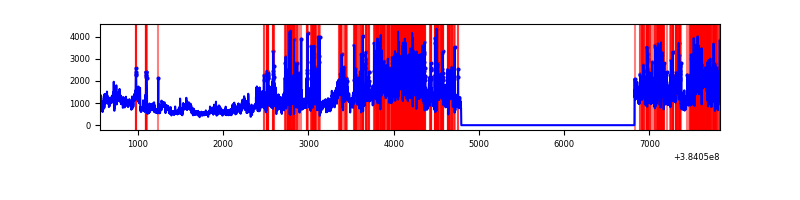 |
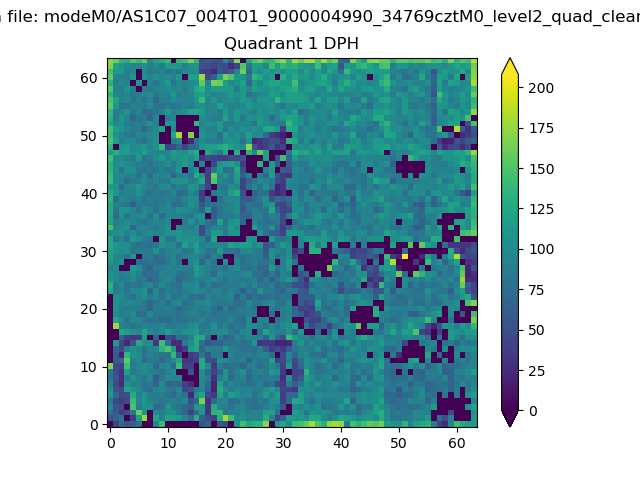
Top three noisy pixels from each quadrant. If the there are fewer than three noisy pixels in the level2.evt file, extra rows are filled as -1
| Pixel properties | Quadrant properties | ||||||
|---|---|---|---|---|---|---|---|
| Quadrant | DetID | PixID | Counts | Sigma | Mean | Median | Sigma |
| A | 15 | 169 | 1051545 | 7926.64 | 667 | 655 | 132.6 |
| A | 10 | 83 | 47403 | 352.61 | 667 | 655 | 132.6 |
| A | 15 | 174 | 43452 | 322.81 | 667 | 655 | 132.6 |
| B | 5 | 255 | 95149 | 738.55 | 683 | 666 | 127.9 |
| B | 5 | 172 | 87117 | 675.76 | 683 | 666 | 127.9 |
| B | 0 | 190 | 63733 | 492.98 | 683 | 666 | 127.9 |
| C | 15 | 214 | 225039 | 1445.55 | 675 | 683 | 155.2 |
| C | 0 | 10 | 89479 | 572.12 | 675 | 683 | 155.2 |
| C | 14 | 67 | 76416 | 487.95 | 675 | 683 | 155.2 |
| D | 12 | 227 | 1580701 | 10297.09 | 625 | 608 | 153.5 |
| D | 2 | 250 | 1082762 | 7052.14 | 625 | 608 | 153.5 |
| D | 8 | 195 | 1054518 | 6868.08 | 625 | 608 | 153.5 |
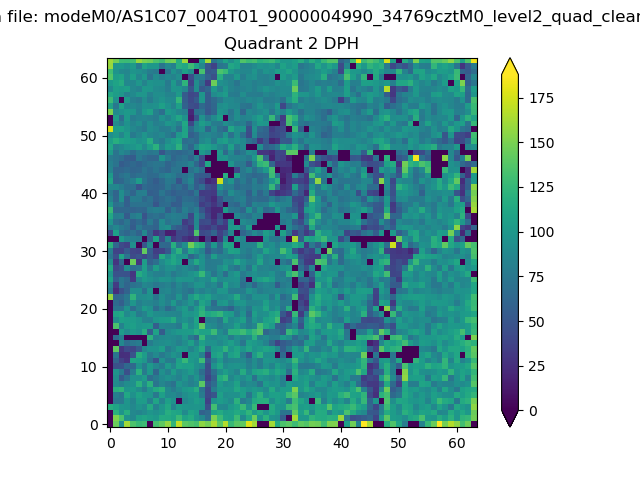
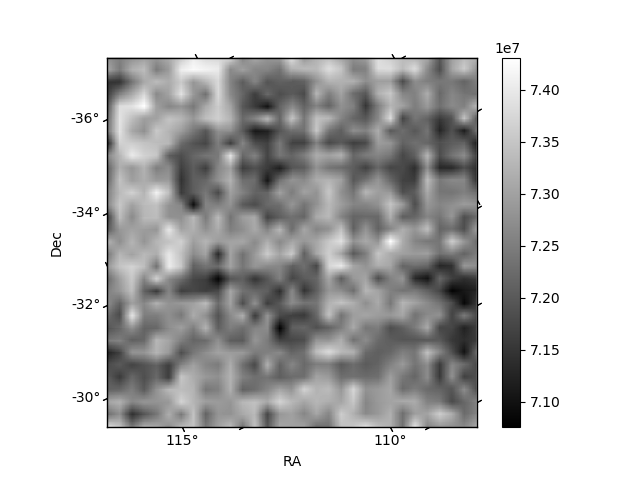
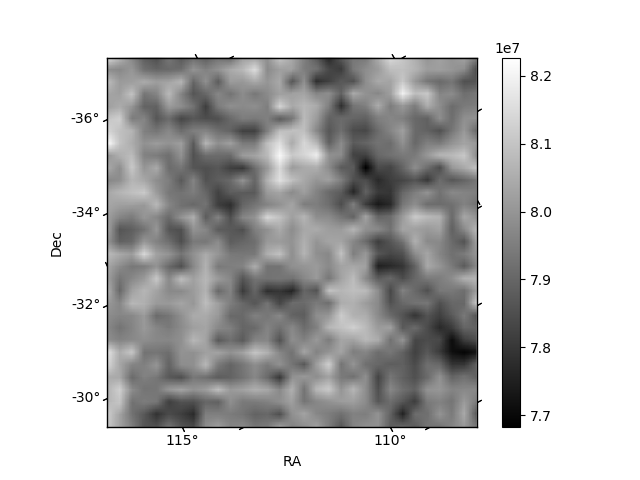
Histogram calculated using DETX and DETY for each event in the final _common_clean file
| Quadrant A |  |
 |
Quadrant B |
|---|---|---|---|
| Quadrant D | 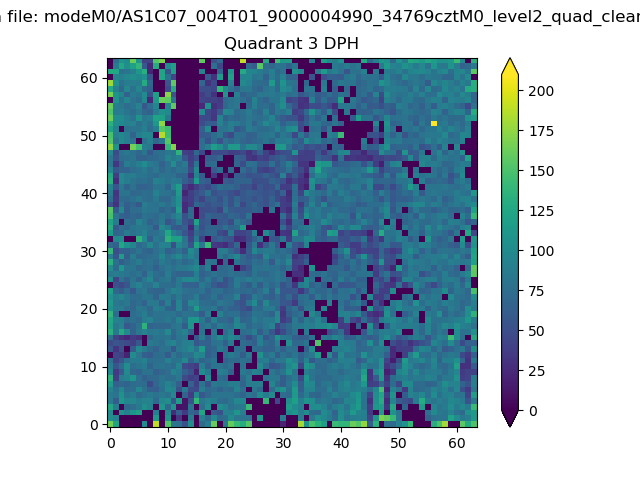 |
 |
Quadrant C |
| Plot type | Count rate plots | Images |
|---|---|---|
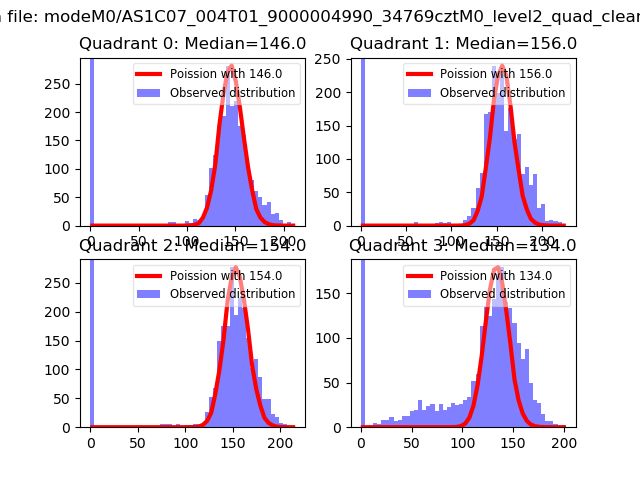
| Comparison with Poisson distribution Blue bars denote a histogram of data divided into 1 sec bins. Red curve is a Poisson curve with rate = median count rate of data. |
 |
 |
| Quadrant-wise count rates Data is divided into 100 sec bins |
 |
|
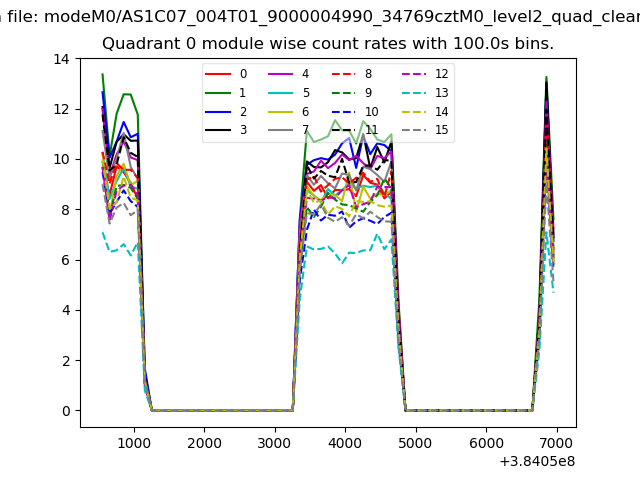
| Module-wise count rates for Quadrant A Data is divided into 100 sec bins |
 |
 |
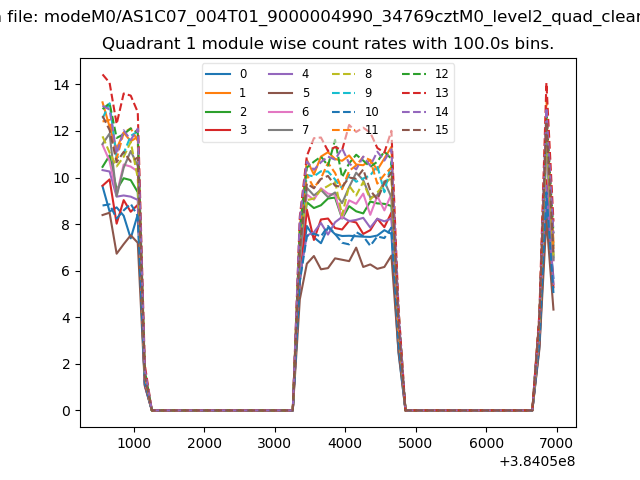
| Module-wise count rates for Quadrant B Data is divided into 100 sec bins |
 |
 |
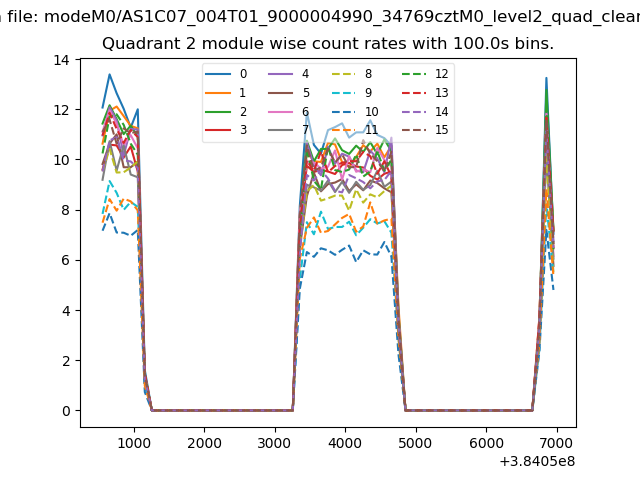
| Module-wise count rates for Quadrant C Data is divided into 100 sec bins |
 |
 |
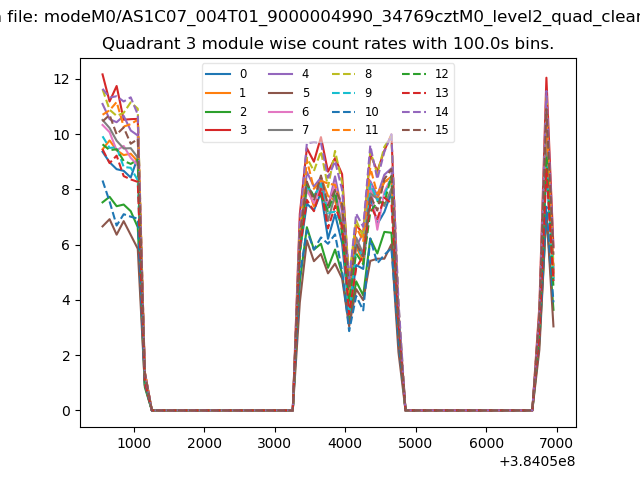
| Module-wise count rates for Quadrant D Data is divided into 100 sec bins |
 |
 |
| Parameter | Plot |
|---|---|
| CZT HV Monitor | 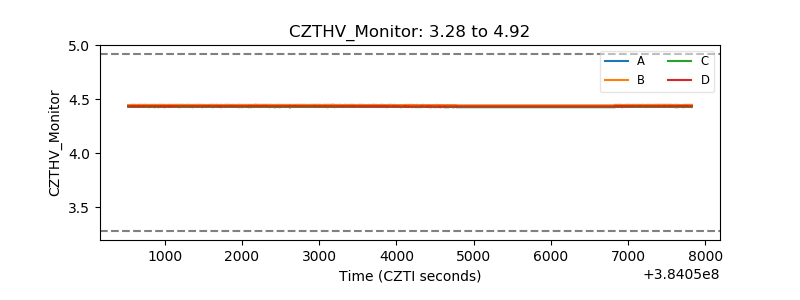 |
| D_VDD | 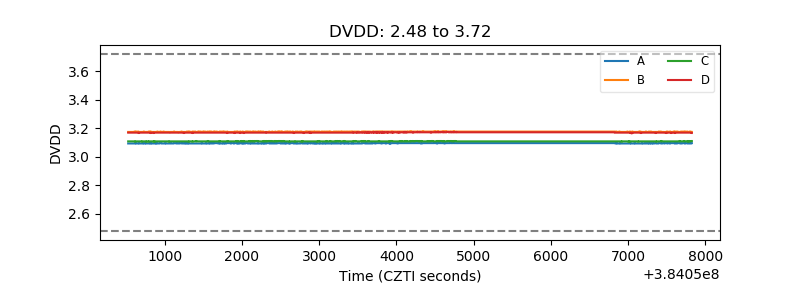 |
| Temperature 1 | 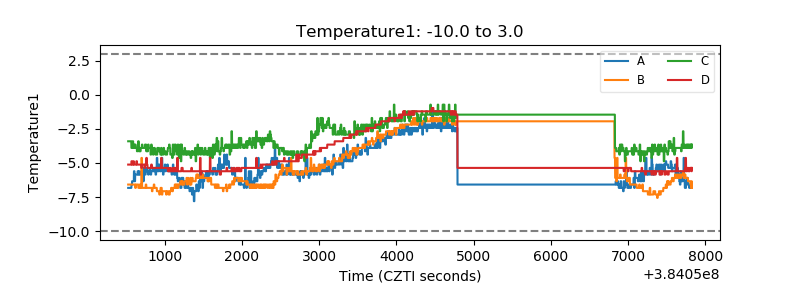 |
| Veto HV Monitor | 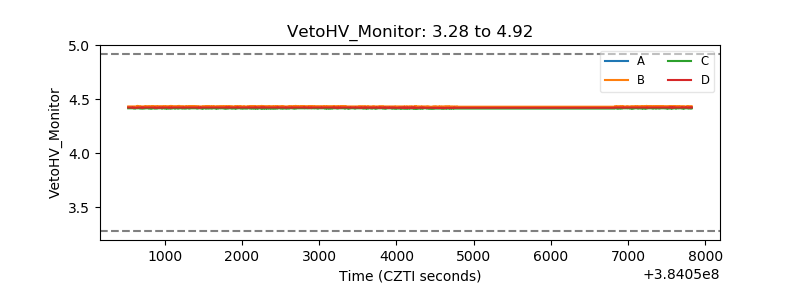 |
| Veto LLD | 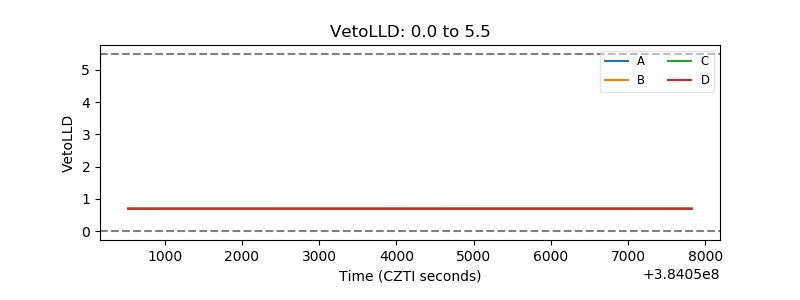 |
| Alpha Counter | 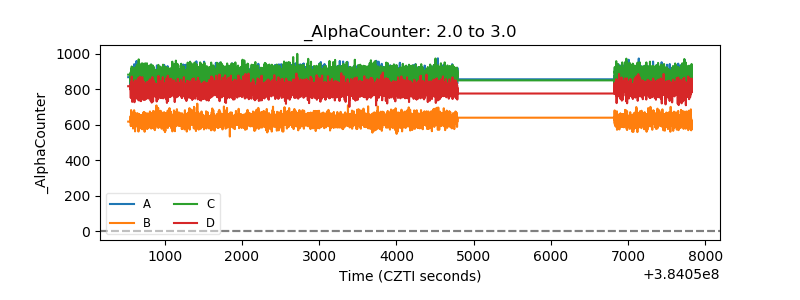 |
| _CPM_Rate | 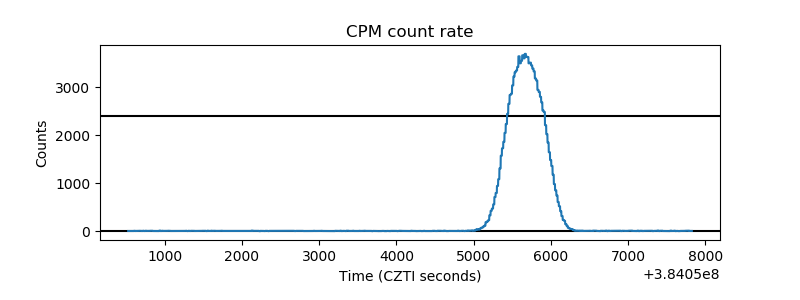 |
| CZT Counter | 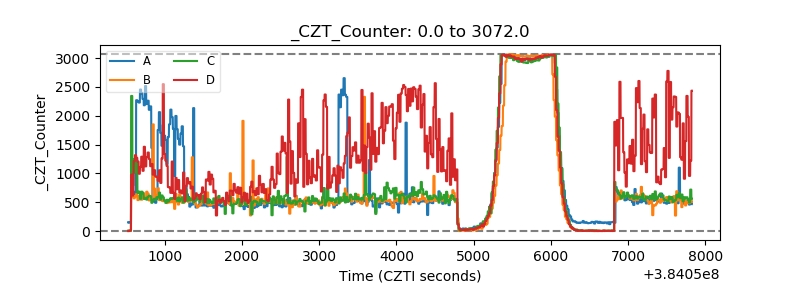 |
| +2.5 Volts monitor | 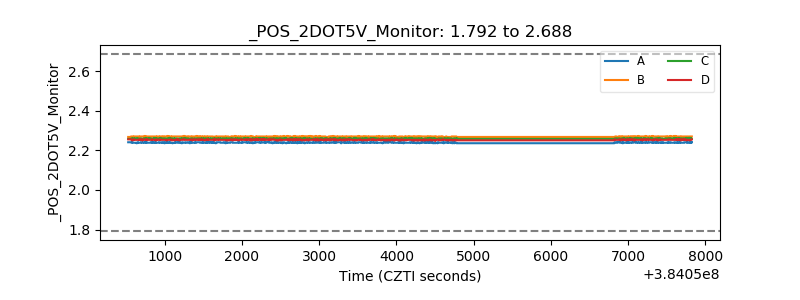 |
| +5 Volts monitor | 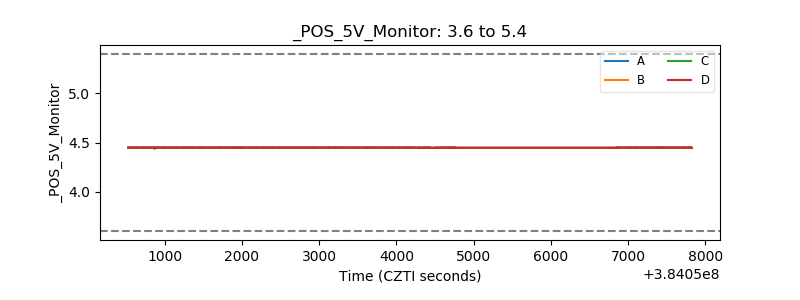 |
| _ROLL_ROT | 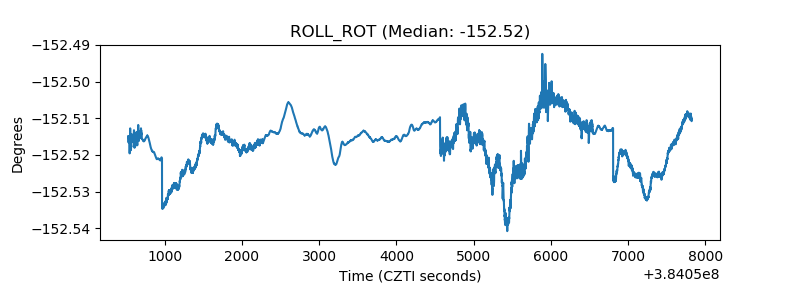 |
| _Roll_DEC |  |
| _Roll_RA | 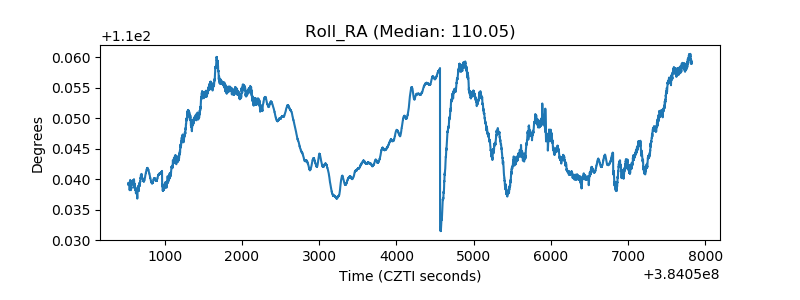 |
| Veto Counter | 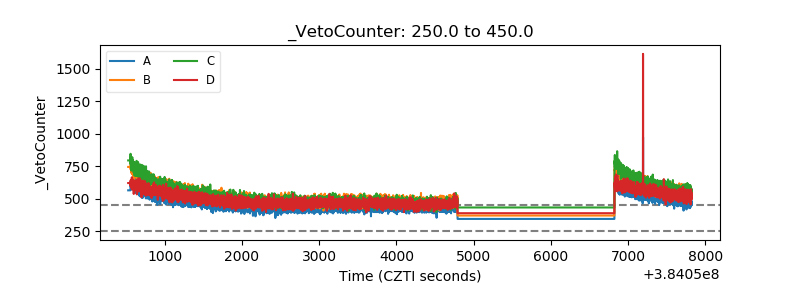 |