| Param | Original file | Final file |
|---|---|---|
| Filename | modeM0/AS1C07_004T01_9000004990_34768cztM0_level2.evt | modeM0/AS1C07_004T01_9000004990_34768cztM0_level2_quad_clean.evt |
| Size (bytes) | 505,800,000 | 65,283,840 |
| Size | 482.4 MB | 62.3 MB |
| Events in quadrant A | 4,484,047 | 392,130 |
| Events in quadrant B | 3,026,393 | 420,254 |
| Events in quadrant C | 3,102,437 | 409,259 |
| Events in quadrant D | 4,337,127 | 374,075 |
| Mode M9 | |||
|---|---|---|---|
| Quadrant | BADHDUFLAG | Total packets | Discarded packets |
| A | 0 | 34 | 0 |
| B | 0 | 34 | 0 |
| C | 0 | 34 | 0 |
| D | 0 | 35 | 0 |
| Mode M0 | |||
|---|---|---|---|
| Quadrant | BADHDUFLAG | Total packets | Discarded packets |
| A | 0 | 16931 | 3 |
| B | 0 | 12148 | 2 |
| C | 0 | 12220 | 2 |
| D | 0 | 16654 | 2 |
| Mode SS | |||
|---|---|---|---|
| Quadrant | BADHDUFLAG | Total packets | Discarded packets |
| A | 0 | 110 | 0 |
| B | 0 | 110 | 0 |
| C | 0 | 110 | 0 |
| D | 0 | 110 | 0 |
| Quadrant | Total seconds | Saturated seconds | Saturation percentage |
|---|---|---|---|
| A | 5443 | 197 | 3.619328% |
| B | 5443 | 40 | 0.734889% |
| C | 5443 | 42 | 0.771633% |
| D | 5443 | 28 | 0.514422% |
Noise dominated data is calculated using 1-second bins in cleaned event files. If a bin has >2000 counts, and if more than 50% of those come from <1% of pixels, then it is considered to be noise-dominated and hence unusable.
| Quadrant | # 1 sec bins | Bins with >0 counts | Bins with >2000 counts | High rate bins dominated by noise | Noise dominated (total time) | Noise dominated (detector-on time) | Marked lightcurve |
|---|---|---|---|---|---|---|---|
| A | 7386 | 5444 | 213 | 213 | 2.88% | 3.91% | 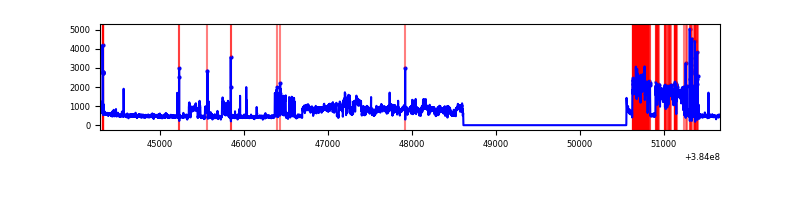 |
| B | 7386 | 5444 | 25 | 25 | 0.34% | 0.46% | 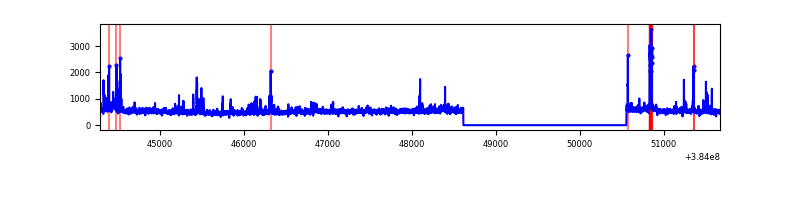 |
| C | 7386 | 5444 | 32 | 32 | 0.43% | 0.59% | 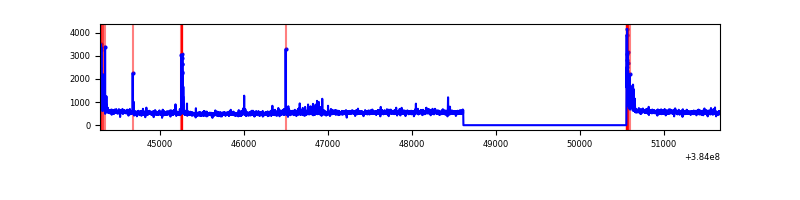 |
| D | 7386 | 5444 | 27 | 27 | 0.37% | 0.50% | 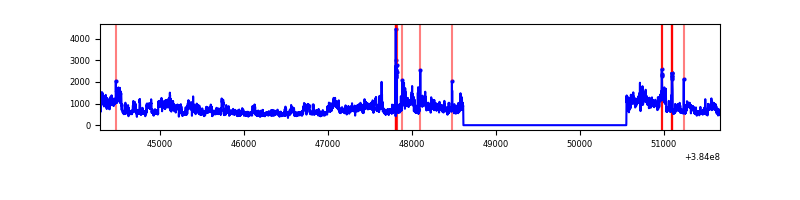 |
Top three noisy pixels from each quadrant. If the there are fewer than three noisy pixels in the level2.evt file, extra rows are filled as -1
| Pixel properties | Quadrant properties | ||||||
|---|---|---|---|---|---|---|---|
| Quadrant | DetID | PixID | Counts | Sigma | Mean | Median | Sigma |
| A | 15 | 169 | 1817492 | 13497.3 | 669 | 656 | 134.6 |
| A | 10 | 83 | 46466 | 340.32 | 669 | 656 | 134.6 |
| A | 15 | 174 | 24824 | 179.54 | 669 | 656 | 134.6 |
| B | 5 | 172 | 123318 | 940.68 | 686 | 670 | 130.4 |
| B | 5 | 255 | 59439 | 450.75 | 686 | 670 | 130.4 |
| B | 0 | 190 | 57222 | 433.74 | 686 | 670 | 130.4 |
| C | 15 | 214 | 233091 | 1494.04 | 672 | 678 | 155.6 |
| C | 0 | 10 | 130188 | 832.54 | 672 | 678 | 155.6 |
| C | 0 | 207 | 78544 | 500.55 | 672 | 678 | 155.6 |
| D | 8 | 195 | 1264693 | 7912.37 | 657 | 641 | 159.8 |
| D | 12 | 227 | 367777 | 2298.1 | 657 | 641 | 159.8 |
| D | 13 | 249 | 55070 | 340.7 | 657 | 641 | 159.8 |
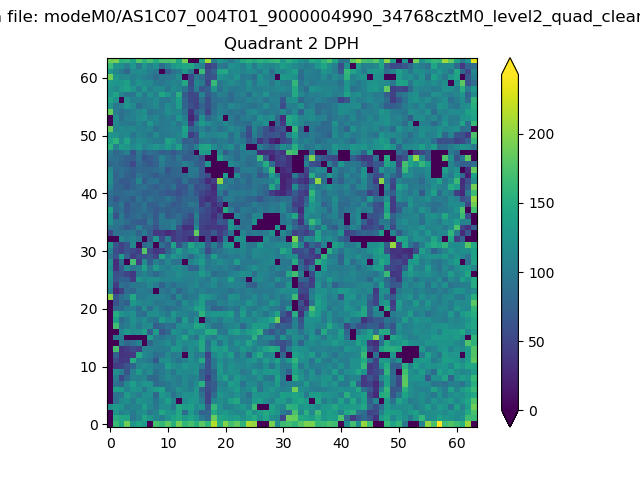
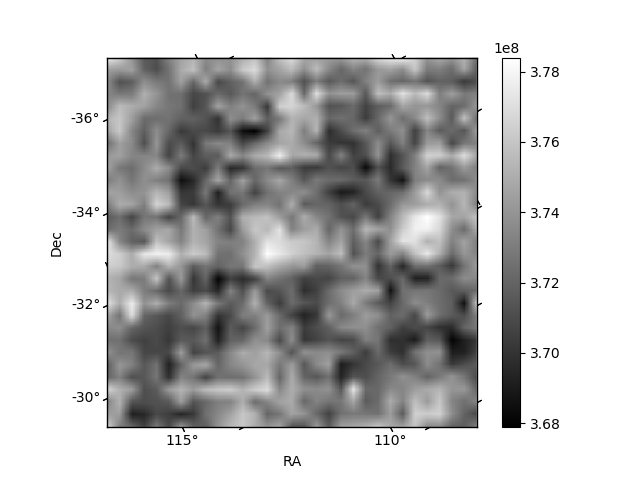
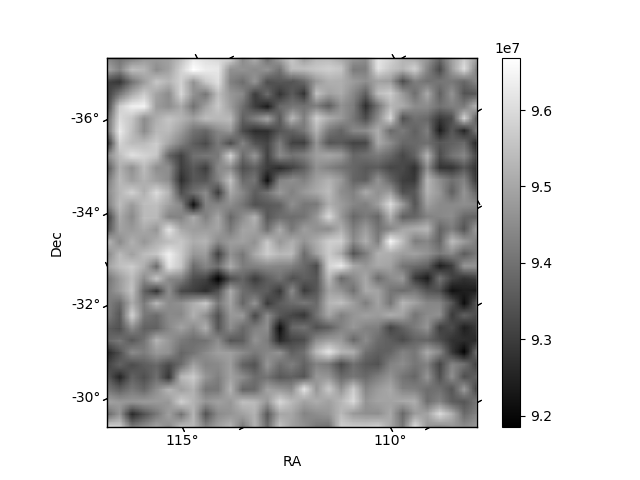
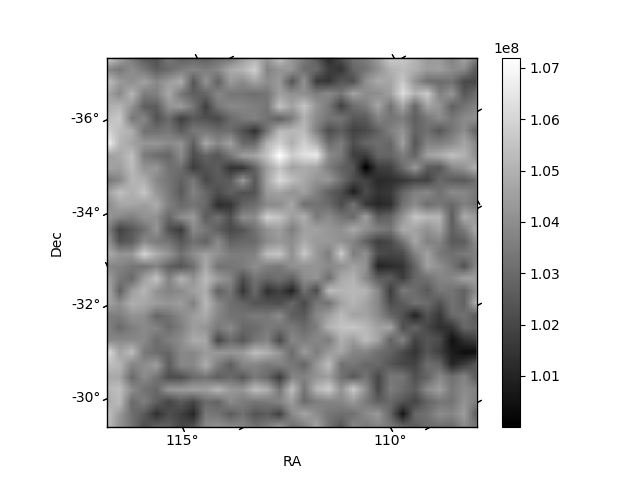
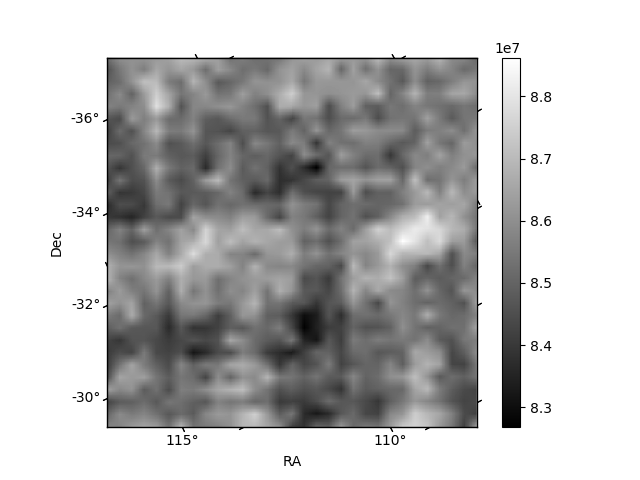
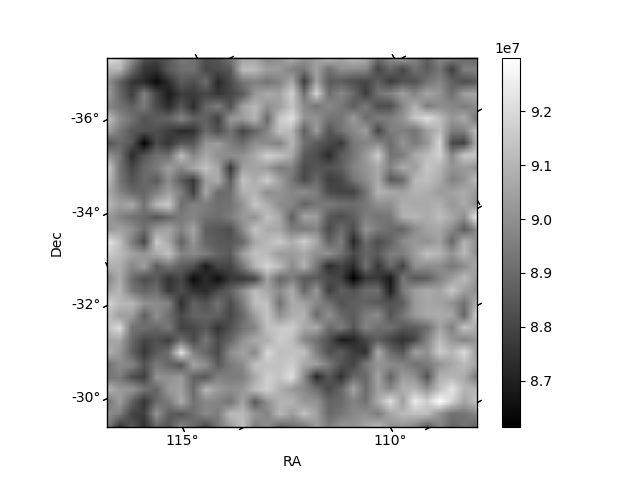
Histogram calculated using DETX and DETY for each event in the final _common_clean file
| Quadrant A | 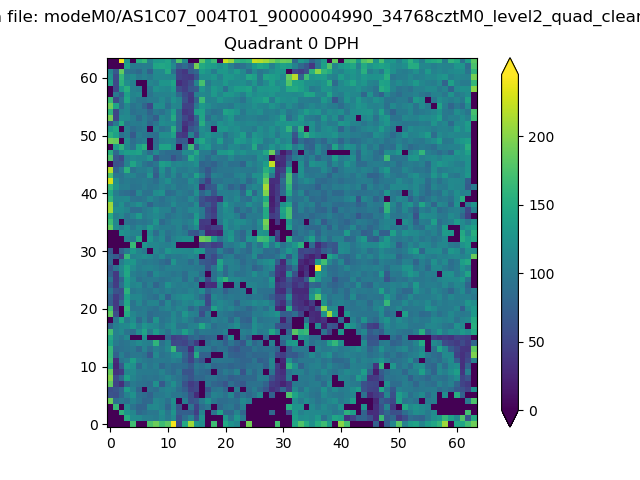 |
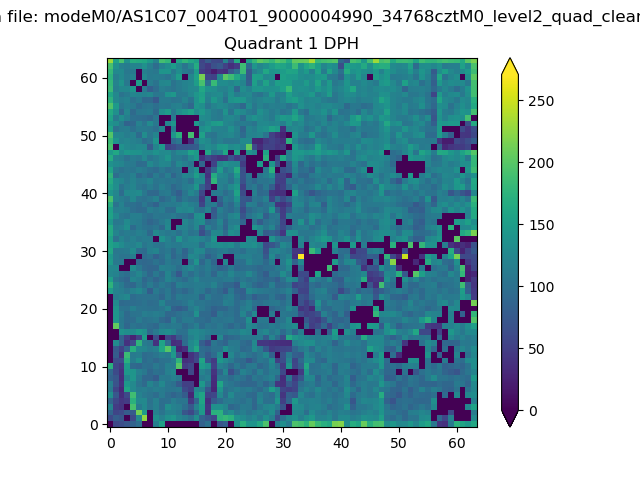 |
Quadrant B |
|---|---|---|---|
| Quadrant D | 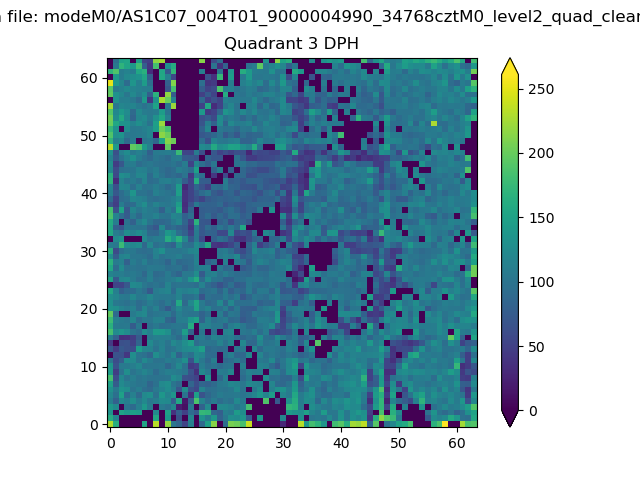 |
 |
Quadrant C |
| Plot type | Count rate plots | Images |
|---|---|---|
| Comparison with Poisson distribution Blue bars denote a histogram of data divided into 1 sec bins. Red curve is a Poisson curve with rate = median count rate of data. |
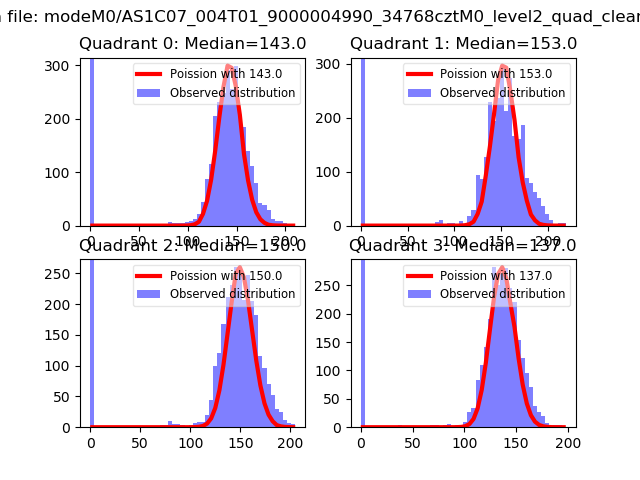 |
 |
| Quadrant-wise count rates Data is divided into 100 sec bins |
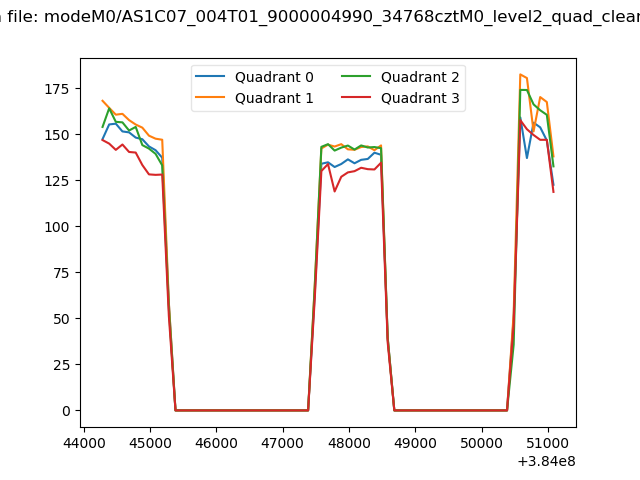 |
|
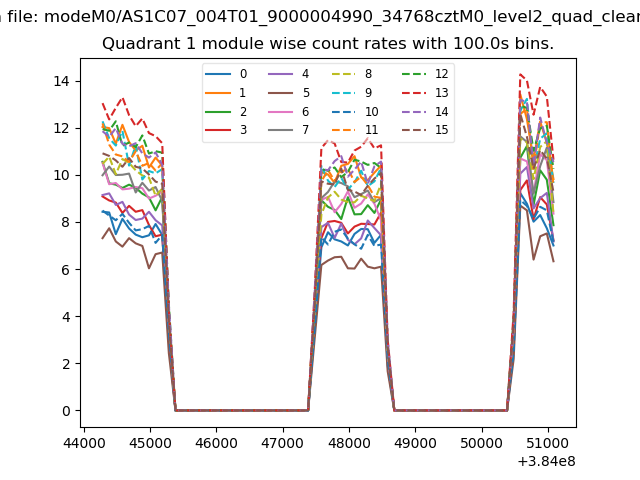
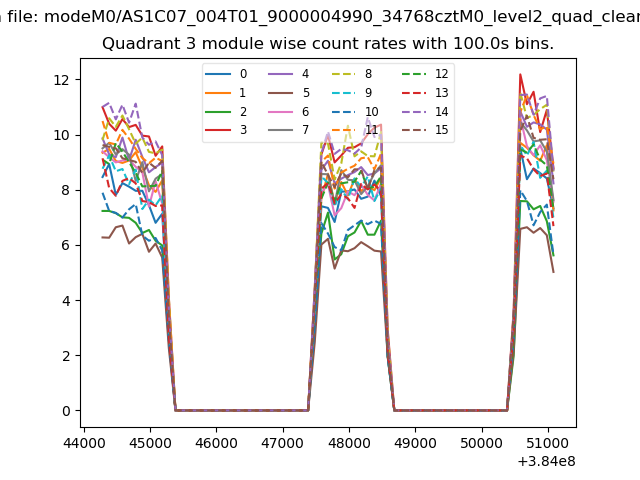
| Module-wise count rates for Quadrant A Data is divided into 100 sec bins |
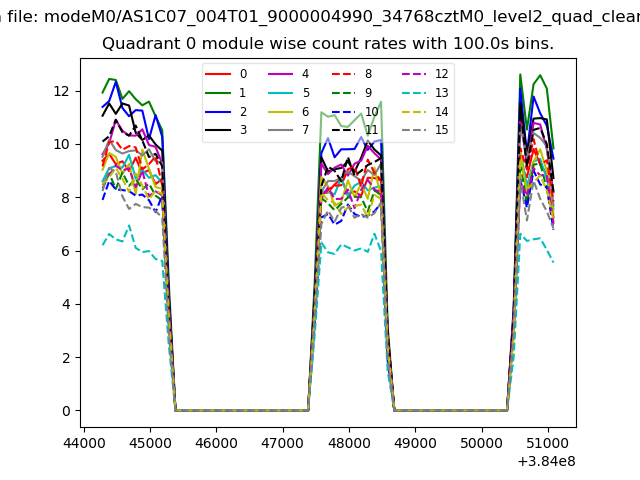 |
 |
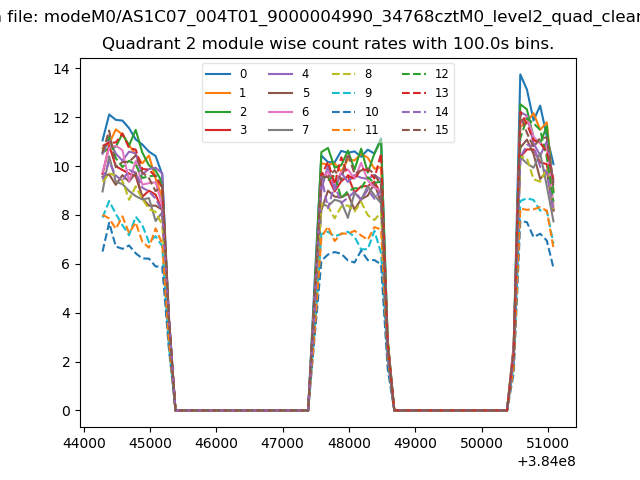
| Module-wise count rates for Quadrant B Data is divided into 100 sec bins |
 |
 |
| Module-wise count rates for Quadrant C Data is divided into 100 sec bins |
 |
 |
| Module-wise count rates for Quadrant D Data is divided into 100 sec bins |
 |
 |
| Parameter | Plot |
|---|---|
| CZT HV Monitor | 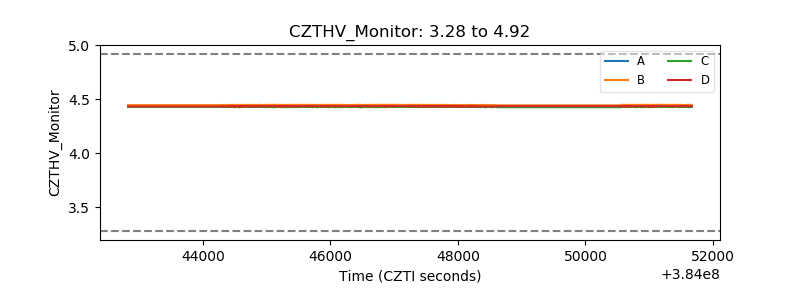 |
| D_VDD | 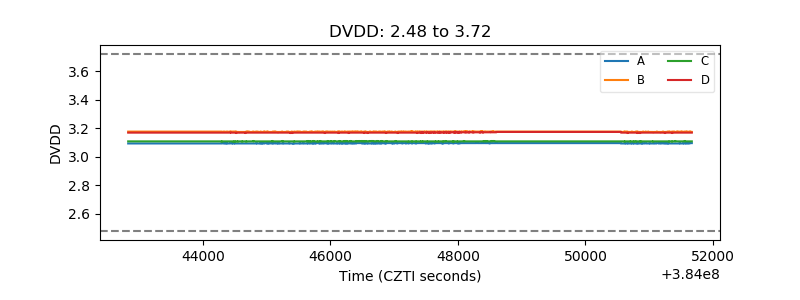 |
| Temperature 1 | 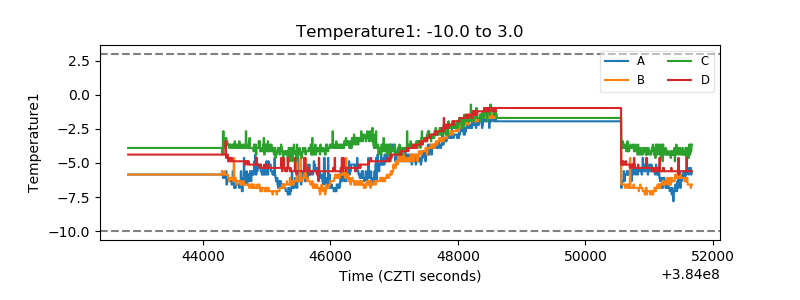 |
| Veto HV Monitor | 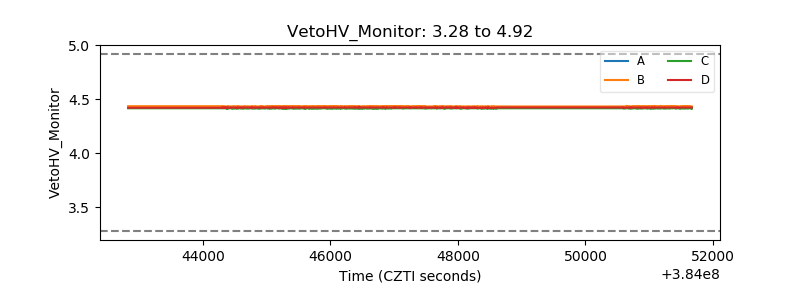 |
| Veto LLD | 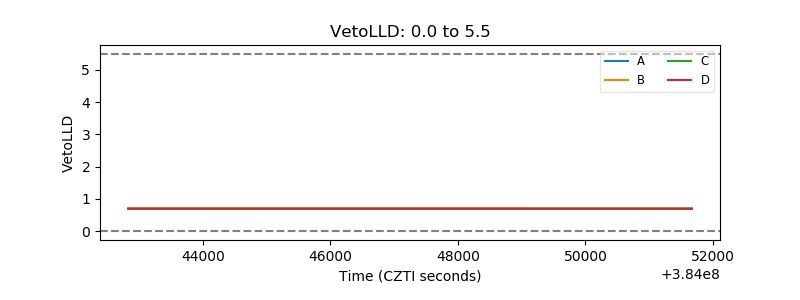 |
| Alpha Counter | 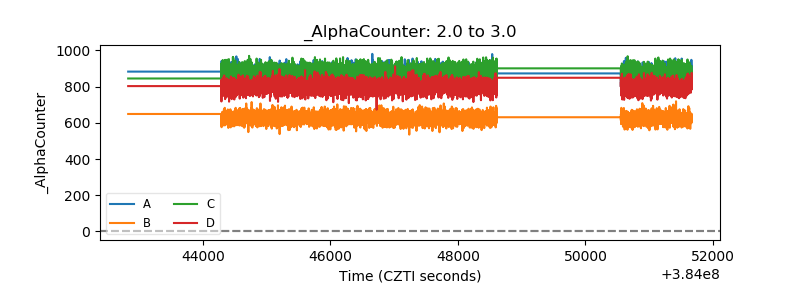 |
| _CPM_Rate | 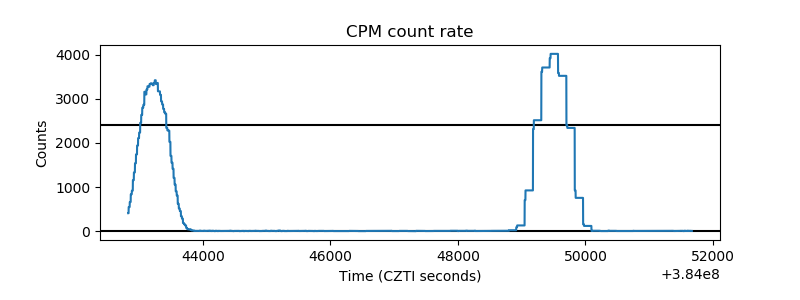 |
| CZT Counter | 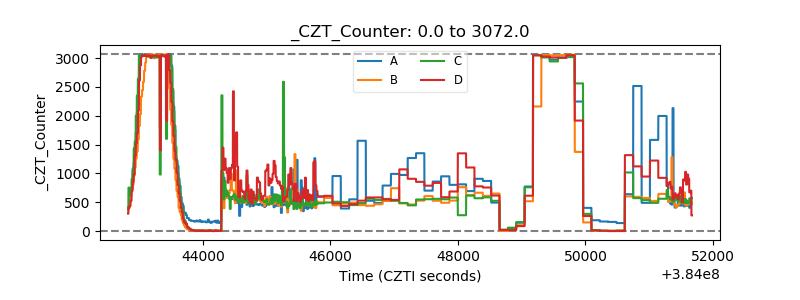 |
| +2.5 Volts monitor | 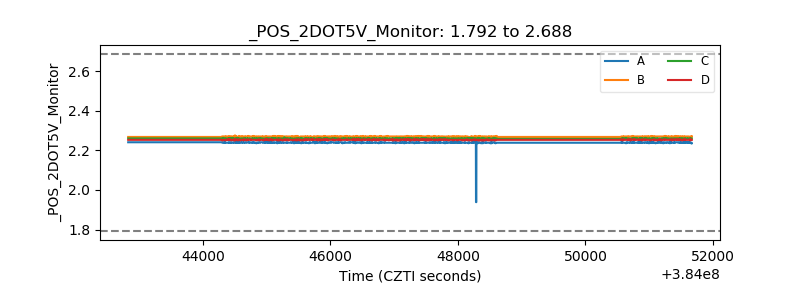 |
| +5 Volts monitor | 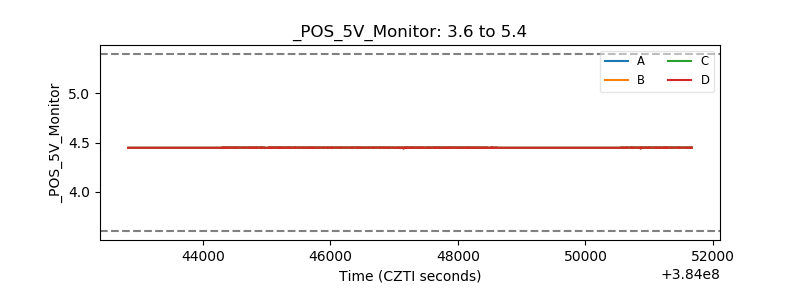 |
| _ROLL_ROT | 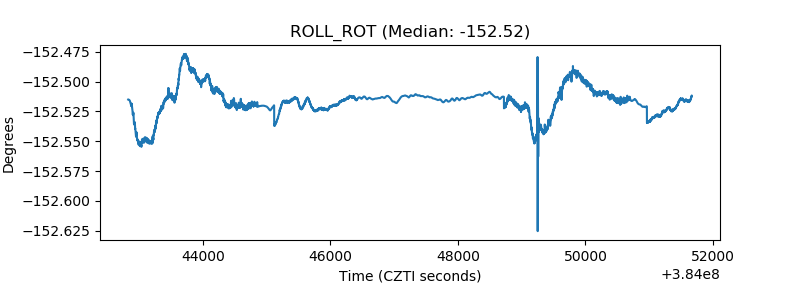 |
| _Roll_DEC | 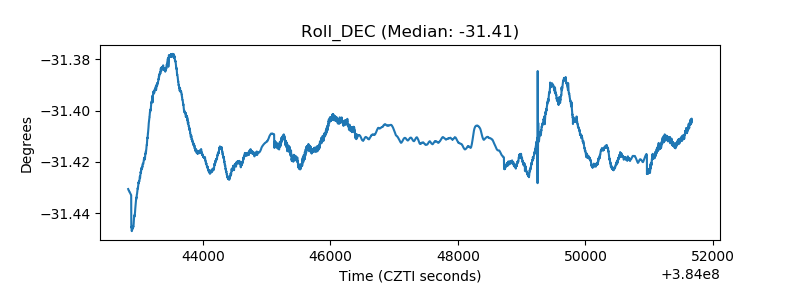 |
| _Roll_RA | 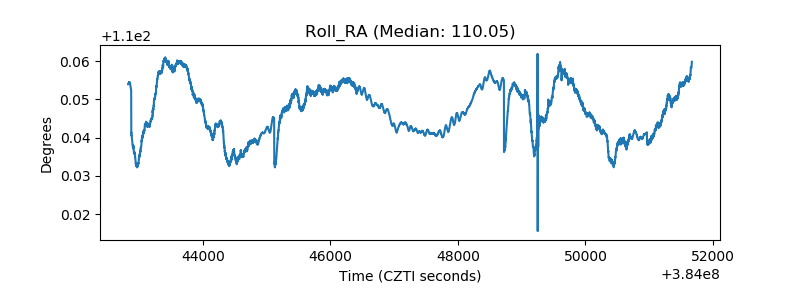 |
| Veto Counter | 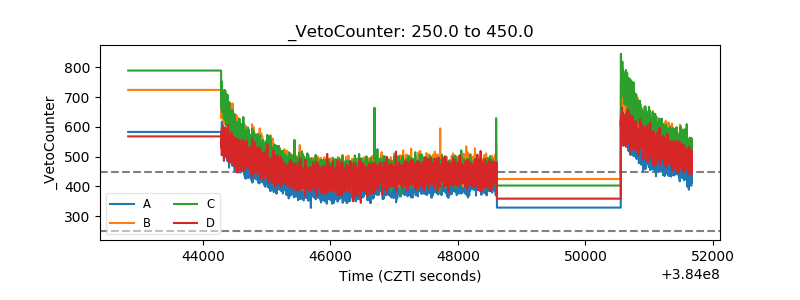 |