| Param | Original file | Final file |
|---|---|---|
| Filename | modeM0/AS1C07_004T01_9000004990_34767cztM0_level2.evt | modeM0/AS1C07_004T01_9000004990_34767cztM0_level2_quad_clean.evt |
| Size (bytes) | 483,091,200 | 69,742,080 |
| Size | 460.7 MB | 66.5 MB |
| Events in quadrant A | 2,636,020 | 437,972 |
| Events in quadrant B | 2,919,024 | 452,776 |
| Events in quadrant C | 2,884,538 | 442,056 |
| Events in quadrant D | 5,826,587 | 402,824 |
| Mode M9 | |||
|---|---|---|---|
| Quadrant | BADHDUFLAG | Total packets | Discarded packets |
| A | 0 | 31 | 0 |
| B | 0 | 31 | 0 |
| C | 0 | 31 | 0 |
| D | 0 | 32 | 0 |
| Mode M0 | |||
|---|---|---|---|
| Quadrant | BADHDUFLAG | Total packets | Discarded packets |
| A | 0 | 11226 | 3 |
| B | 0 | 11920 | 2 |
| C | 0 | 11607 | 2 |
| D | 0 | 21079 | 2 |
| Mode SS | |||
|---|---|---|---|
| Quadrant | BADHDUFLAG | Total packets | Discarded packets |
| A | 0 | 110 | 0 |
| B | 0 | 110 | 0 |
| C | 0 | 110 | 0 |
| D | 0 | 110 | 0 |
| Quadrant | Total seconds | Saturated seconds | Saturation percentage |
|---|---|---|---|
| A | 5369 | 16 | 0.298007% |
| B | 5369 | 35 | 0.651890% |
| C | 5369 | 34 | 0.633265% |
| D | 5369 | 727 | 13.540697% |
Noise dominated data is calculated using 1-second bins in cleaned event files. If a bin has >2000 counts, and if more than 50% of those come from <1% of pixels, then it is considered to be noise-dominated and hence unusable.
| Quadrant | # 1 sec bins | Bins with >0 counts | Bins with >2000 counts | High rate bins dominated by noise | Noise dominated (total time) | Noise dominated (detector-on time) | Marked lightcurve |
|---|---|---|---|---|---|---|---|
| A | 7191 | 5370 | 11 | 11 | 0.15% | 0.20% | 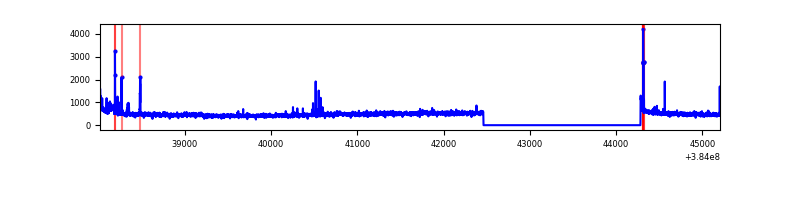 |
| B | 7191 | 5370 | 20 | 20 | 0.28% | 0.37% | 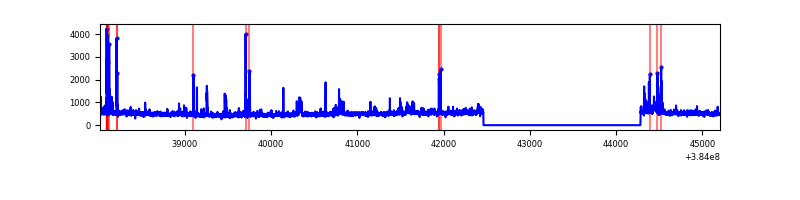 |
| C | 7191 | 5370 | 22 | 22 | 0.31% | 0.41% | 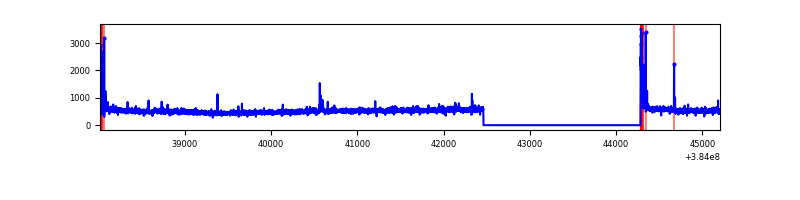 |
| D | 7191 | 5370 | 556 | 556 | 7.73% | 10.35% | 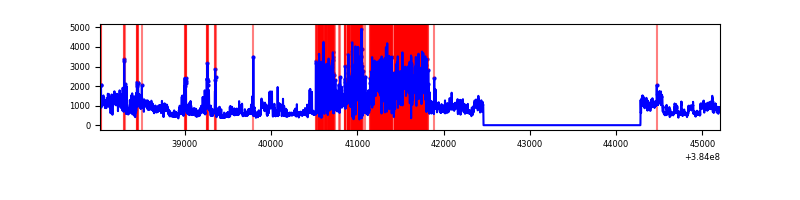 |
Top three noisy pixels from each quadrant. If the there are fewer than three noisy pixels in the level2.evt file, extra rows are filled as -1
| Pixel properties | Quadrant properties | ||||||
|---|---|---|---|---|---|---|---|
| Quadrant | DetID | PixID | Counts | Sigma | Mean | Median | Sigma |
| A | 15 | 169 | 70477 | 542.04 | 642 | 631 | 128.9 |
| A | 10 | 83 | 47909 | 366.9 | 642 | 631 | 128.9 |
| A | 15 | 223 | 16719 | 124.85 | 642 | 631 | 128.9 |
| B | 5 | 172 | 120828 | 972.06 | 647 | 629 | 123.7 |
| B | 4 | 232 | 84863 | 681.2 | 647 | 629 | 123.7 |
| B | 0 | 190 | 49428 | 394.64 | 647 | 629 | 123.7 |
| C | 15 | 214 | 228959 | 1553.44 | 633 | 640 | 147.0 |
| C | 0 | 10 | 109904 | 743.41 | 633 | 640 | 147.0 |
| C | 14 | 67 | 43052 | 288.56 | 633 | 640 | 147.0 |
| D | 2 | 250 | 1786471 | 12542.68 | 590 | 574 | 142.4 |
| D | 8 | 195 | 1477122 | 10370.06 | 590 | 574 | 142.4 |
| D | 12 | 227 | 172760 | 1209.29 | 590 | 574 | 142.4 |
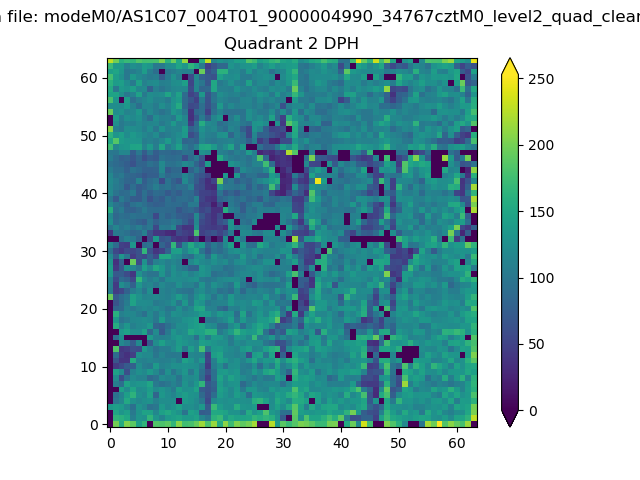
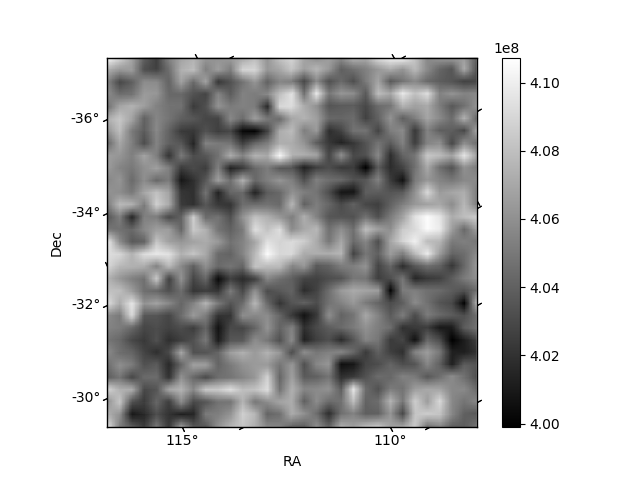
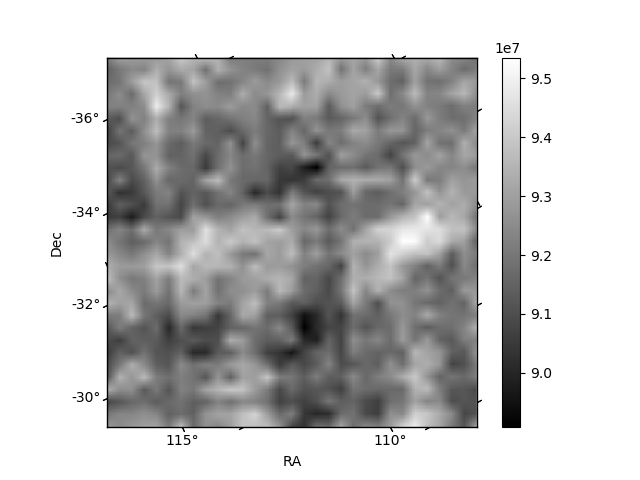
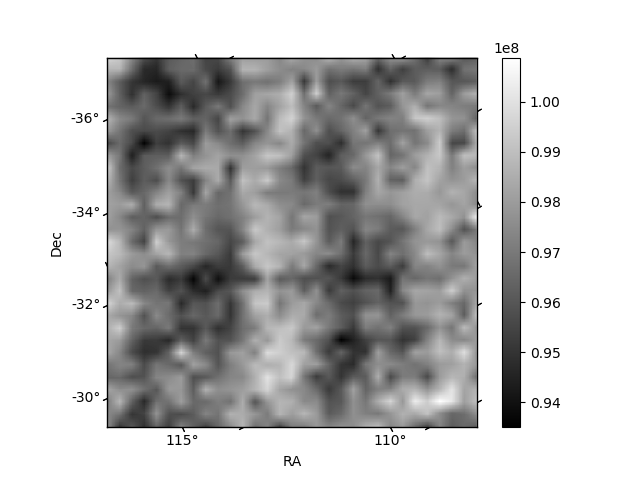
Histogram calculated using DETX and DETY for each event in the final _common_clean file
| Quadrant A | 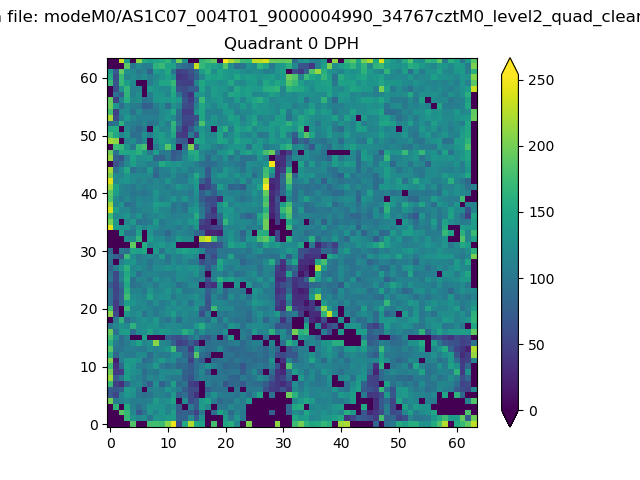 |
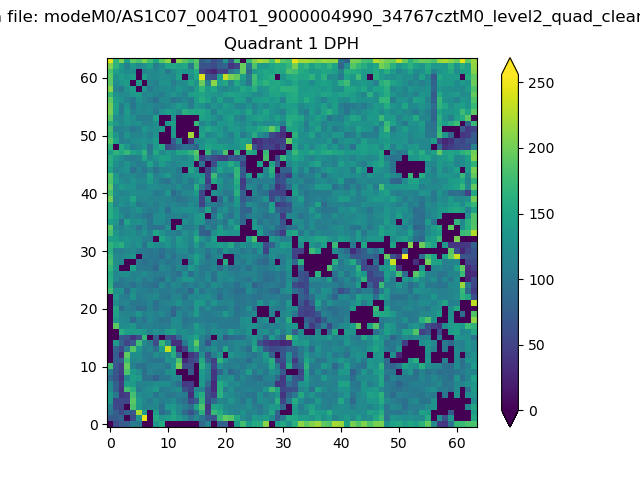 |
Quadrant B |
|---|---|---|---|
| Quadrant D | 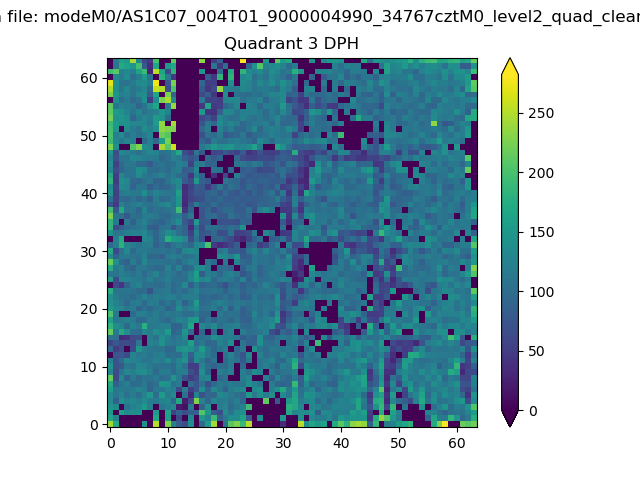 |
 |
Quadrant C |
| Plot type | Count rate plots | Images |
|---|---|---|
| Comparison with Poisson distribution Blue bars denote a histogram of data divided into 1 sec bins. Red curve is a Poisson curve with rate = median count rate of data. |
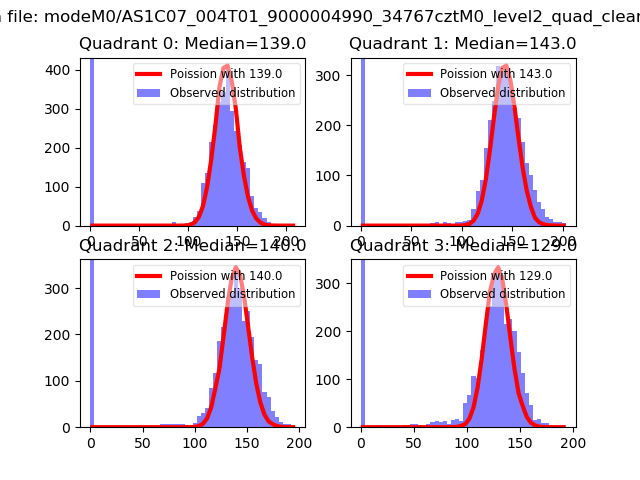 |
 |
| Quadrant-wise count rates Data is divided into 100 sec bins |
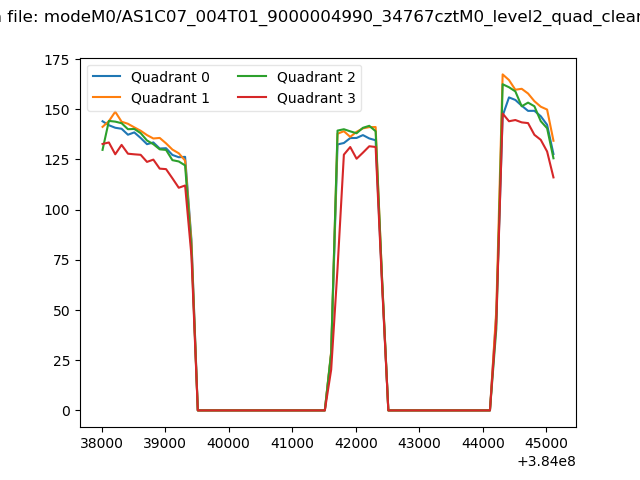 |
|
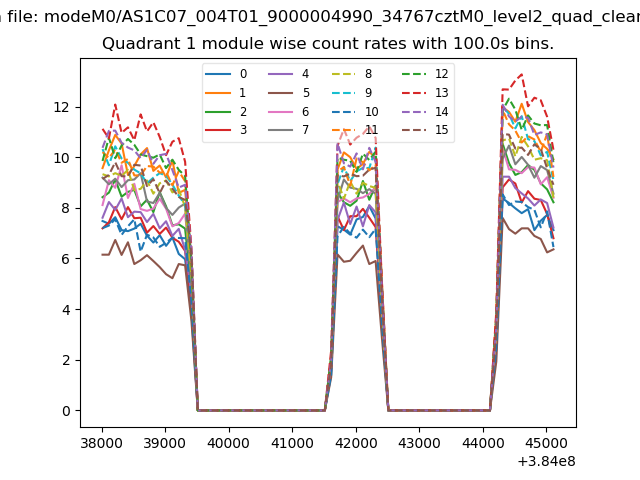
| Module-wise count rates for Quadrant A Data is divided into 100 sec bins |
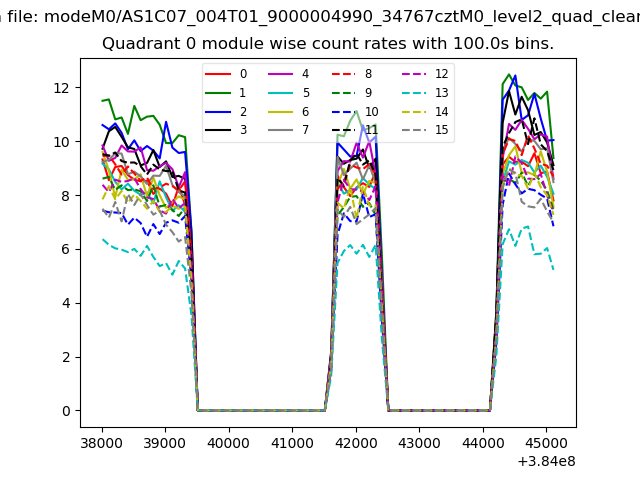 |
 |
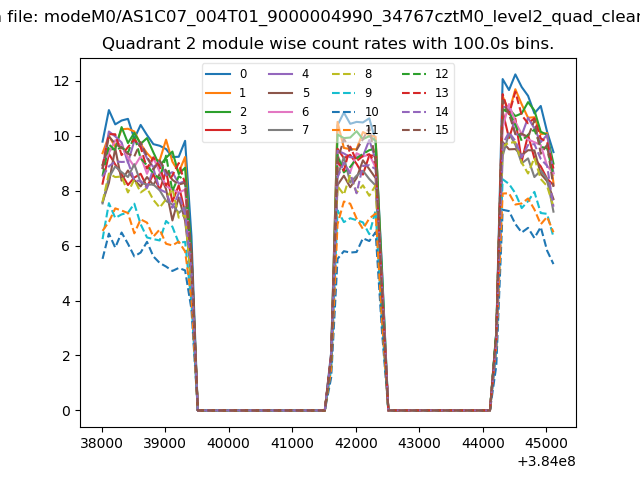
| Module-wise count rates for Quadrant B Data is divided into 100 sec bins |
 |
 |
| Module-wise count rates for Quadrant C Data is divided into 100 sec bins |
 |
 |
| Module-wise count rates for Quadrant D Data is divided into 100 sec bins |
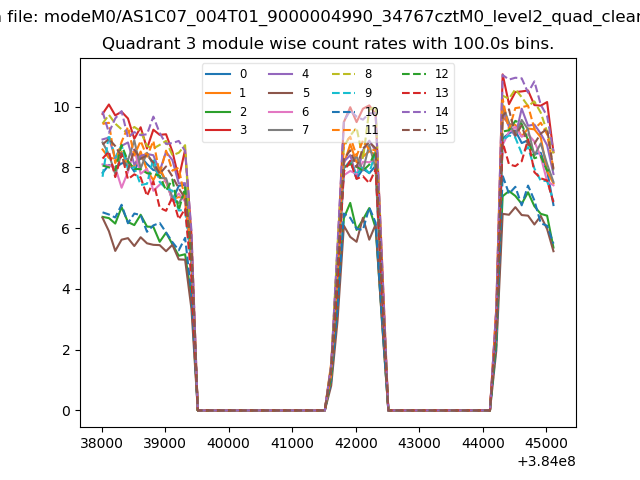 |
 |
| Parameter | Plot |
|---|---|
| CZT HV Monitor | 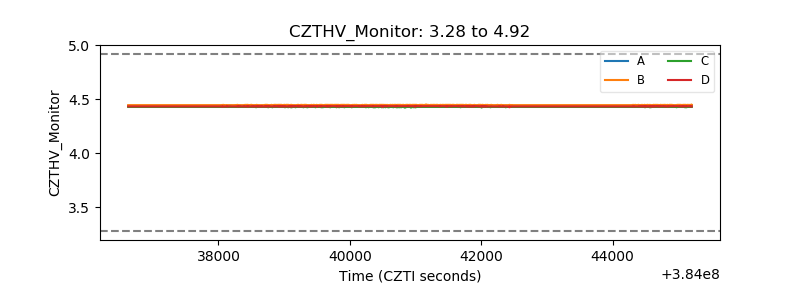 |
| D_VDD | 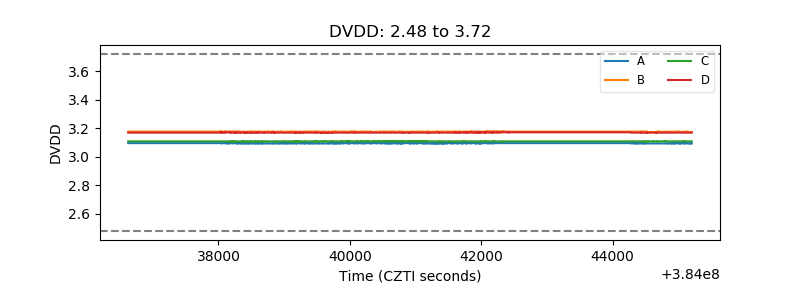 |
| Temperature 1 |  |
| Veto HV Monitor | 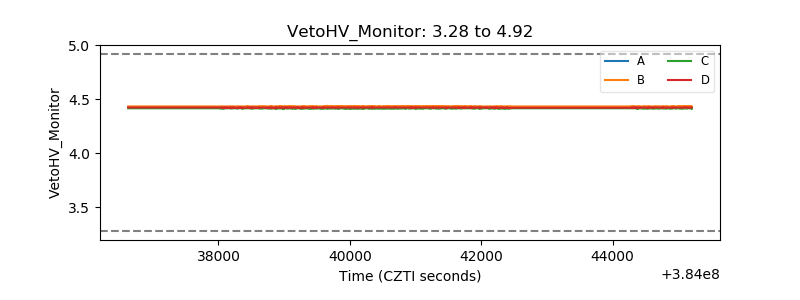 |
| Veto LLD | 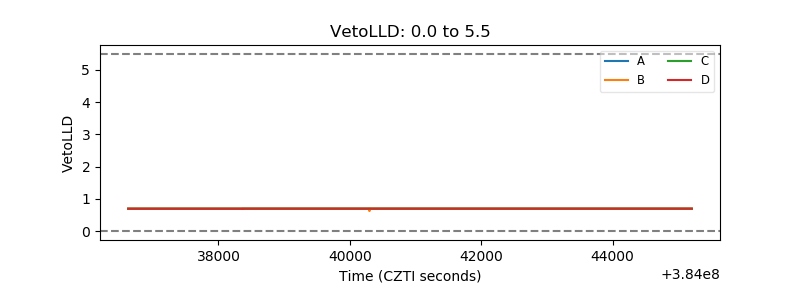 |
| Alpha Counter | 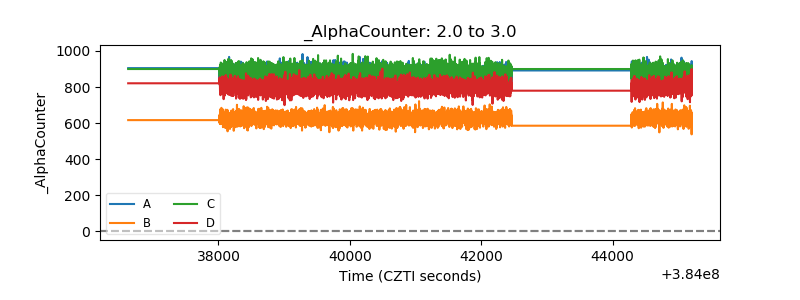 |
| _CPM_Rate | 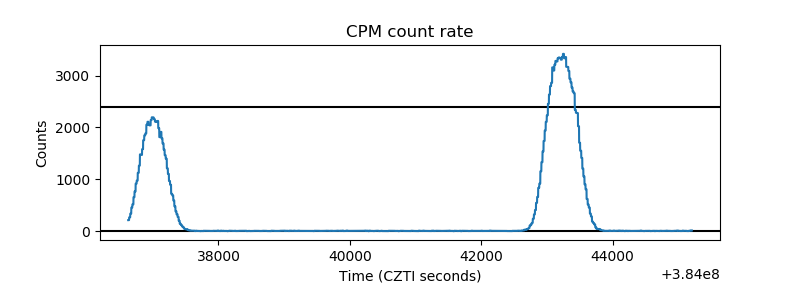 |
| CZT Counter | 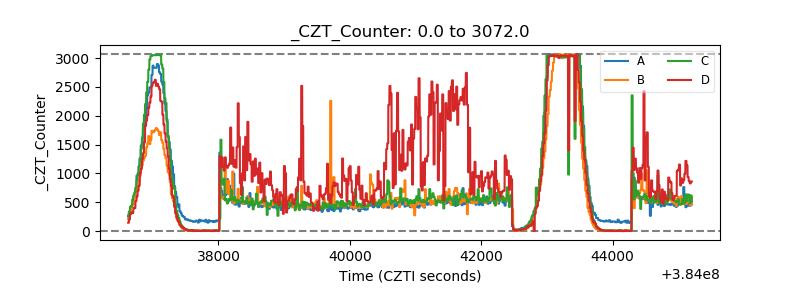 |
| +2.5 Volts monitor | 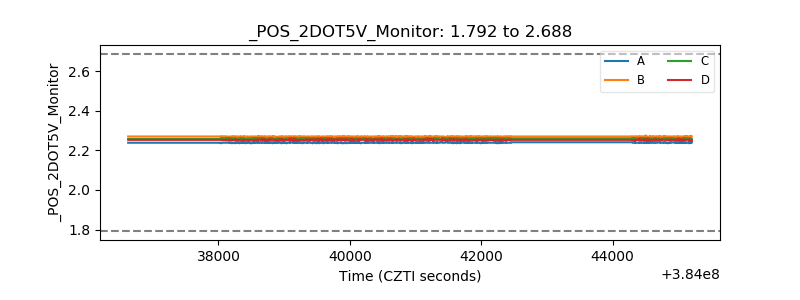 |
| +5 Volts monitor | 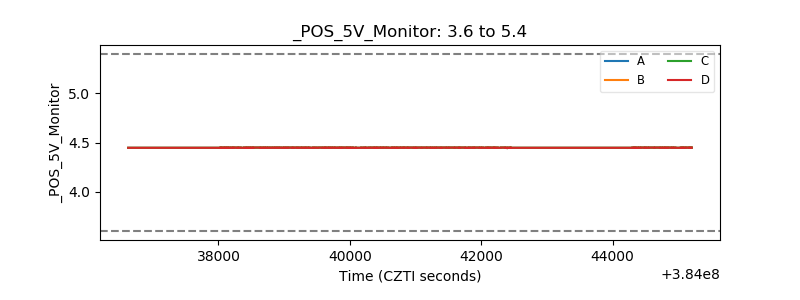 |
| _ROLL_ROT | 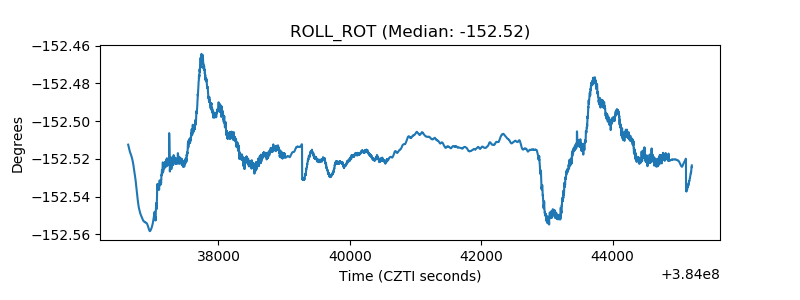 |
| _Roll_DEC | 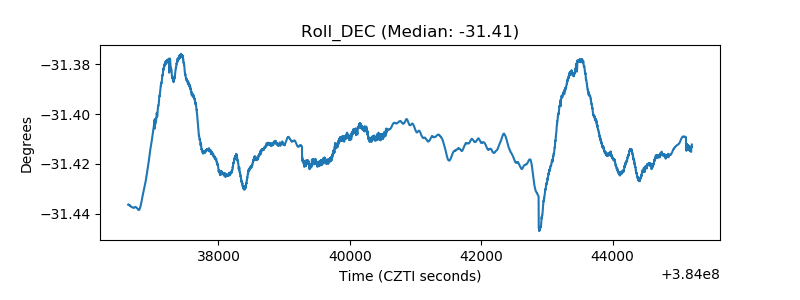 |
| _Roll_RA | 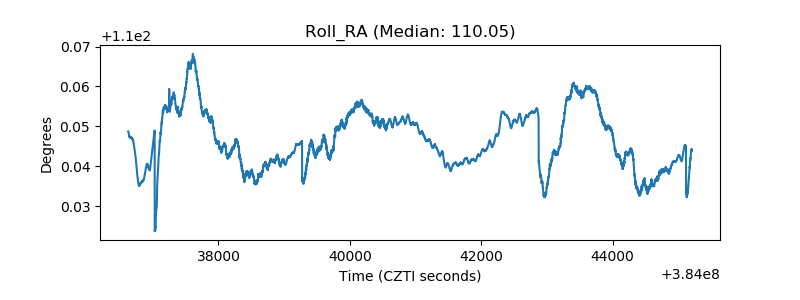 |
| Veto Counter | 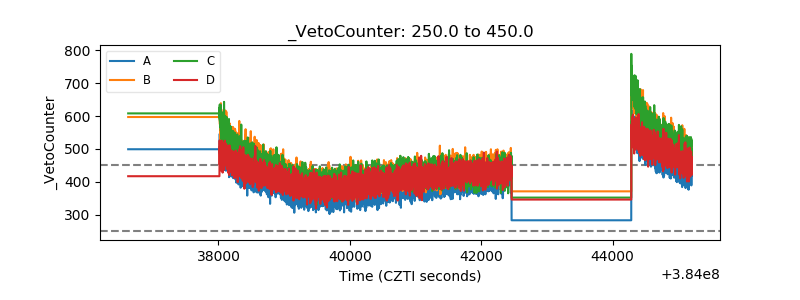 |