| Param | Original file | Final file |
|---|---|---|
| Filename | modeM0/AS1C07_004T01_9000004990_34765cztM0_level2.evt | modeM0/AS1C07_004T01_9000004990_34765cztM0_level2_quad_clean.evt |
| Size (bytes) | 449,835,840 | 67,749,120 |
| Size | 429.0 MB | 64.6 MB |
| Events in quadrant A | 2,573,644 | 422,784 |
| Events in quadrant B | 3,037,623 | 430,883 |
| Events in quadrant C | 2,816,367 | 424,826 |
| Events in quadrant D | 4,825,174 | 390,574 |
| Mode M9 | |||
|---|---|---|---|
| Quadrant | BADHDUFLAG | Total packets | Discarded packets |
| A | 0 | 32 | 0 |
| B | 0 | 32 | 0 |
| C | 0 | 32 | 0 |
| D | 0 | 32 | 0 |
| Mode M0 | |||
|---|---|---|---|
| Quadrant | BADHDUFLAG | Total packets | Discarded packets |
| A | 0 | 11289 | 3 |
| B | 0 | 12449 | 2 |
| C | 0 | 11562 | 2 |
| D | 0 | 18056 | 2 |
| Mode SS | |||
|---|---|---|---|
| Quadrant | BADHDUFLAG | Total packets | Discarded packets |
| A | 0 | 114 | 0 |
| B | 0 | 114 | 0 |
| C | 0 | 114 | 0 |
| D | 0 | 114 | 0 |
| Quadrant | Total seconds | Saturated seconds | Saturation percentage |
|---|---|---|---|
| A | 5459 | 8 | 0.146547% |
| B | 5459 | 85 | 1.557062% |
| C | 5459 | 24 | 0.439641% |
| D | 5459 | 92 | 1.685290% |
Noise dominated data is calculated using 1-second bins in cleaned event files. If a bin has >2000 counts, and if more than 50% of those come from <1% of pixels, then it is considered to be noise-dominated and hence unusable.
| Quadrant | # 1 sec bins | Bins with >0 counts | Bins with >2000 counts | High rate bins dominated by noise | Noise dominated (total time) | Noise dominated (detector-on time) | Marked lightcurve |
|---|---|---|---|---|---|---|---|
| A | 8714 | 5461 | 4 | 4 | 0.05% | 0.07% | 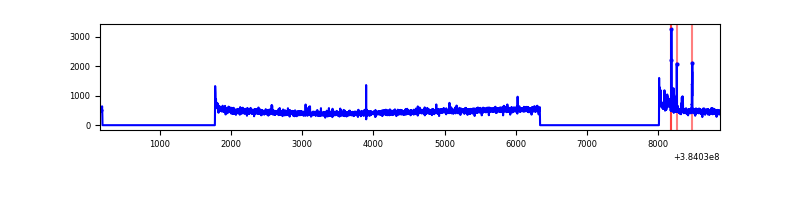 |
| B | 8714 | 5461 | 43 | 43 | 0.49% | 0.79% | 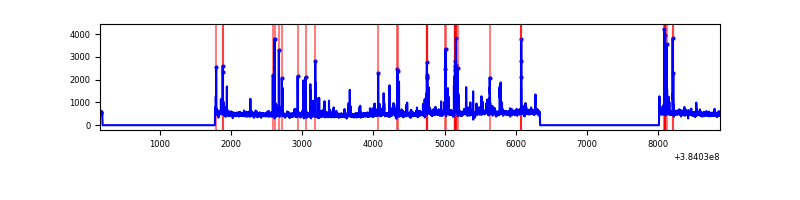 |
| C | 8714 | 5461 | 17 | 17 | 0.20% | 0.31% | 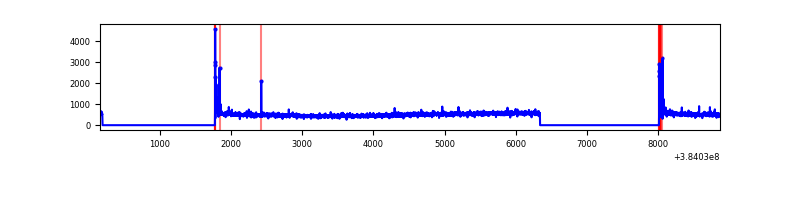 |
| D | 8714 | 5461 | 85 | 85 | 0.98% | 1.56% | 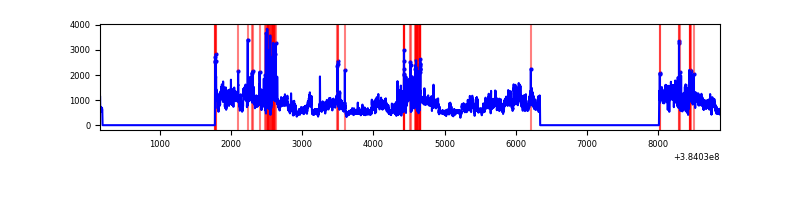 |
Top three noisy pixels from each quadrant. If the there are fewer than three noisy pixels in the level2.evt file, extra rows are filled as -1
| Pixel properties | Quadrant properties | ||||||
|---|---|---|---|---|---|---|---|
| Quadrant | DetID | PixID | Counts | Sigma | Mean | Median | Sigma |
| A | 10 | 83 | 50589 | 388.2 | 638 | 625 | 128.7 |
| A | 15 | 169 | 45477 | 348.48 | 638 | 625 | 128.7 |
| A | 15 | 223 | 10128 | 73.83 | 638 | 625 | 128.7 |
| B | 5 | 172 | 255651 | 2081.62 | 637 | 620 | 122.5 |
| B | 5 | 255 | 84885 | 687.79 | 637 | 620 | 122.5 |
| B | 0 | 190 | 81983 | 664.1 | 637 | 620 | 122.5 |
| C | 15 | 214 | 233988 | 1587.84 | 624 | 630 | 147.0 |
| C | 0 | 10 | 90028 | 608.29 | 624 | 630 | 147.0 |
| C | 14 | 67 | 46052 | 309.07 | 624 | 630 | 147.0 |
| D | 8 | 195 | 1611449 | 10569.07 | 616 | 597 | 152.4 |
| D | 12 | 227 | 344999 | 2259.68 | 616 | 597 | 152.4 |
| D | 7 | 223 | 216495 | 1416.54 | 616 | 597 | 152.4 |
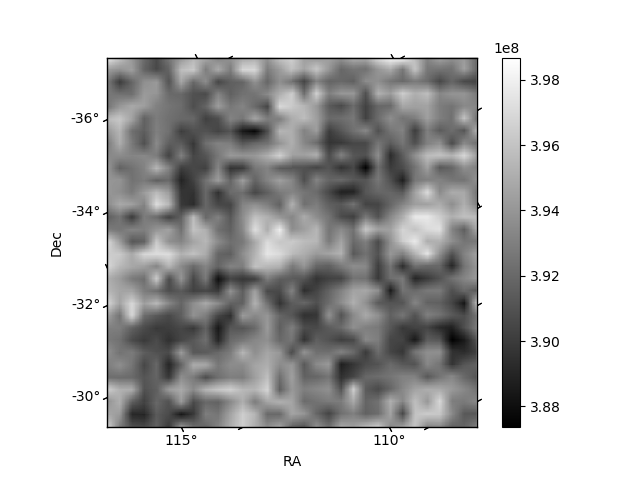
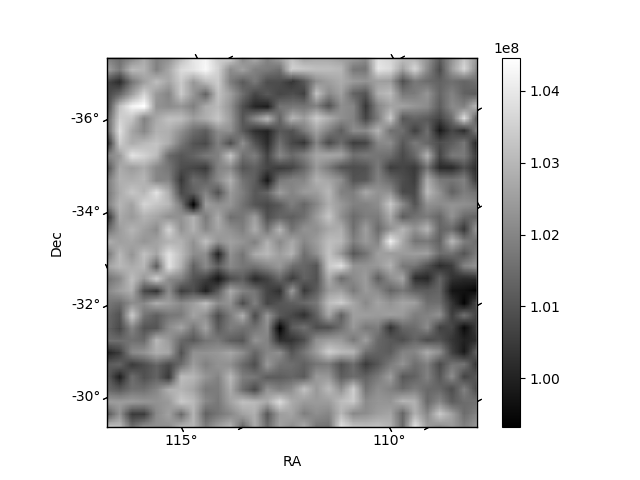
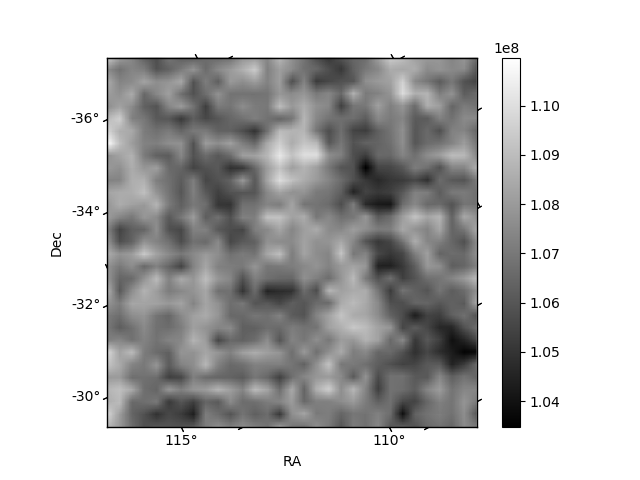
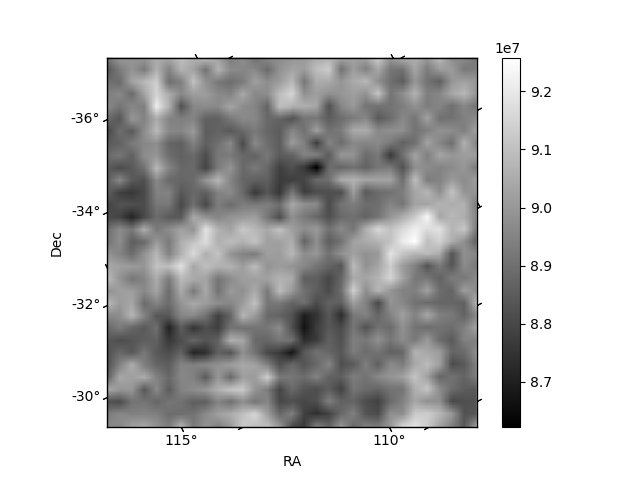
Histogram calculated using DETX and DETY for each event in the final _common_clean file
| Quadrant A | 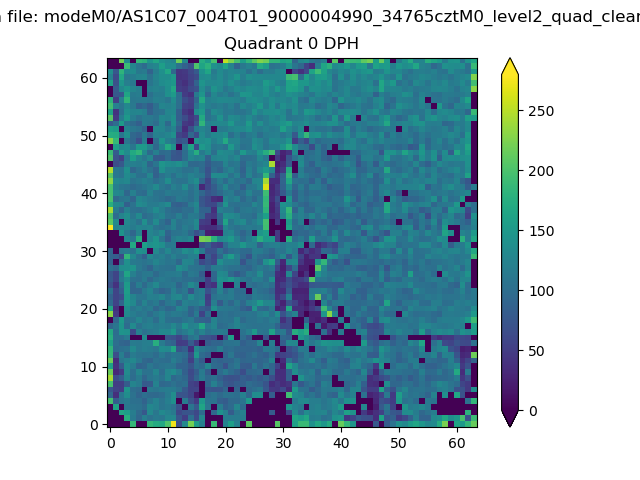 |
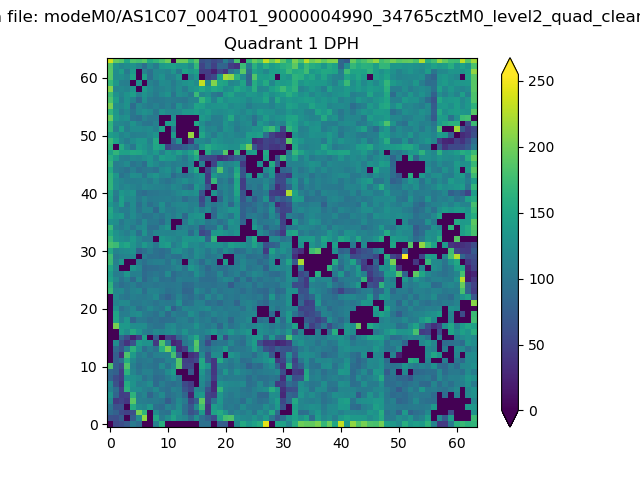 |
Quadrant B |
|---|---|---|---|
| Quadrant D | 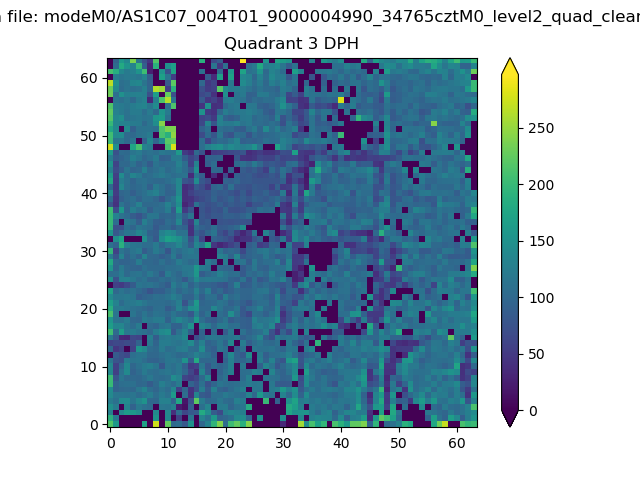 |
 |
Quadrant C |
| Plot type | Count rate plots | Images |
|---|---|---|
| Comparison with Poisson distribution Blue bars denote a histogram of data divided into 1 sec bins. Red curve is a Poisson curve with rate = median count rate of data. |
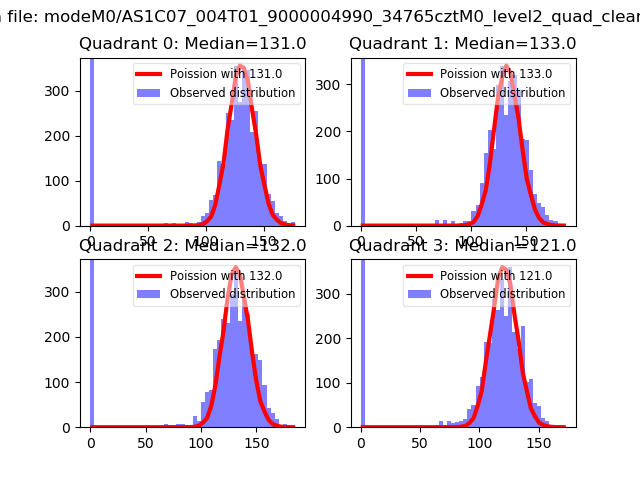 |
 |
| Quadrant-wise count rates Data is divided into 100 sec bins |
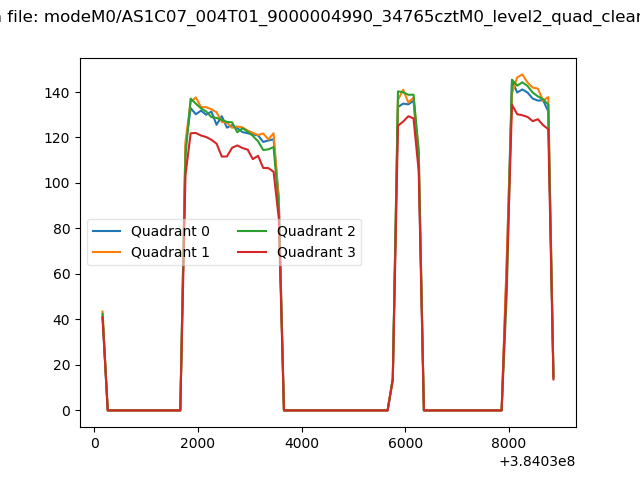 |
|
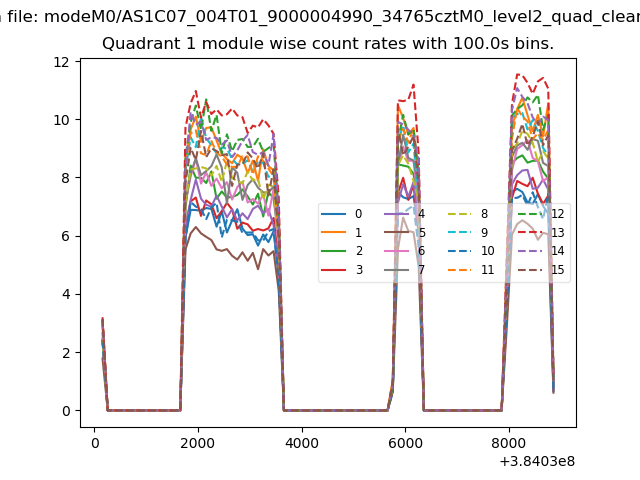
| Module-wise count rates for Quadrant A Data is divided into 100 sec bins |
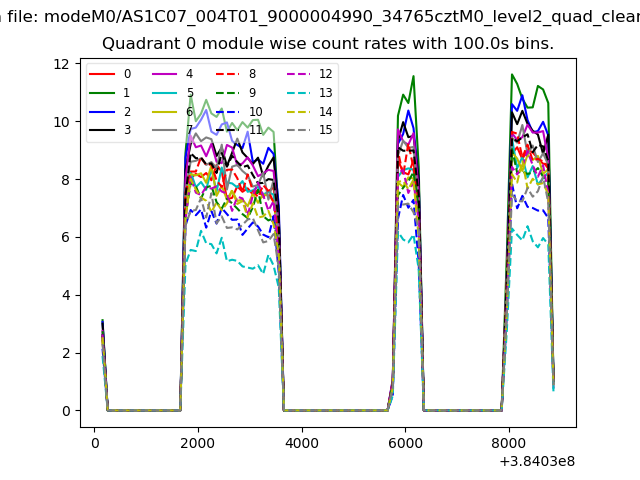 |
 |
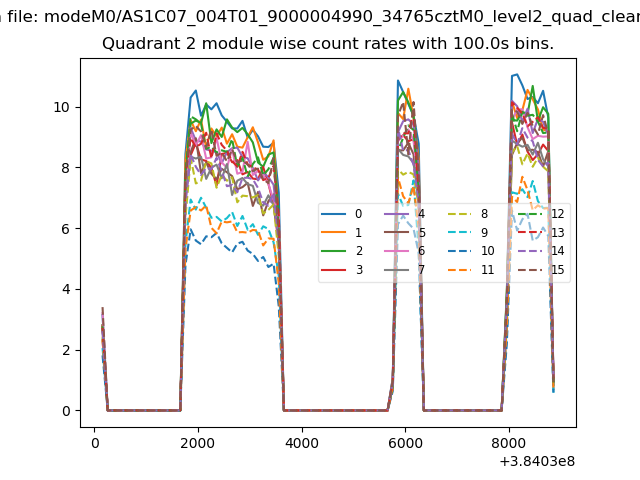
| Module-wise count rates for Quadrant B Data is divided into 100 sec bins |
 |
 |
| Module-wise count rates for Quadrant C Data is divided into 100 sec bins |
 |
 |
| Module-wise count rates for Quadrant D Data is divided into 100 sec bins |
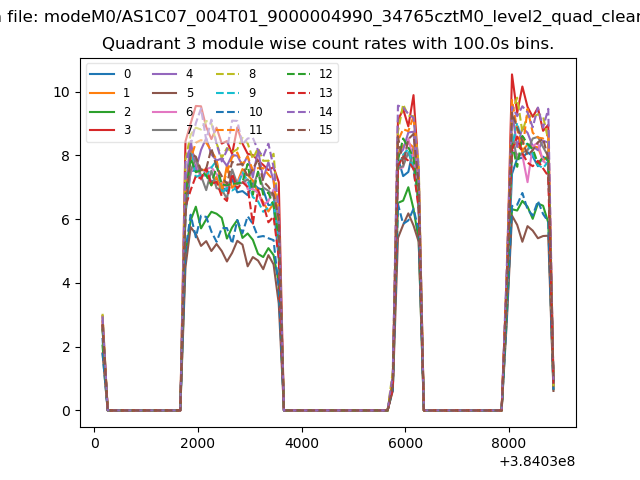 |
 |
| Parameter | Plot |
|---|---|
| CZT HV Monitor | 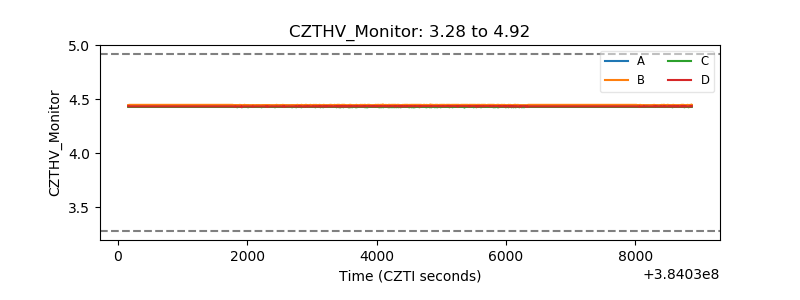 |
| D_VDD | 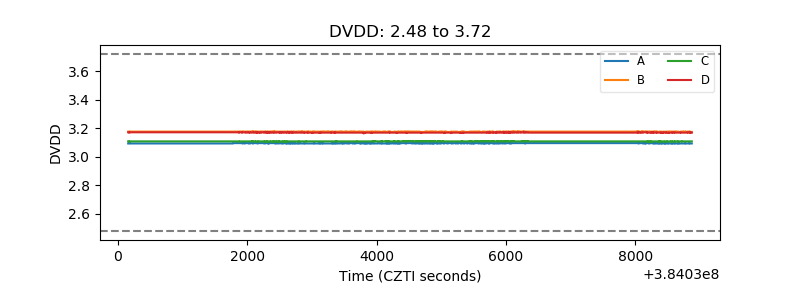 |
| Temperature 1 | 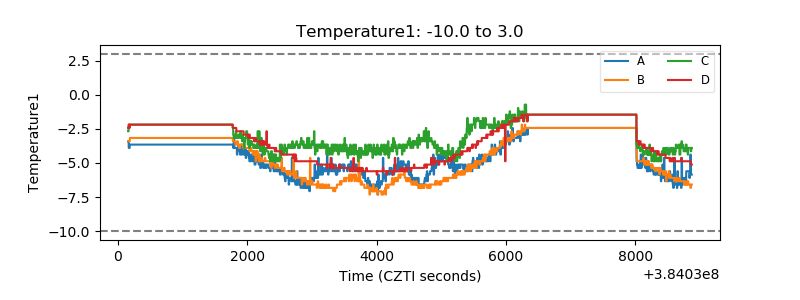 |
| Veto HV Monitor | 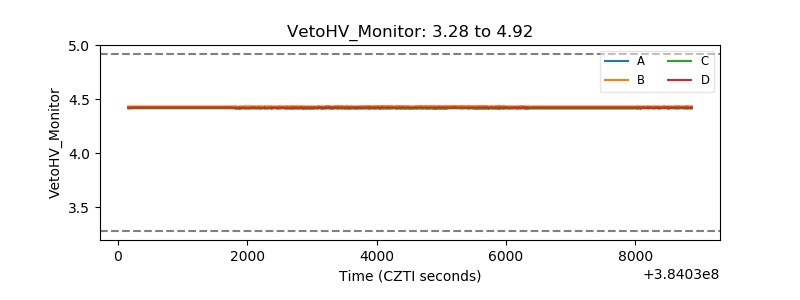 |
| Veto LLD | 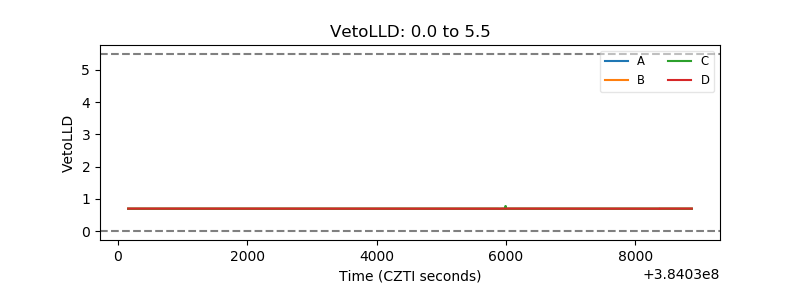 |
| Alpha Counter | 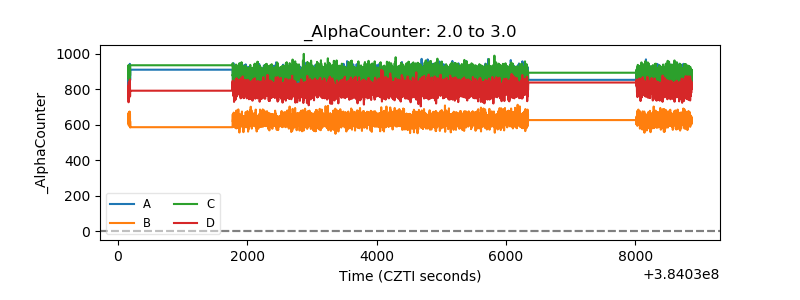 |
| _CPM_Rate | 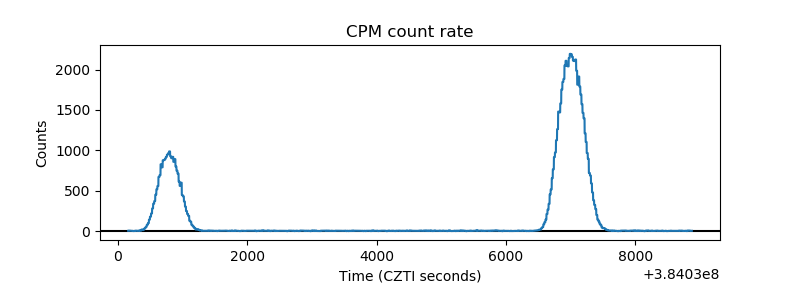 |
| CZT Counter | 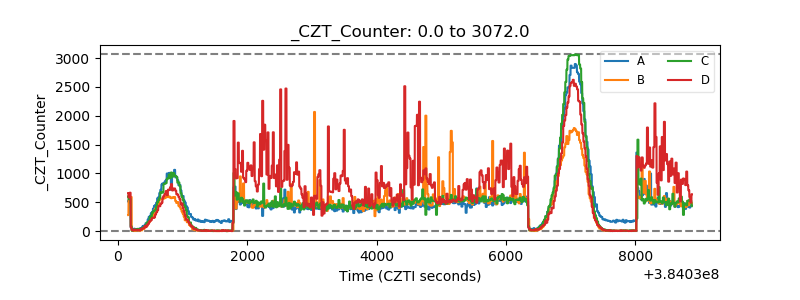 |
| +2.5 Volts monitor | 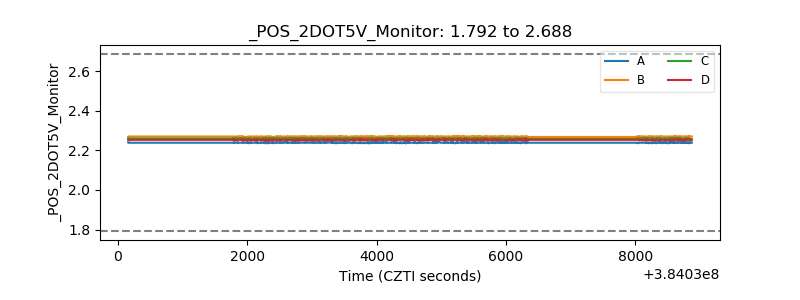 |
| +5 Volts monitor | 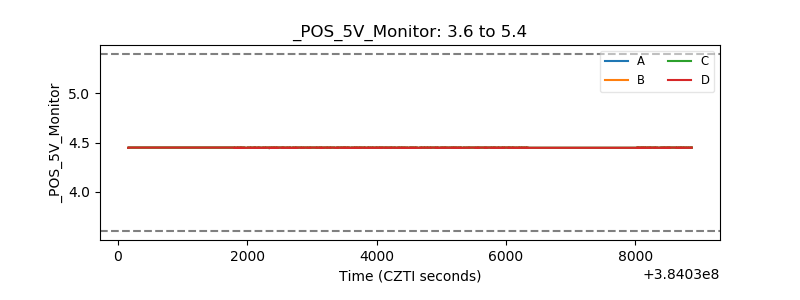 |
| _ROLL_ROT | 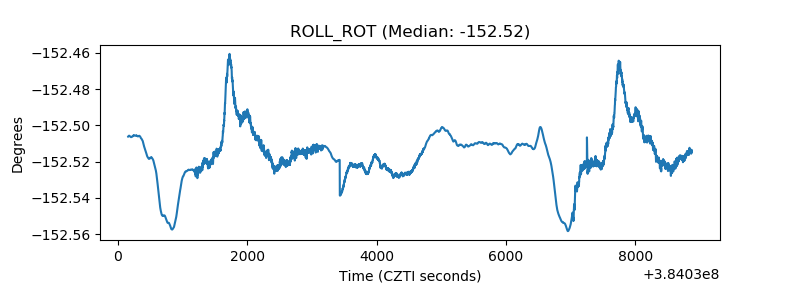 |
| _Roll_DEC | 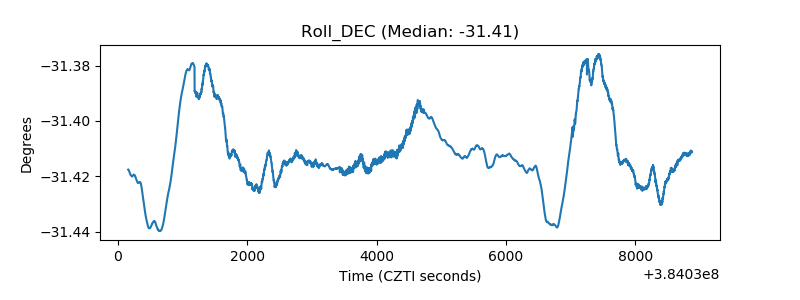 |
| _Roll_RA | 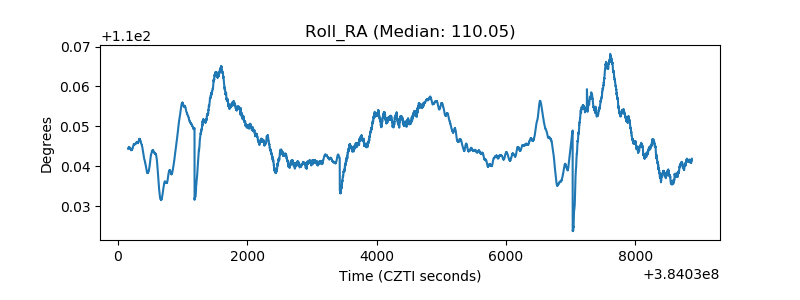 |
| Veto Counter | 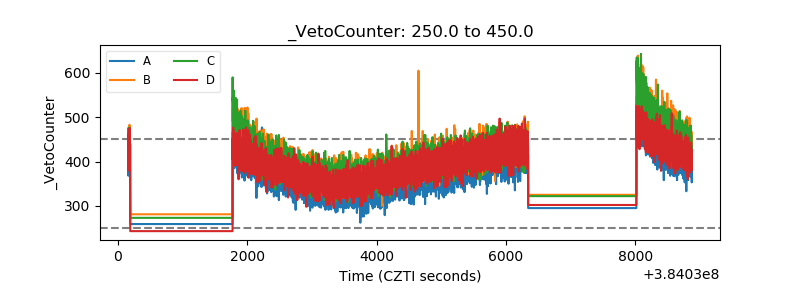 |