| Param | Original file | Final file |
|---|---|---|
| Filename | modeM0/AS1C07_004T01_9000004990_34764cztM0_level2.evt | modeM0/AS1C07_004T01_9000004990_34764cztM0_level2_quad_clean.evt |
| Size (bytes) | 973,503,360 | 171,529,920 |
| Size | 928.4 MB | 163.6 MB |
| Events in quadrant A | 5,542,233 | 1,104,794 |
| Events in quadrant B | 6,385,234 | 1,124,083 |
| Events in quadrant C | 6,107,487 | 1,117,151 |
| Events in quadrant D | 10,634,070 | 1,015,794 |
| Mode M9 | |||
|---|---|---|---|
| Quadrant | BADHDUFLAG | Total packets | Discarded packets |
| A | 0 | 36 | 0 |
| B | 0 | 36 | 0 |
| C | 0 | 36 | 0 |
| D | 0 | 36 | 0 |
| Mode M0 | |||
|---|---|---|---|
| Quadrant | BADHDUFLAG | Total packets | Discarded packets |
| A | 0 | 24533 | 5 |
| B | 0 | 26573 | 3 |
| C | 0 | 25373 | 3 |
| D | 0 | 39955 | 3 |
| Mode SS | |||
|---|---|---|---|
| Quadrant | BADHDUFLAG | Total packets | Discarded packets |
| A | 0 | 248 | 0 |
| B | 0 | 248 | 0 |
| C | 0 | 248 | 0 |
| D | 0 | 248 | 0 |
| Quadrant | Total seconds | Saturated seconds | Saturation percentage |
|---|---|---|---|
| A | 12039 | 17 | 0.141208% |
| B | 12039 | 73 | 0.606363% |
| C | 12039 | 46 | 0.382092% |
| D | 12039 | 615 | 5.108398% |
Noise dominated data is calculated using 1-second bins in cleaned event files. If a bin has >2000 counts, and if more than 50% of those come from <1% of pixels, then it is considered to be noise-dominated and hence unusable.
| Quadrant | # 1 sec bins | Bins with >0 counts | Bins with >2000 counts | High rate bins dominated by noise | Noise dominated (total time) | Noise dominated (detector-on time) | Marked lightcurve |
|---|---|---|---|---|---|---|---|
| A | 31607 | 12042 | 4 | 4 | 0.01% | 0.03% | 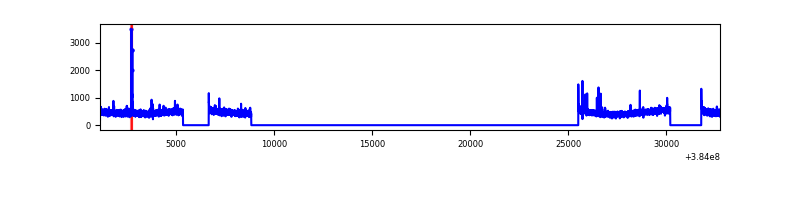 |
| B | 31607 | 12042 | 44 | 44 | 0.14% | 0.37% | 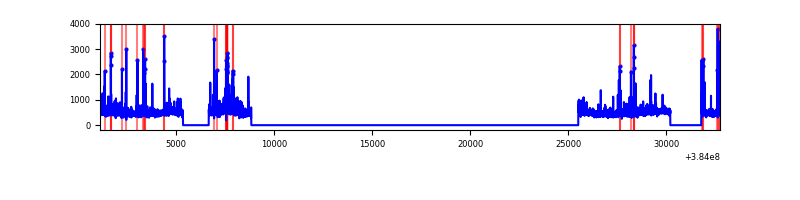 |
| C | 31607 | 12042 | 28 | 28 | 0.09% | 0.23% | 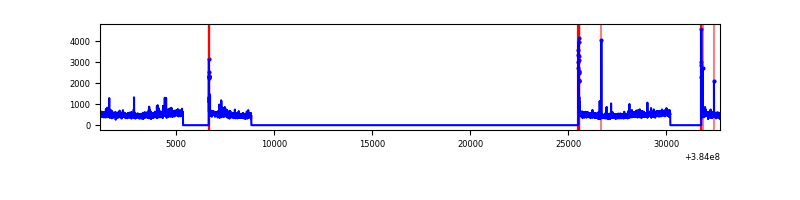 |
| D | 31607 | 12042 | 561 | 561 | 1.77% | 4.66% | 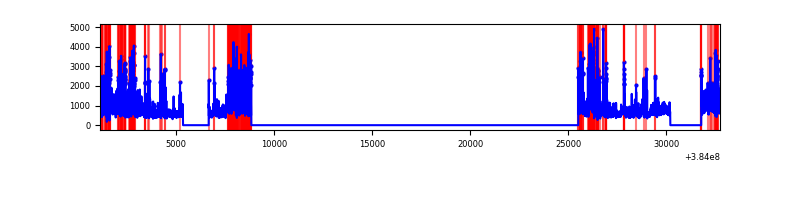 |
Top three noisy pixels from each quadrant. If the there are fewer than three noisy pixels in the level2.evt file, extra rows are filled as -1
| Pixel properties | Quadrant properties | ||||||
|---|---|---|---|---|---|---|---|
| Quadrant | DetID | PixID | Counts | Sigma | Mean | Median | Sigma |
| A | 10 | 83 | 86969 | 308.38 | 1389 | 1361 | 277.6 |
| A | 13 | 6 | 29153 | 100.11 | 1389 | 1361 | 277.6 |
| A | 9 | 143 | 24066 | 81.79 | 1389 | 1361 | 277.6 |
| B | 0 | 190 | 342085 | 1286.58 | 1383 | 1349 | 264.8 |
| B | 5 | 255 | 245184 | 920.69 | 1383 | 1349 | 264.8 |
| B | 0 | 189 | 96370 | 358.79 | 1383 | 1349 | 264.8 |
| C | 15 | 214 | 507884 | 1615.51 | 1348 | 1361 | 313.5 |
| C | 14 | 67 | 165804 | 524.48 | 1348 | 1361 | 313.5 |
| C | 0 | 10 | 146176 | 461.87 | 1348 | 1361 | 313.5 |
| D | 8 | 195 | 2312354 | 7165.04 | 1321 | 1288 | 322.5 |
| D | 12 | 227 | 1007711 | 3120.23 | 1321 | 1288 | 322.5 |
| D | 13 | 249 | 635464 | 1966.15 | 1321 | 1288 | 322.5 |
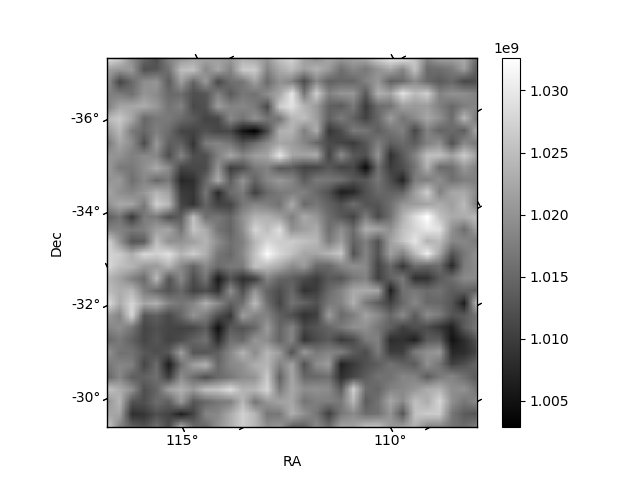
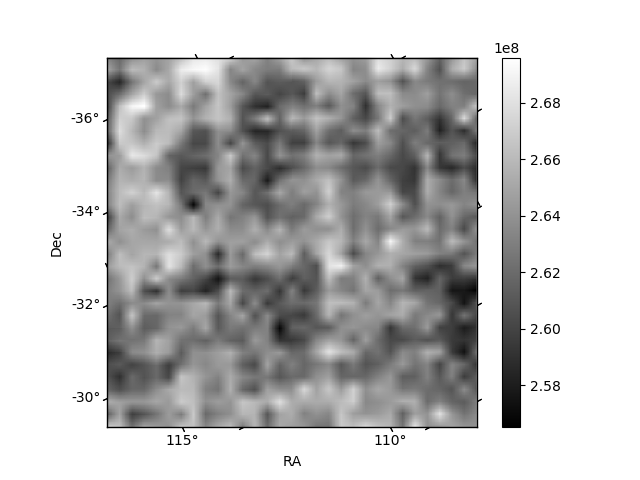
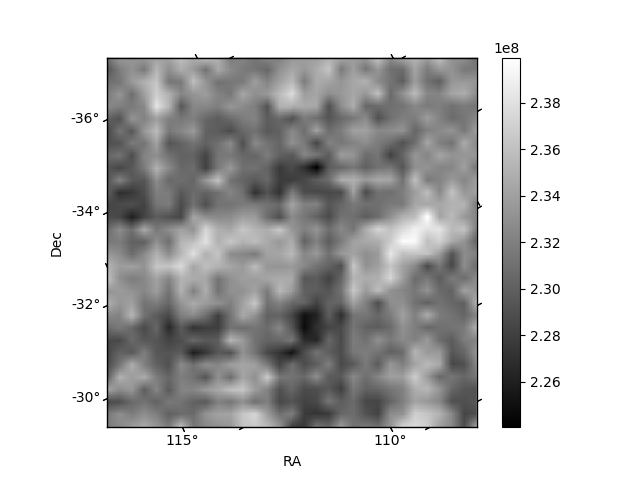
Histogram calculated using DETX and DETY for each event in the final _common_clean file
| Quadrant A | 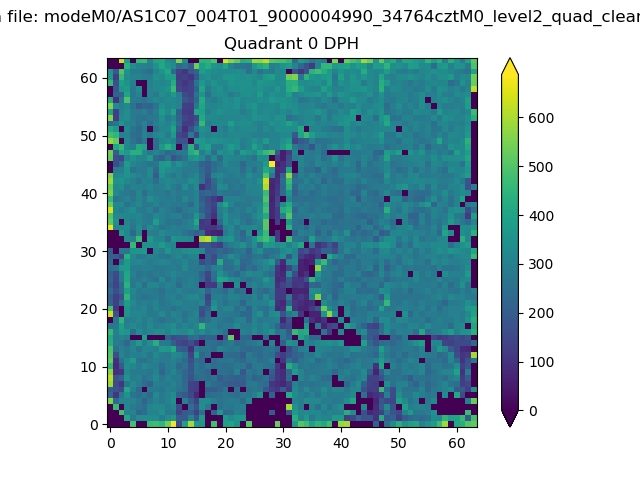 |
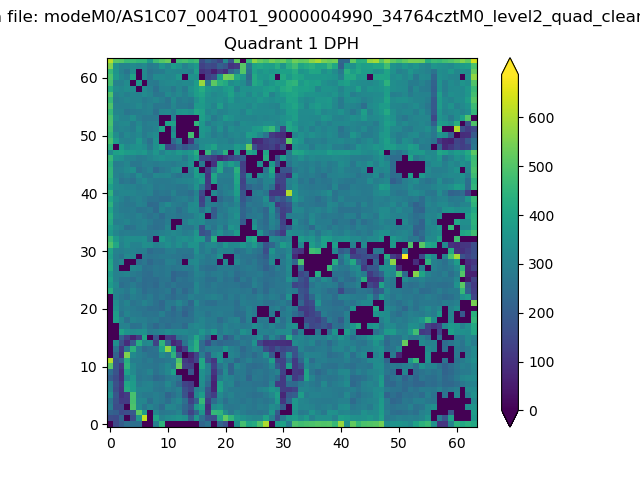 |
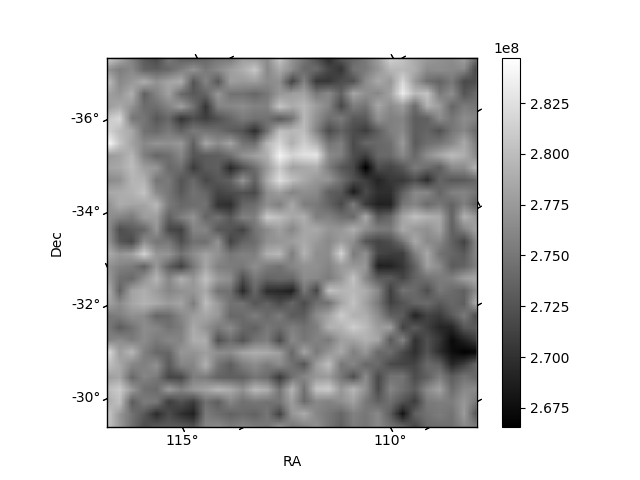
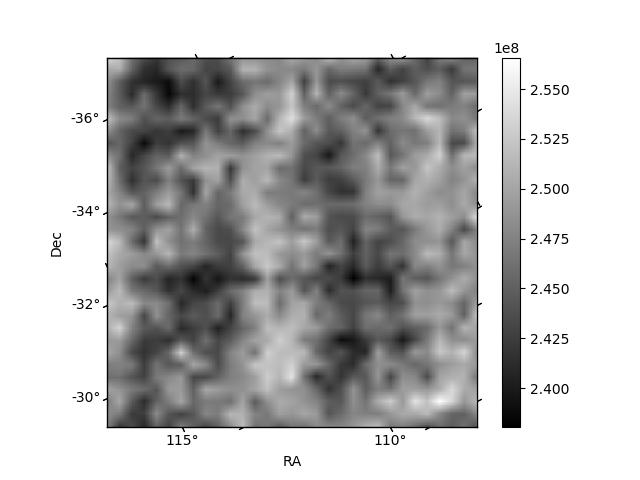
Quadrant B |
|---|---|---|---|
| Quadrant D | 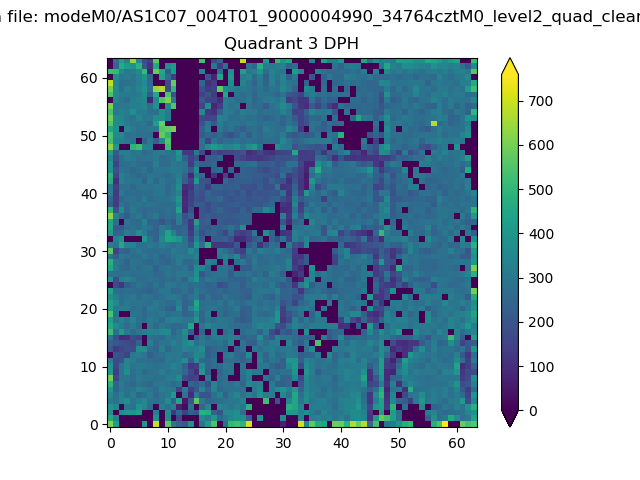 |
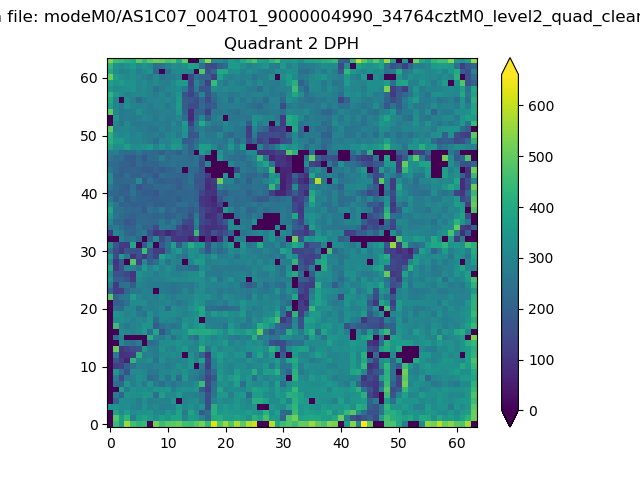 |
Quadrant C |
| Plot type | Count rate plots | Images |
|---|---|---|
| Comparison with Poisson distribution Blue bars denote a histogram of data divided into 1 sec bins. Red curve is a Poisson curve with rate = median count rate of data. |
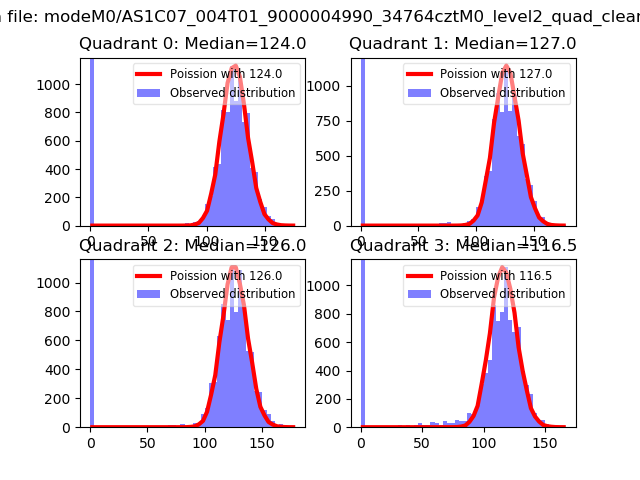 |
 |
| Quadrant-wise count rates Data is divided into 100 sec bins |
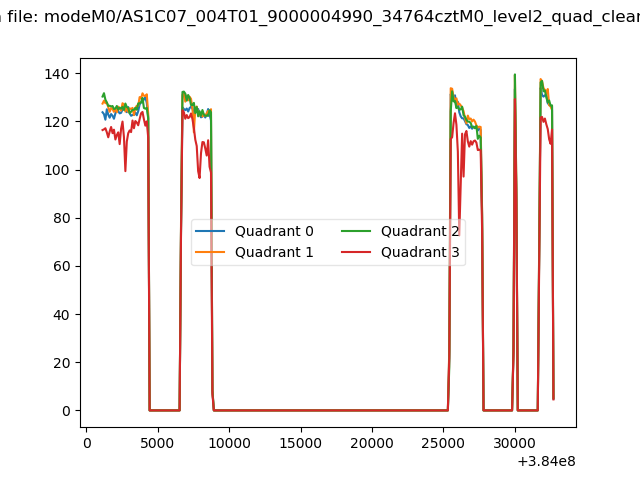 |
|
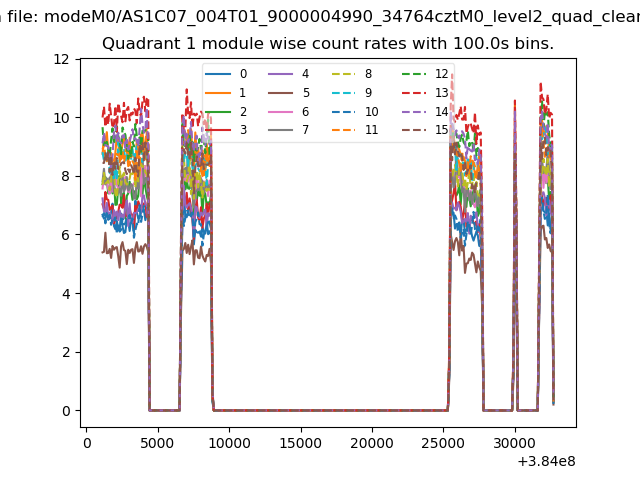
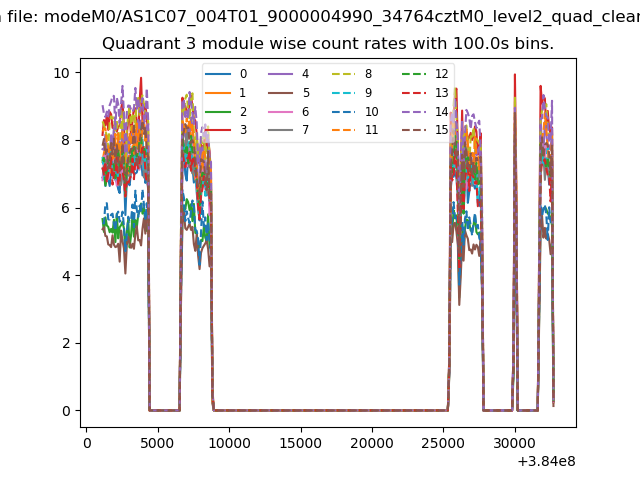
| Module-wise count rates for Quadrant A Data is divided into 100 sec bins |
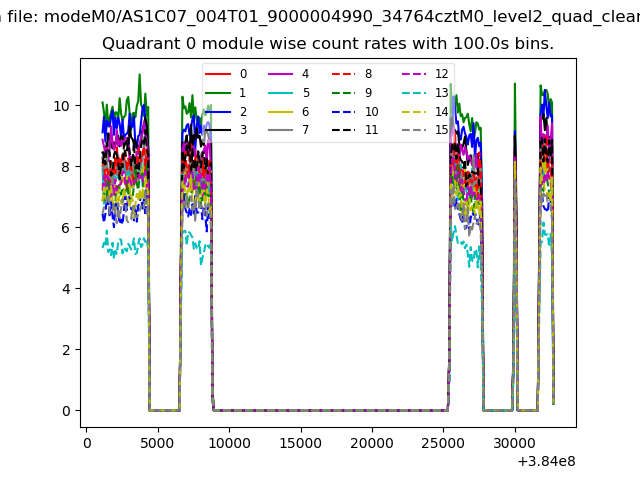 |
 |
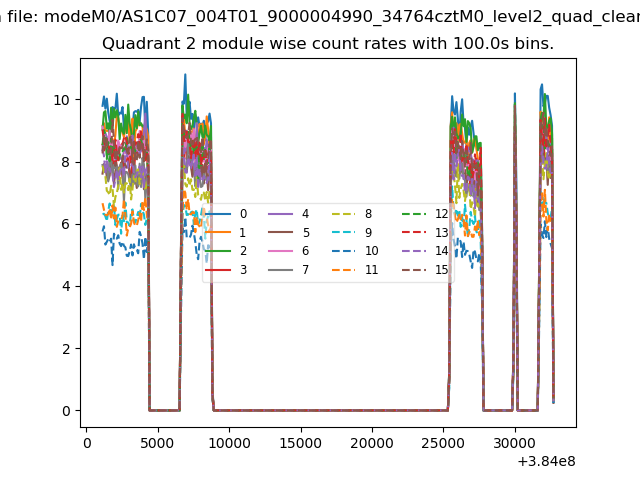
| Module-wise count rates for Quadrant B Data is divided into 100 sec bins |
 |
 |
| Module-wise count rates for Quadrant C Data is divided into 100 sec bins |
 |
 |
| Module-wise count rates for Quadrant D Data is divided into 100 sec bins |
 |
 |
| Parameter | Plot |
|---|---|
| CZT HV Monitor | 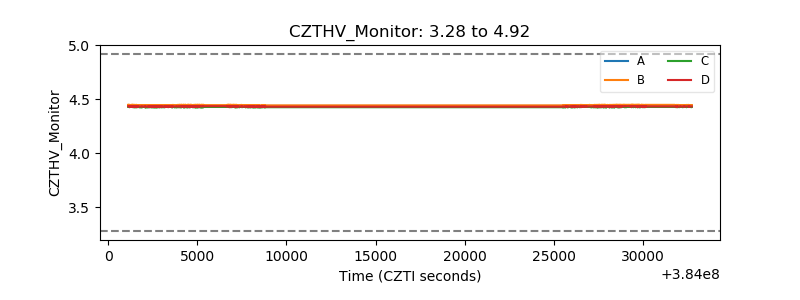 |
| D_VDD | 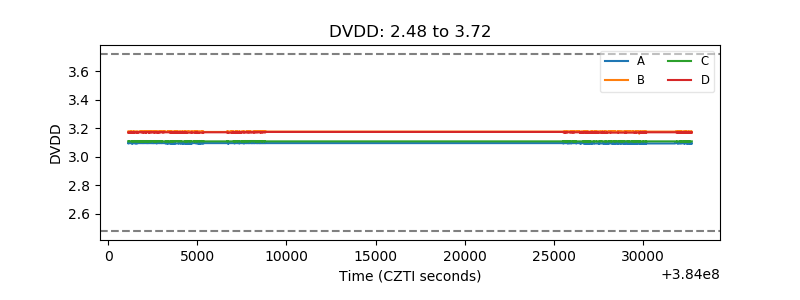 |
| Temperature 1 | 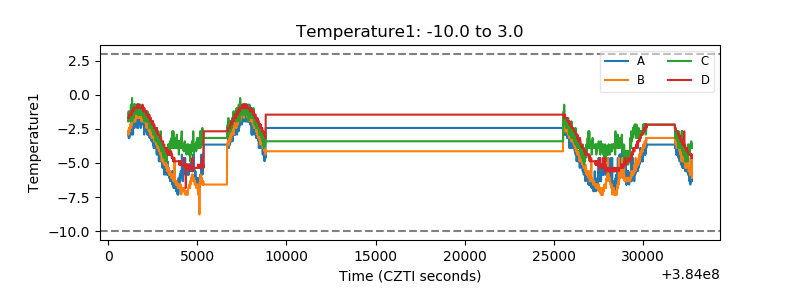 |
| Veto HV Monitor | 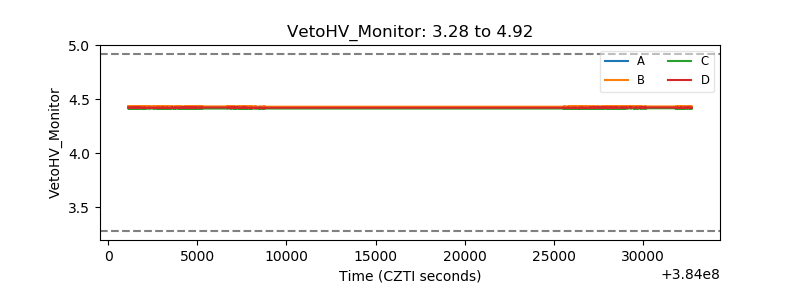 |
| Veto LLD | 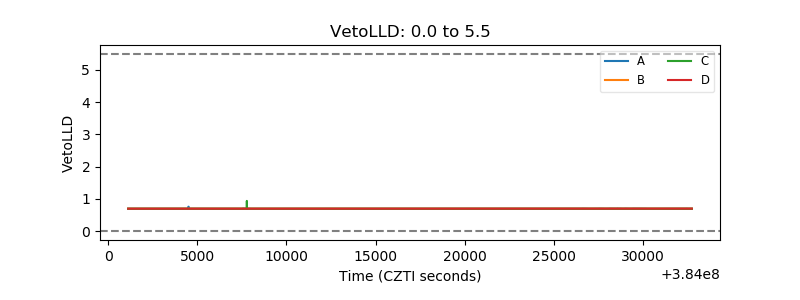 |
| Alpha Counter | 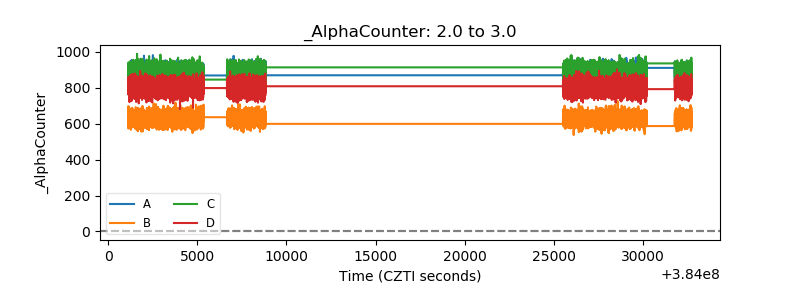 |
| _CPM_Rate | 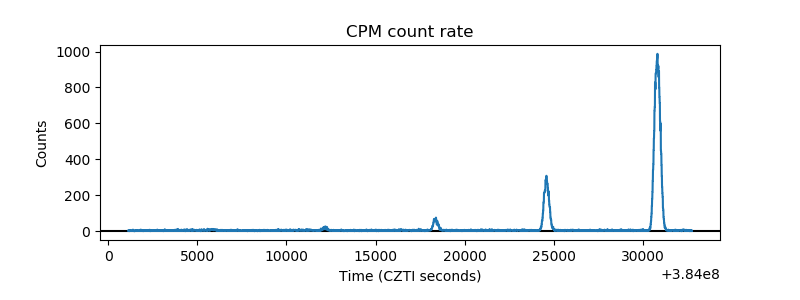 |
| CZT Counter | 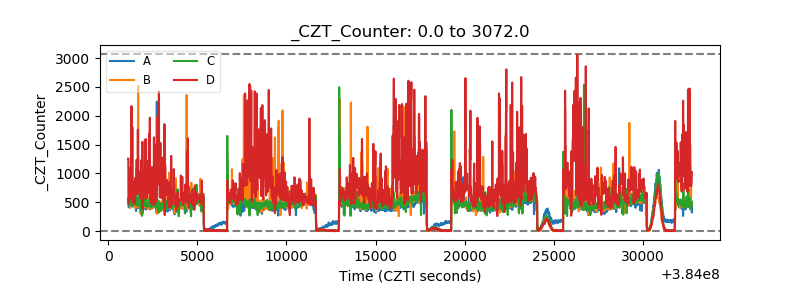 |
| +2.5 Volts monitor | 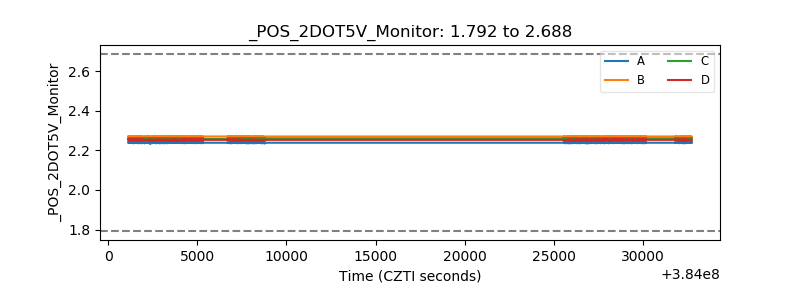 |
| +5 Volts monitor | 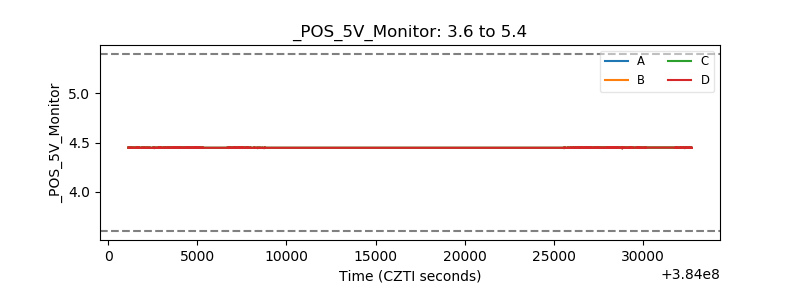 |
| _ROLL_ROT | 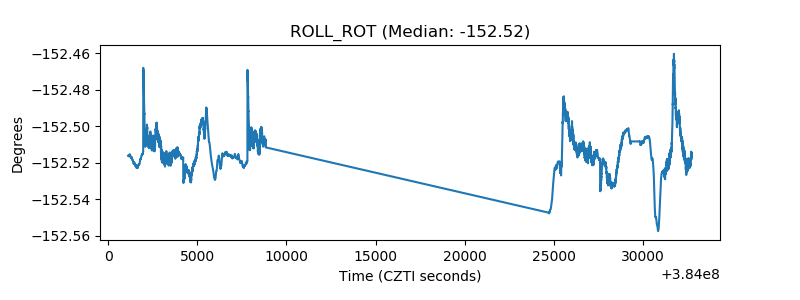 |
| _Roll_DEC | 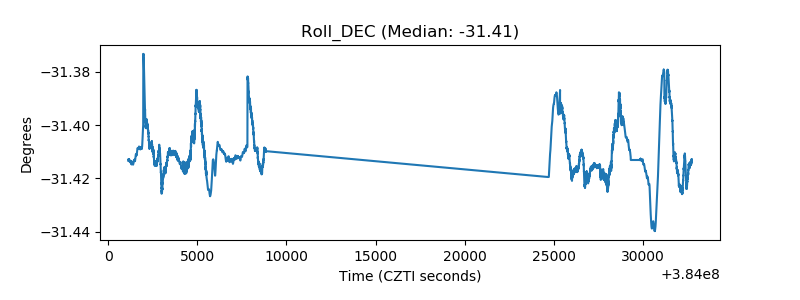 |
| _Roll_RA | 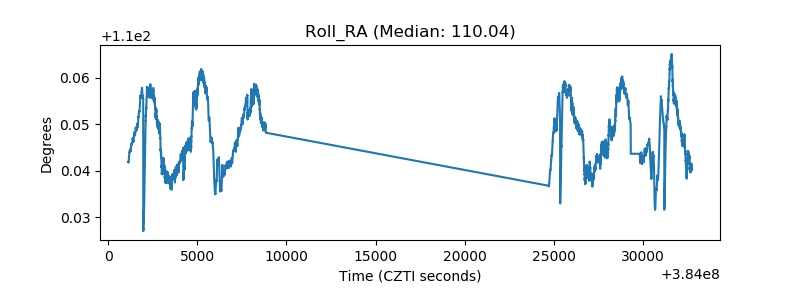 |
| Veto Counter | 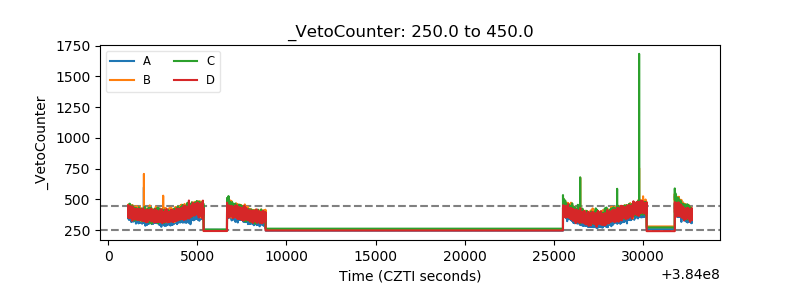 |