| Param | Original file | Final file |
|---|---|---|
| Filename | modeM0/AS1C07_004T01_9000004990_34754cztM0_level2.evt | modeM0/AS1C07_004T01_9000004990_34754cztM0_level2_quad_clean.evt |
| Size (bytes) | 536,330,880 | 57,147,840 |
| Size | 511.5 MB | 54.5 MB |
| Events in quadrant A | 2,754,610 | 350,951 |
| Events in quadrant B | 2,984,512 | 365,078 |
| Events in quadrant C | 2,984,161 | 356,890 |
| Events in quadrant D | 7,164,117 | 288,737 |
| Mode M9 | |||
|---|---|---|---|
| Quadrant | BADHDUFLAG | Total packets | Discarded packets |
| A | 0 | 31 | 0 |
| B | 0 | 31 | 0 |
| C | 0 | 31 | 0 |
| D | 0 | 32 | 0 |
| Mode M0 | |||
|---|---|---|---|
| Quadrant | BADHDUFLAG | Total packets | Discarded packets |
| A | 0 | 11116 | 3 |
| B | 0 | 11870 | 2 |
| C | 0 | 11704 | 2 |
| D | 0 | 24915 | 2 |
| Mode SS | |||
|---|---|---|---|
| Quadrant | BADHDUFLAG | Total packets | Discarded packets |
| A | 0 | 108 | 0 |
| B | 0 | 108 | 0 |
| C | 0 | 108 | 0 |
| D | 0 | 108 | 0 |
| Quadrant | Total seconds | Saturated seconds | Saturation percentage |
|---|---|---|---|
| A | 5253 | 8 | 0.152294% |
| B | 5253 | 47 | 0.894727% |
| C | 5253 | 35 | 0.666286% |
| D | 5253 | 762 | 14.505997% |
Noise dominated data is calculated using 1-second bins in cleaned event files. If a bin has >2000 counts, and if more than 50% of those come from <1% of pixels, then it is considered to be noise-dominated and hence unusable.
| Quadrant | # 1 sec bins | Bins with >0 counts | Bins with >2000 counts | High rate bins dominated by noise | Noise dominated (total time) | Noise dominated (detector-on time) | Marked lightcurve |
|---|---|---|---|---|---|---|---|
| A | 7256 | 5254 | 0 | 0 | 0.00% | 0.00% | 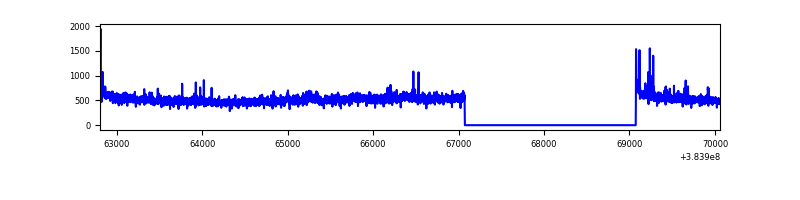 |
| B | 7256 | 5254 | 26 | 26 | 0.36% | 0.49% | 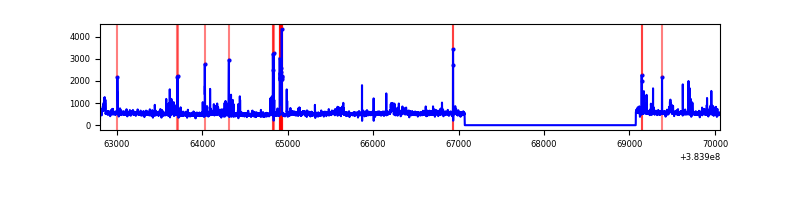 |
| C | 7256 | 5254 | 24 | 24 | 0.33% | 0.46% | 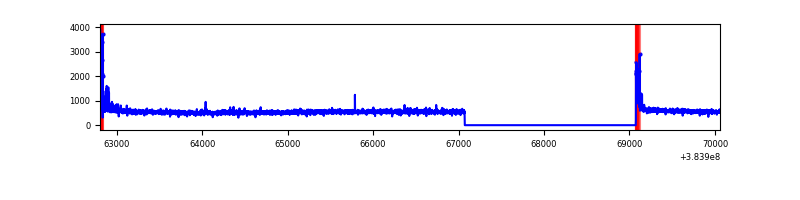 |
| D | 7256 | 5254 | 821 | 821 | 11.31% | 15.63% | 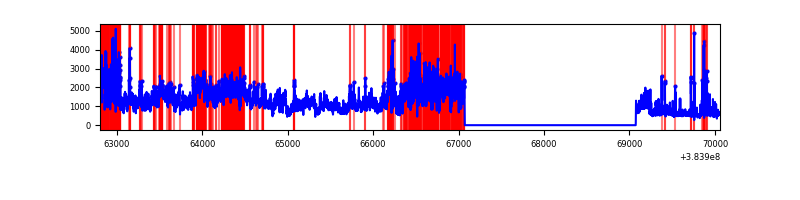 |
Top three noisy pixels from each quadrant. If the there are fewer than three noisy pixels in the level2.evt file, extra rows are filled as -1
| Pixel properties | Quadrant properties | ||||||
|---|---|---|---|---|---|---|---|
| Quadrant | DetID | PixID | Counts | Sigma | Mean | Median | Sigma |
| A | 15 | 223 | 78424 | 579.78 | 671 | 660 | 134.1 |
| A | 10 | 83 | 47479 | 349.06 | 671 | 660 | 134.1 |
| A | 15 | 174 | 14518 | 103.32 | 671 | 660 | 134.1 |
| B | 5 | 172 | 160010 | 1258.81 | 676 | 661 | 126.6 |
| B | 0 | 190 | 81674 | 639.98 | 676 | 661 | 126.6 |
| B | 5 | 255 | 50387 | 392.82 | 676 | 661 | 126.6 |
| C | 15 | 214 | 225242 | 1458.21 | 665 | 670 | 154.0 |
| C | 0 | 10 | 128916 | 832.74 | 665 | 670 | 154.0 |
| C | 14 | 67 | 33805 | 215.15 | 665 | 670 | 154.0 |
| D | 1 | 52 | 3213144 | 21548.21 | 622 | 610 | 149.1 |
| D | 8 | 195 | 639300 | 4284.04 | 622 | 610 | 149.1 |
| D | 7 | 223 | 406978 | 2725.73 | 622 | 610 | 149.1 |
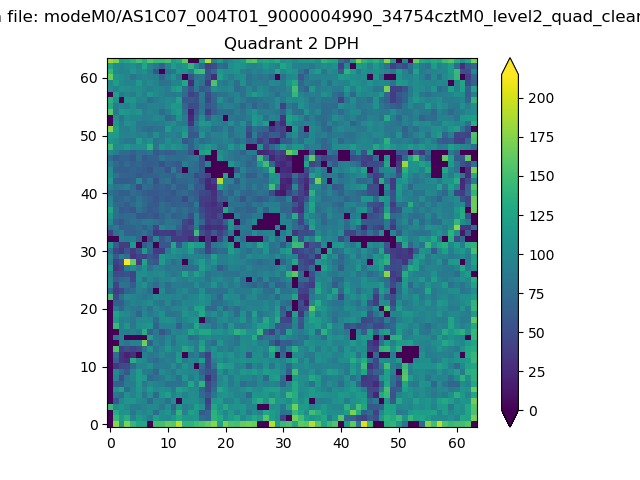
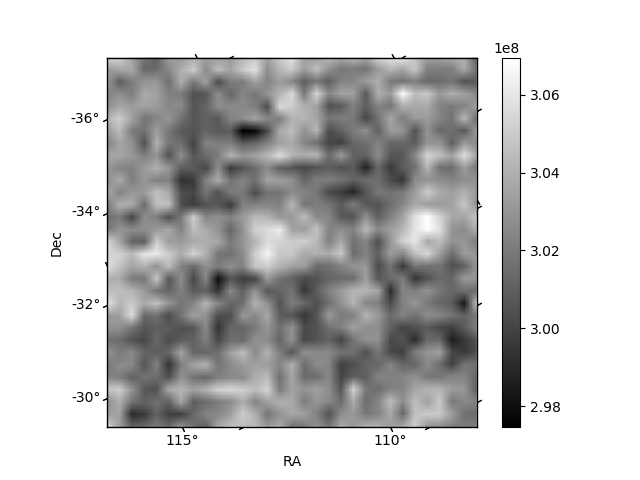
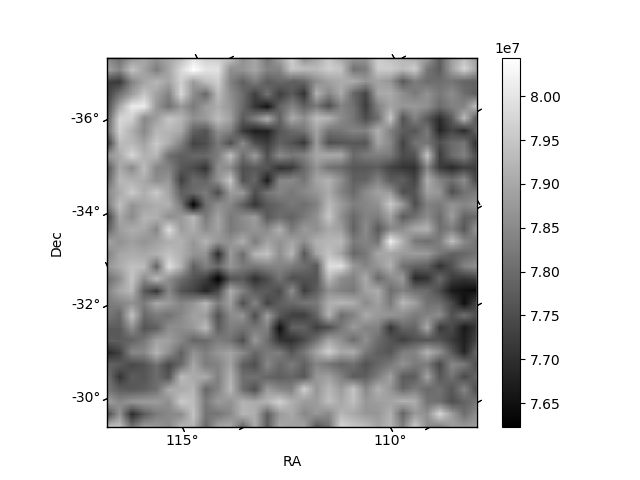
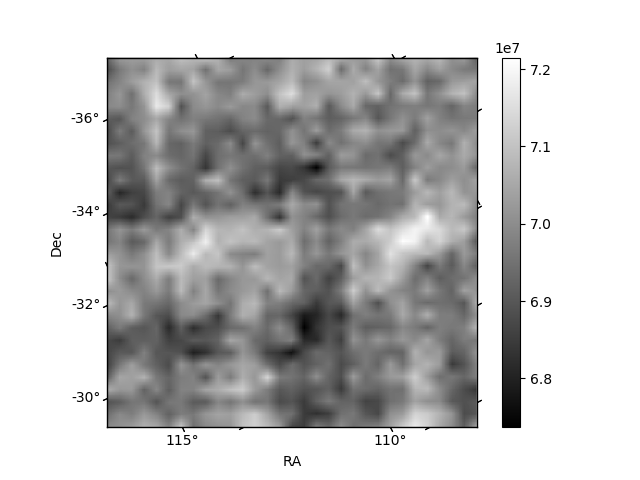
Histogram calculated using DETX and DETY for each event in the final _common_clean file
| Quadrant A | 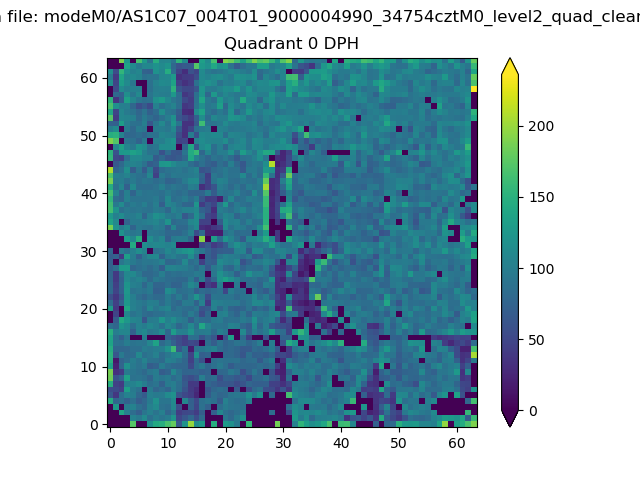 |
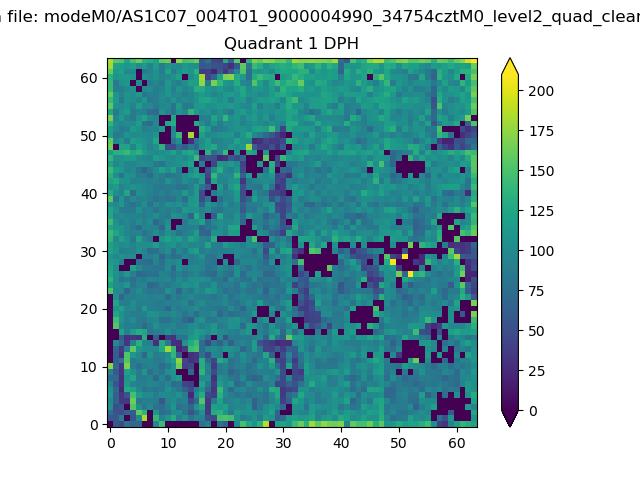 |
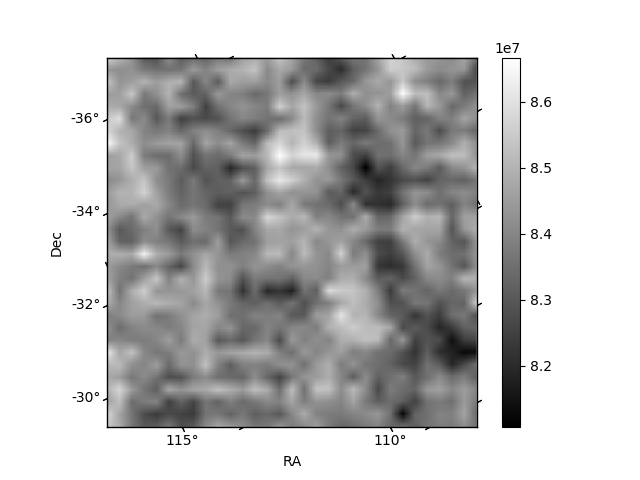
Quadrant B |
|---|---|---|---|
| Quadrant D | 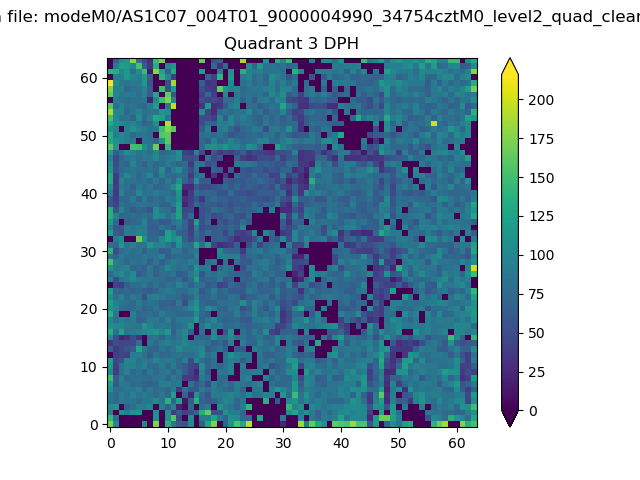 |
 |
Quadrant C |
| Plot type | Count rate plots | Images |
|---|---|---|
| Comparison with Poisson distribution Blue bars denote a histogram of data divided into 1 sec bins. Red curve is a Poisson curve with rate = median count rate of data. |
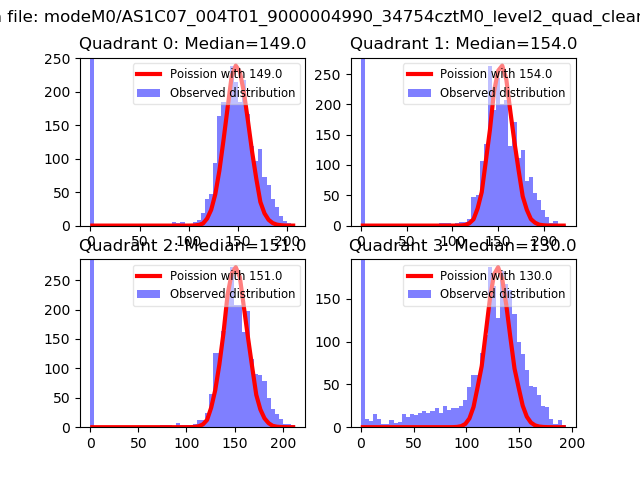 |
 |
| Quadrant-wise count rates Data is divided into 100 sec bins |
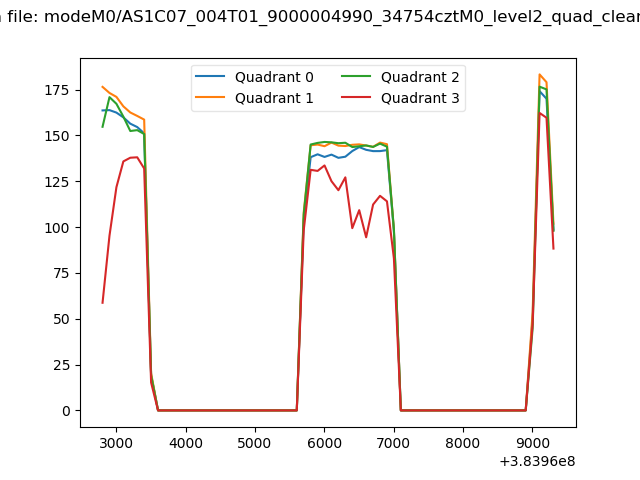 |
|
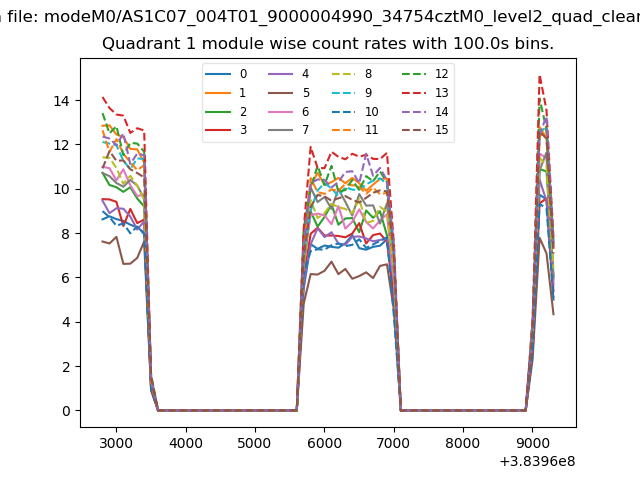
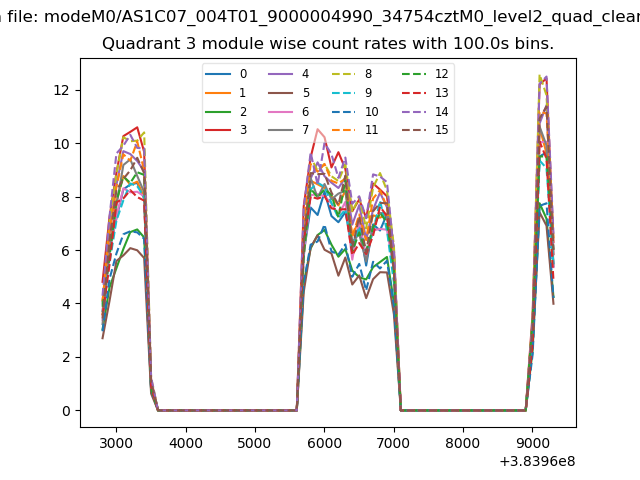
| Module-wise count rates for Quadrant A Data is divided into 100 sec bins |
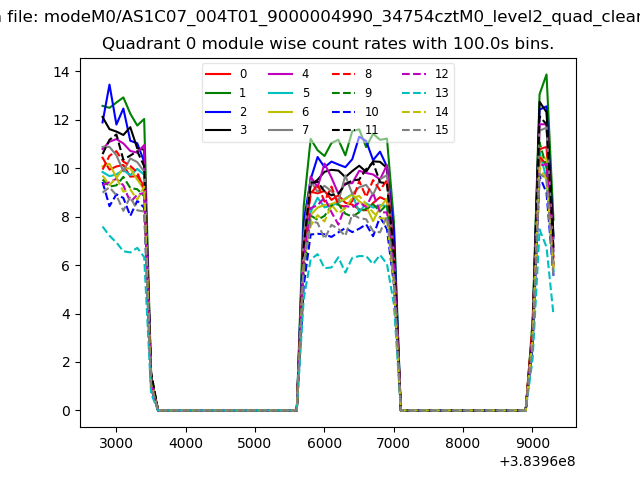 |
 |
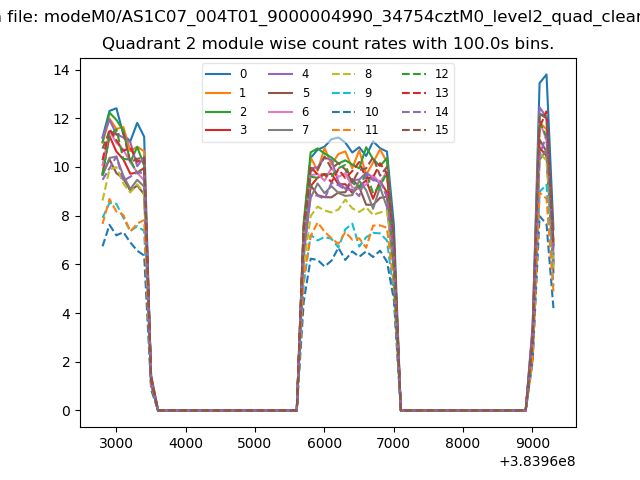
| Module-wise count rates for Quadrant B Data is divided into 100 sec bins |
 |
 |
| Module-wise count rates for Quadrant C Data is divided into 100 sec bins |
 |
 |
| Module-wise count rates for Quadrant D Data is divided into 100 sec bins |
 |
 |
| Parameter | Plot |
|---|---|
| CZT HV Monitor | 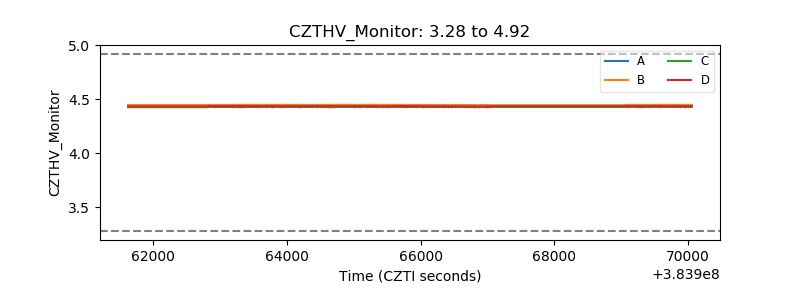 |
| D_VDD | 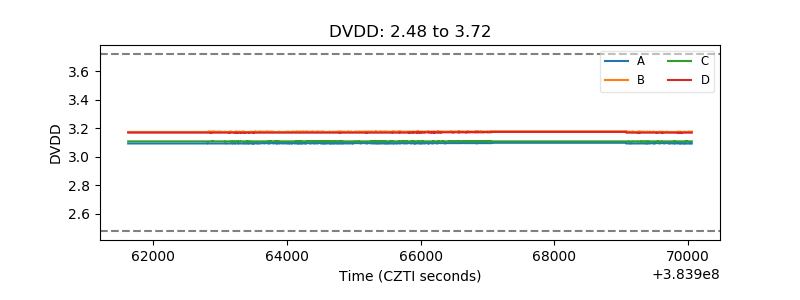 |
| Temperature 1 | 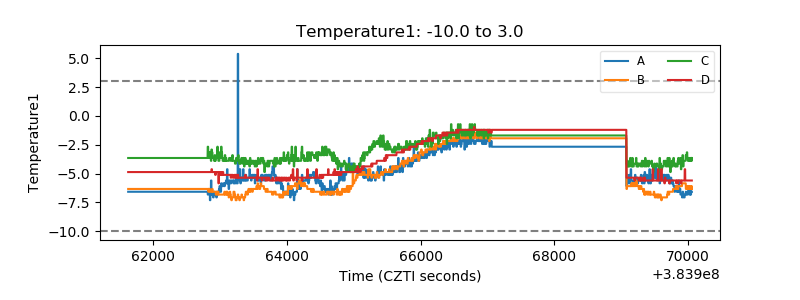 |
| Veto HV Monitor | 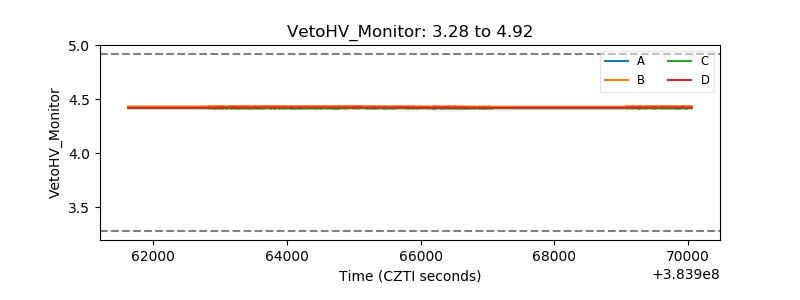 |
| Veto LLD | 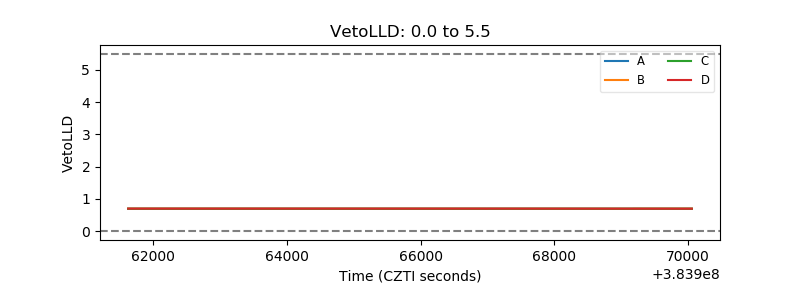 |
| Alpha Counter |  |
| _CPM_Rate | 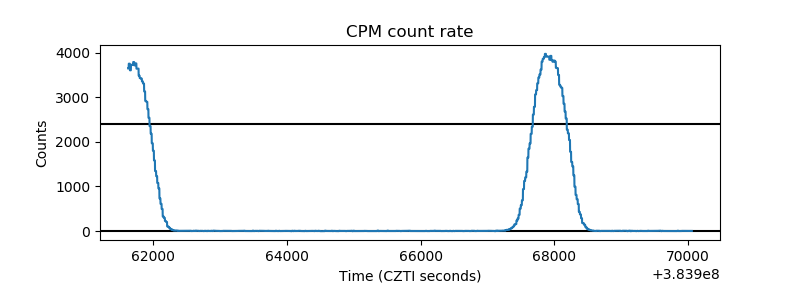 |
| CZT Counter | 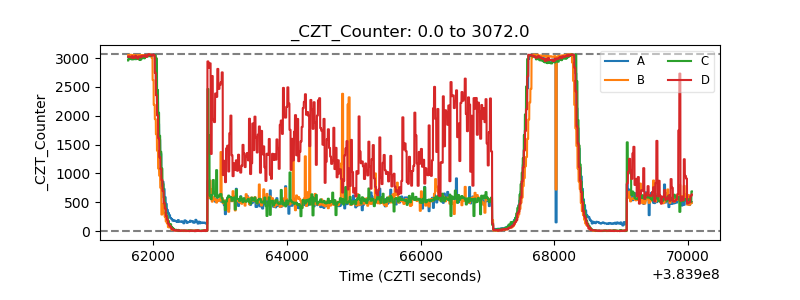 |
| +2.5 Volts monitor | 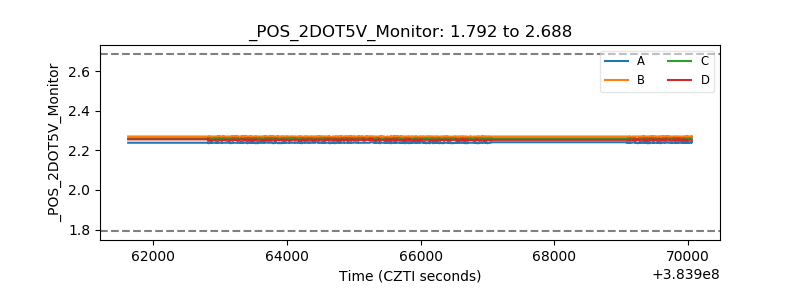 |
| +5 Volts monitor | 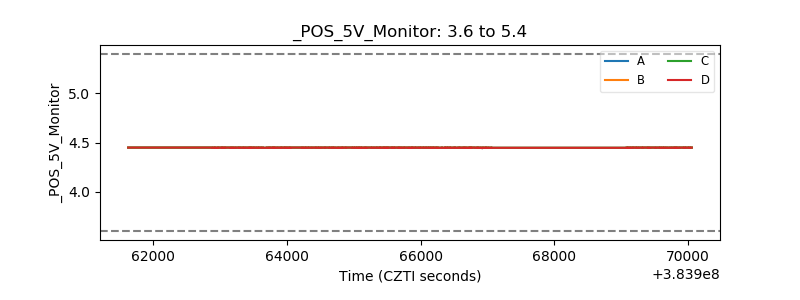 |
| _ROLL_ROT | 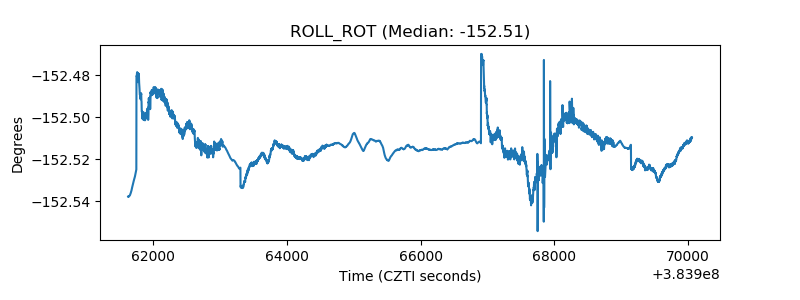 |
| _Roll_DEC | 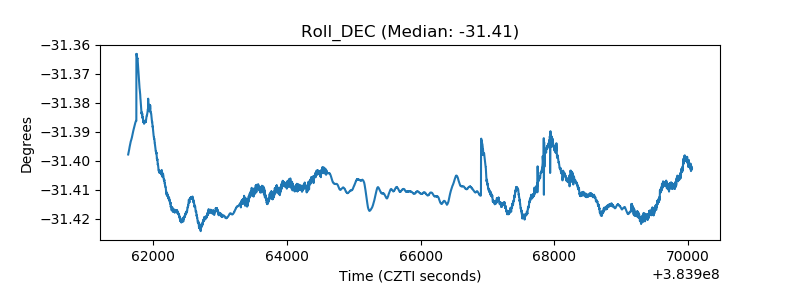 |
| _Roll_RA | 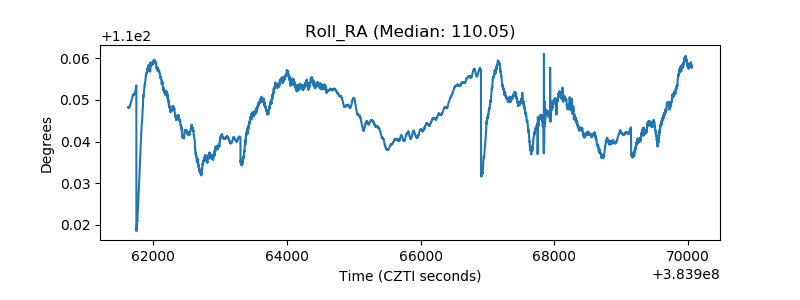 |
| Veto Counter | 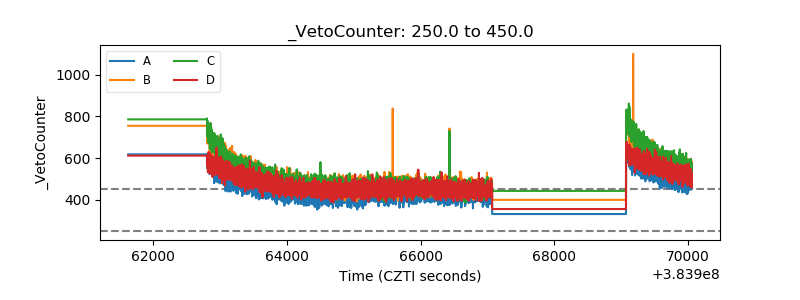 |