| Param | Original file | Final file |
|---|---|---|
| Filename | modeM0/AS1C07_004T01_9000004990cztM0_level2_bc.evt | modeM0/AS1C07_004T01_9000004990cztM0_level2_quad_clean.evt |
| Size (bytes) | 11,979,924,480 | 2,851,122,240 |
| Size | 11.2 GB | 2.7 GB |
| Events in quadrant A | 55,908,431 | 17,921,868 |
| Events in quadrant B | 72,463,409 | 18,164,381 |
| Events in quadrant C | 64,316,434 | 18,297,983 |
| Events in quadrant D | 154,292,502 | 15,991,995 |
| Mode M9 | |||
|---|---|---|---|
| Quadrant | BADHDUFLAG | Total packets | Discarded packets |
| A | 0 | 898 | 0 |
| B | 0 | 898 | 0 |
| C | 0 | 898 | 0 |
| D | 0 | 899 | 0 |
| Mode M0 | |||
|---|---|---|---|
| Quadrant | BADHDUFLAG | Total packets | Discarded packets |
| A | 0 | 492352 | 0 |
| B | 0 | 565871 | 0 |
| C | 0 | 504540 | 0 |
| D | 0 | 838565 | 0 |
| Mode SS | |||
|---|---|---|---|
| Quadrant | BADHDUFLAG | Total packets | Discarded packets |
| A | 0 | 4760 | 0 |
| B | 0 | 4760 | 0 |
| C | 0 | 4760 | 0 |
| D | 0 | 4760 | 0 |
| Quadrant | Total seconds | Saturated seconds | Saturation percentage |
|---|---|---|---|
| A | 233291 | 1335 | 0.572247% |
| B | 233289 | 7285 | 3.122736% |
| C | 233295 | 1252 | 0.536660% |
| D | 233282 | 26840 | 11.505388% |
Noise dominated data is calculated using 1-second bins in cleaned event files. If a bin has >2000 counts, and if more than 50% of those come from <1% of pixels, then it is considered to be noise-dominated and hence unusable.
| Quadrant | # 1 sec bins | Bins with >0 counts | Bins with >2000 counts | High rate bins dominated by noise | Noise dominated (total time) | Noise dominated (detector-on time) | Marked lightcurve |
|---|---|---|---|---|---|---|---|
| A | 343166 | 233335 | 480 | 480 | 0.14% | 0.21% | 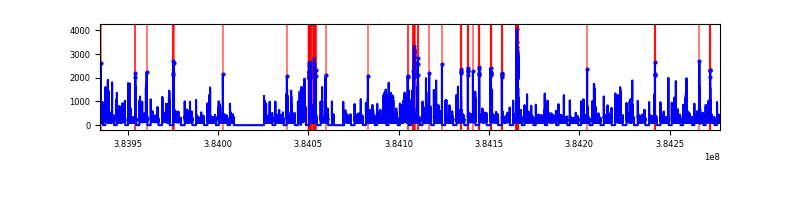 |
| B | 343166 | 233297 | 590 | 590 | 0.17% | 0.25% | 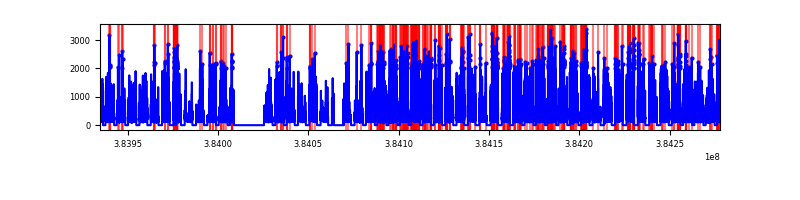 |
| C | 343166 | 233304 | 269 | 269 | 0.08% | 0.12% | 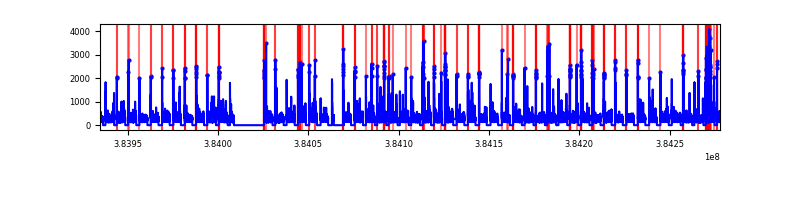 |
| D | 343166 | 233277 | 10438 | 10438 | 3.04% | 4.47% | 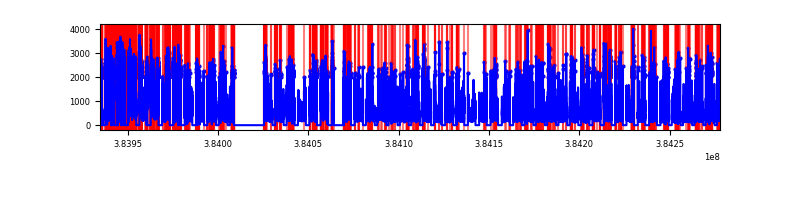 |
Top three noisy pixels from each quadrant. If the there are fewer than three noisy pixels in the level2.evt file, extra rows are filled as -1
| Pixel properties | Quadrant properties | ||||||
|---|---|---|---|---|---|---|---|
| Quadrant | DetID | PixID | Counts | Sigma | Mean | Median | Sigma |
| A | 15 | 169 | 3437885 | 1279.7 | 12268 | 12093 | 2677.0 |
| A | 10 | 83 | 1432127 | 530.45 | 12268 | 12093 | 2677.0 |
| A | 7 | 32 | 1026366 | 378.88 | 12268 | 12093 | 2677.0 |
| B | 5 | 172 | 12134872 | 5054.21 | 12406 | 12158 | 2398.5 |
| B | 5 | 255 | 5636171 | 2344.77 | 12406 | 12158 | 2398.5 |
| B | 0 | 190 | 2210754 | 916.64 | 12406 | 12158 | 2398.5 |
| C | 15 | 214 | 9456286 | 3427.91 | 12258 | 12211 | 2755.1 |
| C | 0 | 10 | 2663395 | 962.3 | 12258 | 12211 | 2755.1 |
| C | 14 | 67 | 2619010 | 946.19 | 12258 | 12211 | 2755.1 |
| D | 8 | 195 | 38244844 | 14082.23 | 11559 | 11219 | 2715.0 |
| D | 1 | 52 | 28233738 | 10394.93 | 11559 | 11219 | 2715.0 |
| D | 2 | 250 | 12904007 | 4748.68 | 11559 | 11219 | 2715.0 |
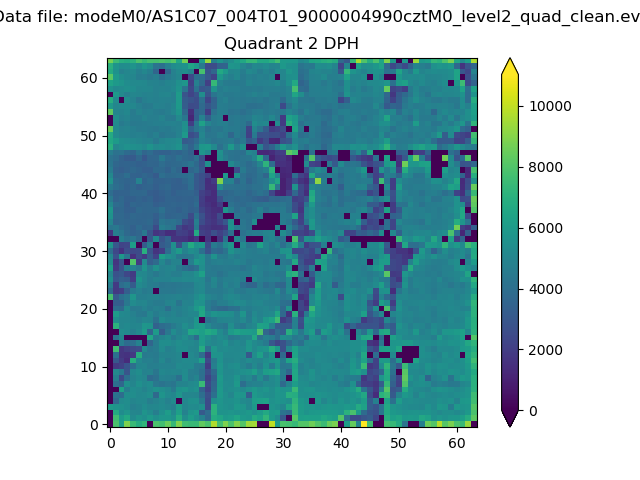
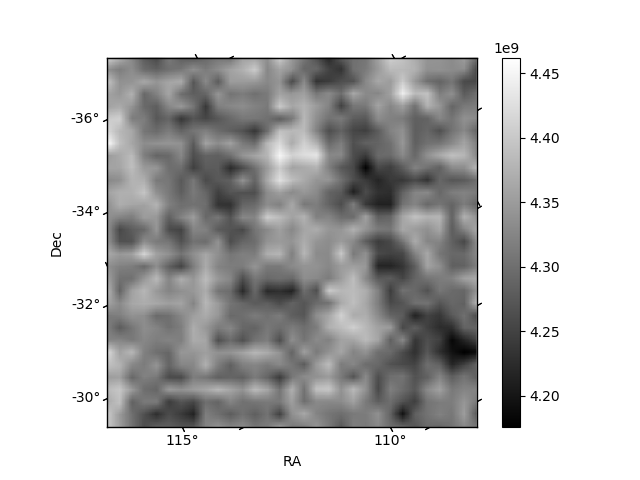
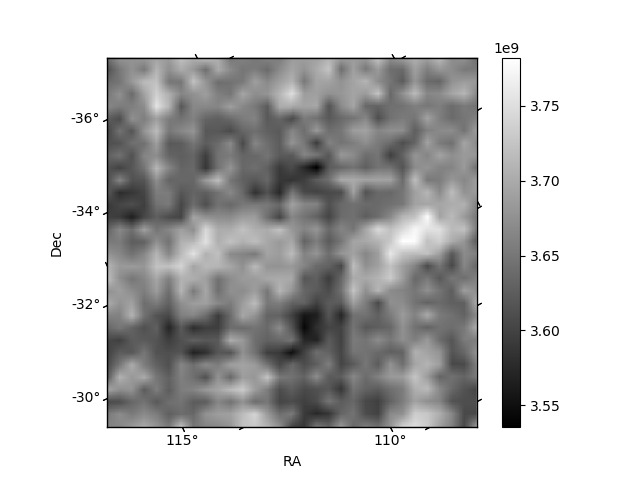
Histogram calculated using DETX and DETY for each event in the final _common_clean file
| Quadrant A | 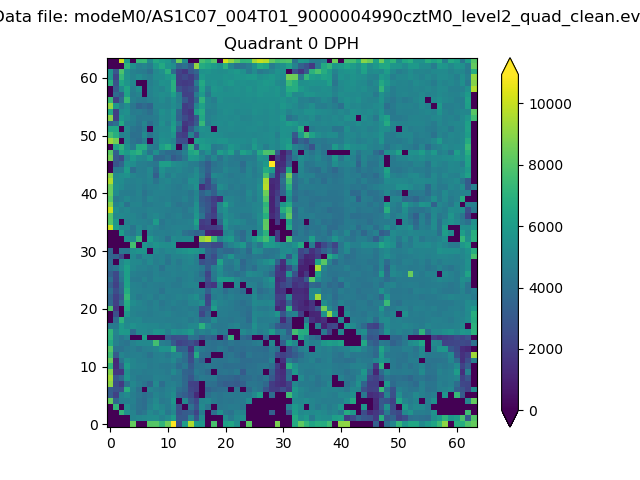 |
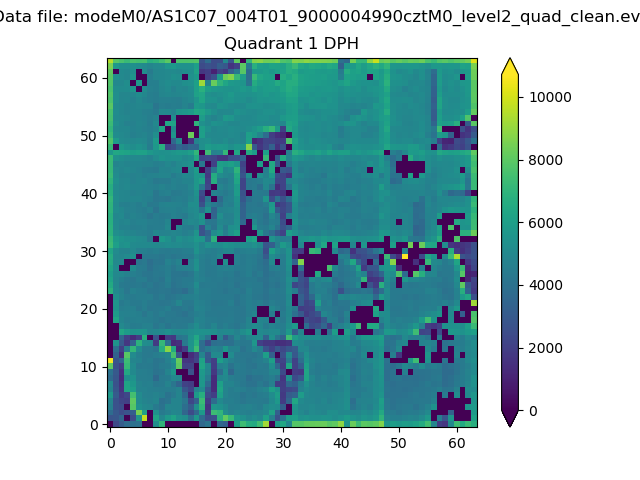 |
Quadrant B |
|---|---|---|---|
| Quadrant D | 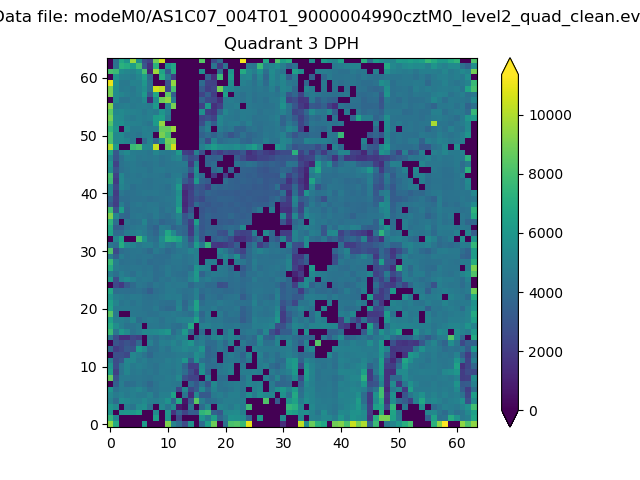 |
 |
Quadrant C |
| Plot type | Count rate plots | Images |
|---|---|---|
| Comparison with Poisson distribution Blue bars denote a histogram of data divided into 1 sec bins. Red curve is a Poisson curve with rate = median count rate of data. |
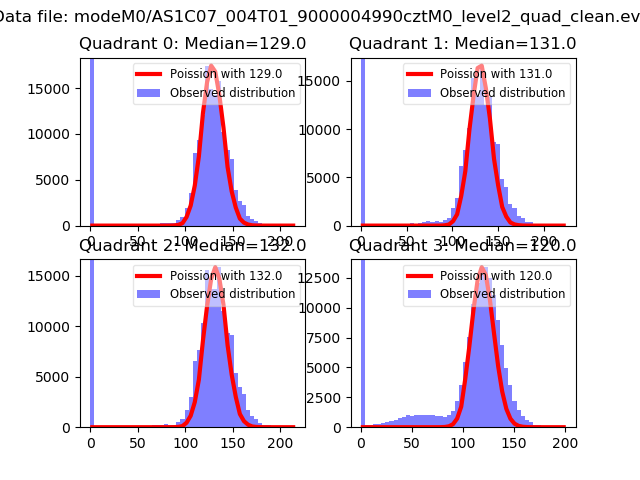 |
 |
| Quadrant-wise count rates Data is divided into 100 sec bins |
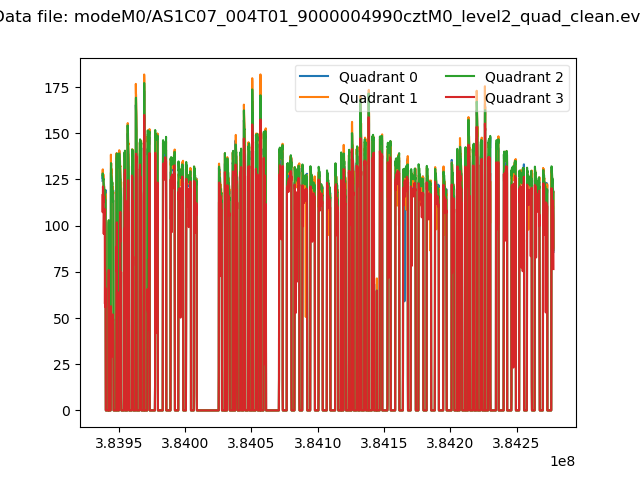 |
|
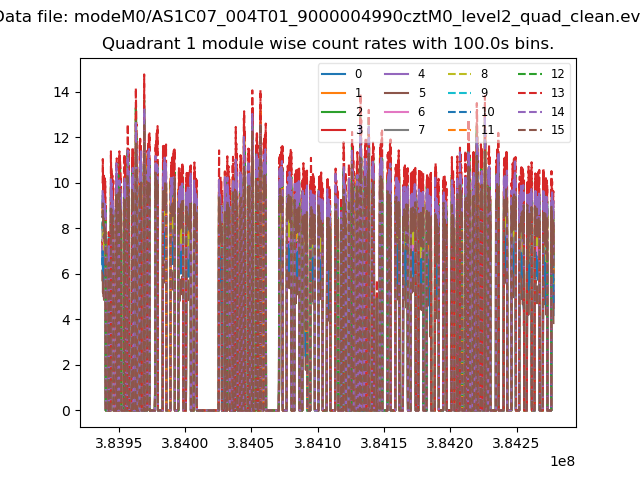
| Module-wise count rates for Quadrant A Data is divided into 100 sec bins |
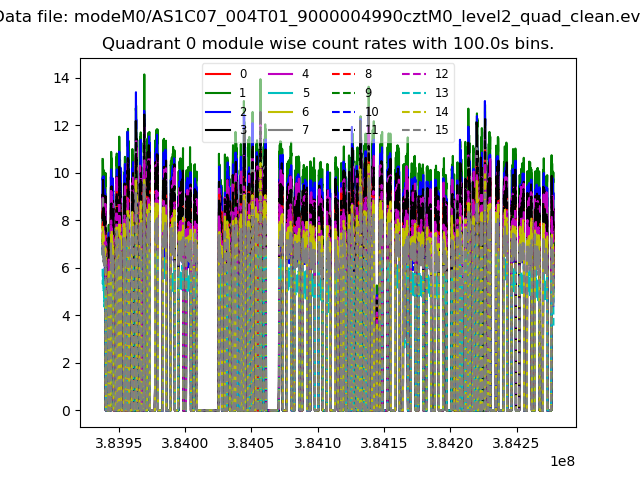 |
 |
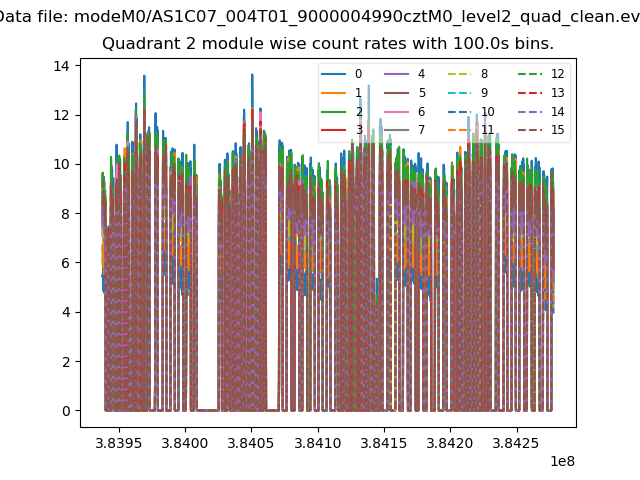
| Module-wise count rates for Quadrant B Data is divided into 100 sec bins |
 |
 |
| Module-wise count rates for Quadrant C Data is divided into 100 sec bins |
 |
 |
| Module-wise count rates for Quadrant D Data is divided into 100 sec bins |
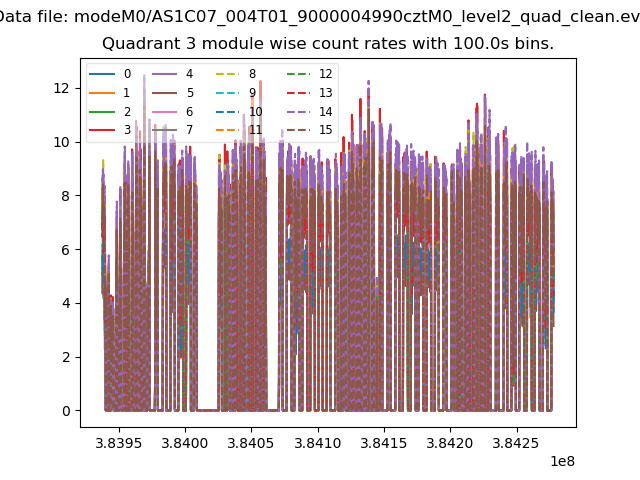 |
 |
| Parameter | Plot |
|---|---|
| CZT HV Monitor | 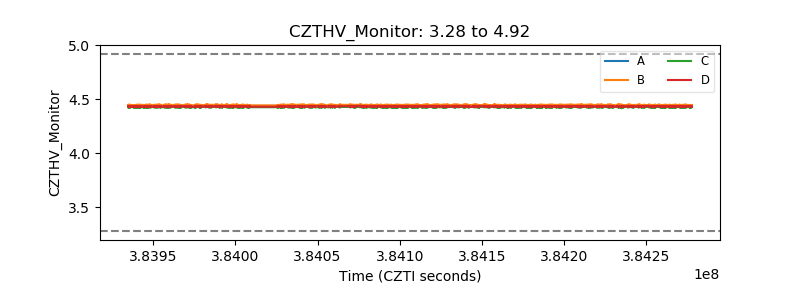 |
| D_VDD | 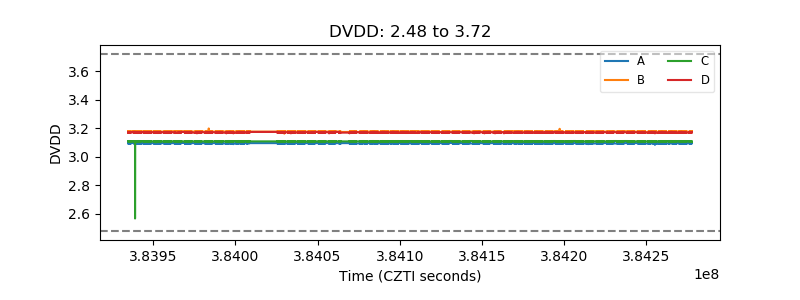 |
| Temperature 1 | 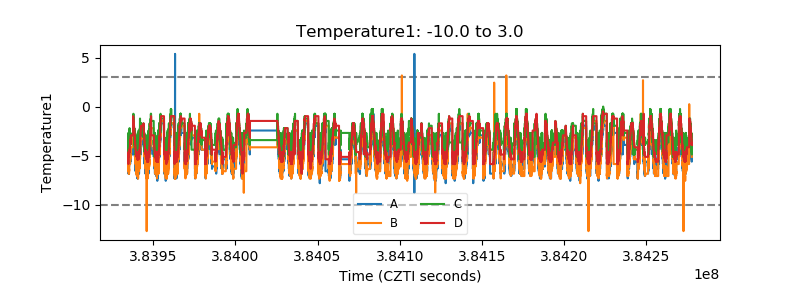 |
| Veto HV Monitor | 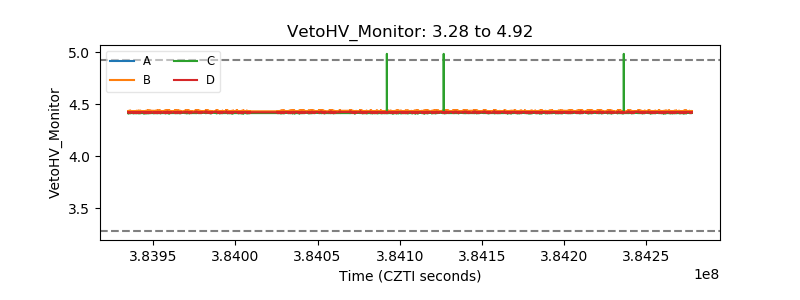 |
| Veto LLD | 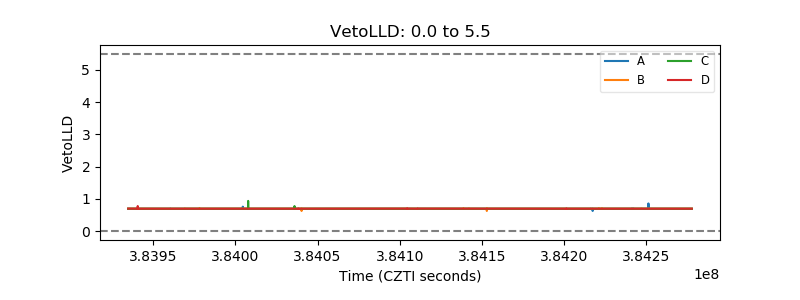 |
| Alpha Counter | 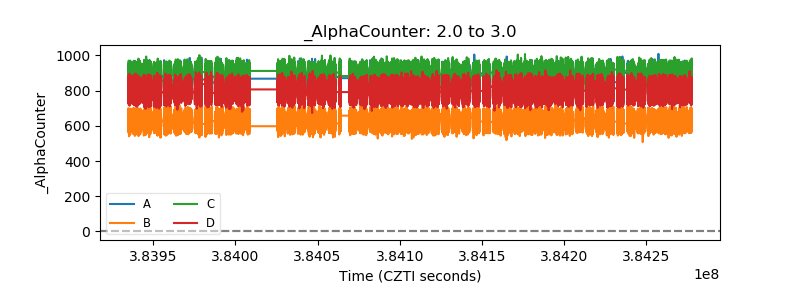 |
| _CPM_Rate | 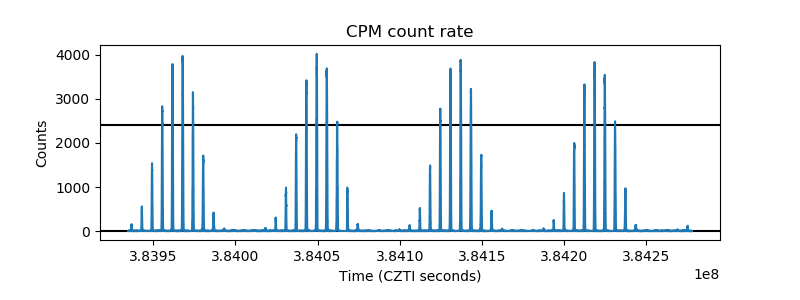 |
| CZT Counter | 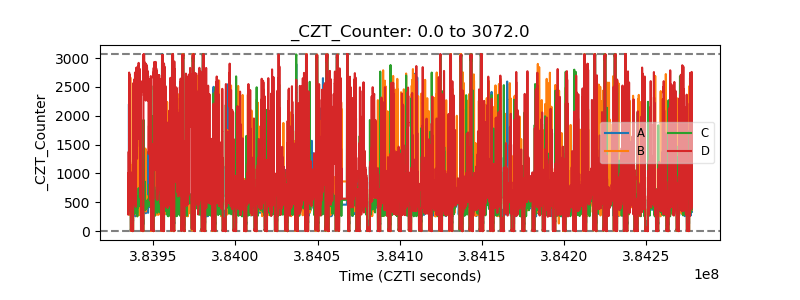 |
| +2.5 Volts monitor | 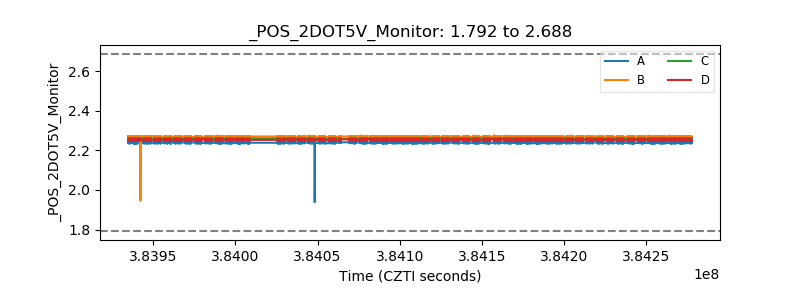 |
| +5 Volts monitor | 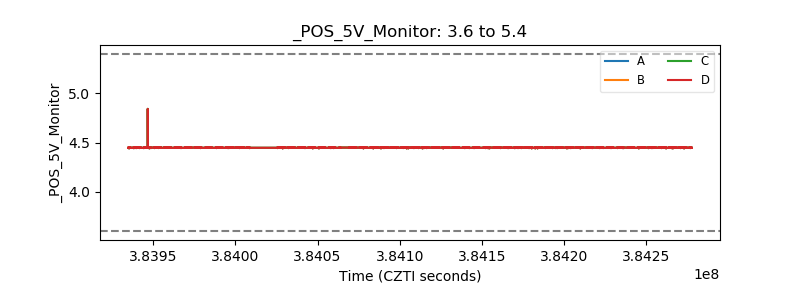 |
| _ROLL_ROT | 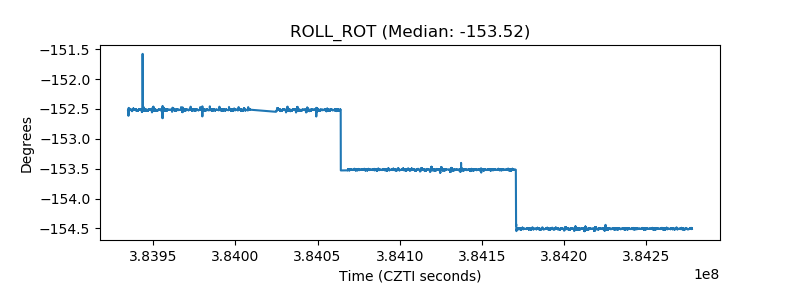 |
| _Roll_DEC | 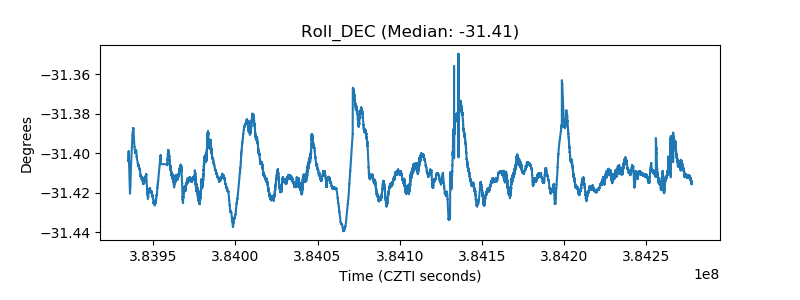 |
| _Roll_RA | 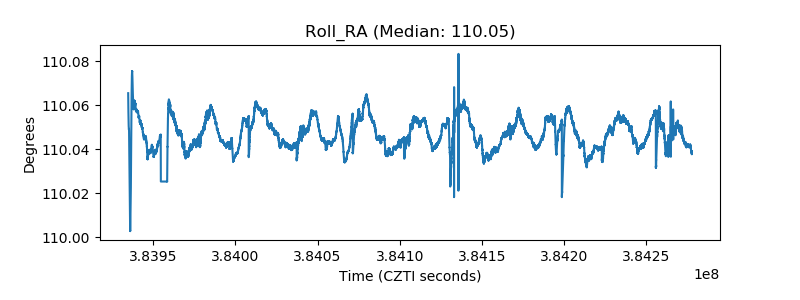 |
| Veto Counter | 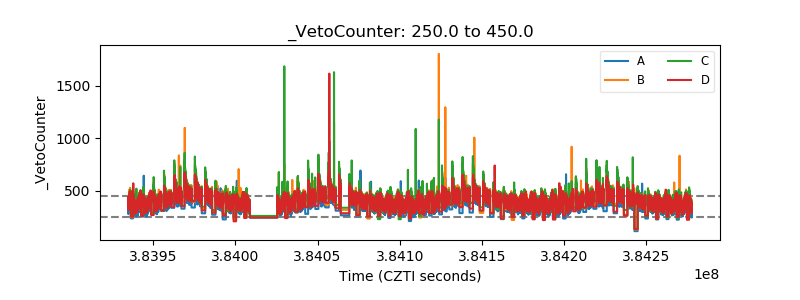 |