| Param | Original file | Final file |
|---|---|---|
| Filename | modeM0/AS1A10_094T37_9000004986cztM0_level2_bc.evt | modeM0/AS1A10_094T37_9000004986cztM0_level2_quad_clean.evt |
| Size (bytes) | 235,883,520 | 68,719,680 |
| Size | 225.0 MB | 65.5 MB |
| Events in quadrant A | 1,120,478 | 445,415 |
| Events in quadrant B | 1,357,453 | 445,400 |
| Events in quadrant C | 1,218,942 | 438,984 |
| Events in quadrant D | 3,098,038 | 399,337 |
| Mode M9 | |||
|---|---|---|---|
| Quadrant | BADHDUFLAG | Total packets | Discarded packets |
| A | 0 | 13 | 0 |
| B | 0 | 13 | 0 |
| C | 0 | 13 | 0 |
| D | 0 | 13 | 0 |
| Mode M0 | |||
|---|---|---|---|
| Quadrant | BADHDUFLAG | Total packets | Discarded packets |
| A | 0 | 10461 | 0 |
| B | 0 | 11387 | 0 |
| C | 0 | 10363 | 0 |
| D | 0 | 17457 | 0 |
| Mode SS | |||
|---|---|---|---|
| Quadrant | BADHDUFLAG | Total packets | Discarded packets |
| A | 0 | 102 | 0 |
| B | 0 | 102 | 0 |
| C | 0 | 102 | 0 |
| D | 0 | 102 | 0 |
| Quadrant | Total seconds | Saturated seconds | Saturation percentage |
|---|---|---|---|
| A | 5015 | 21 | 0.418744% |
| B | 5015 | 62 | 1.236291% |
| C | 5015 | 13 | 0.259222% |
| D | 5015 | 431 | 8.594217% |
Noise dominated data is calculated using 1-second bins in cleaned event files. If a bin has >2000 counts, and if more than 50% of those come from <1% of pixels, then it is considered to be noise-dominated and hence unusable.
| Quadrant | # 1 sec bins | Bins with >0 counts | Bins with >2000 counts | High rate bins dominated by noise | Noise dominated (total time) | Noise dominated (detector-on time) | Marked lightcurve |
|---|---|---|---|---|---|---|---|
| A | 6327 | 5016 | 7 | 7 | 0.11% | 0.14% | 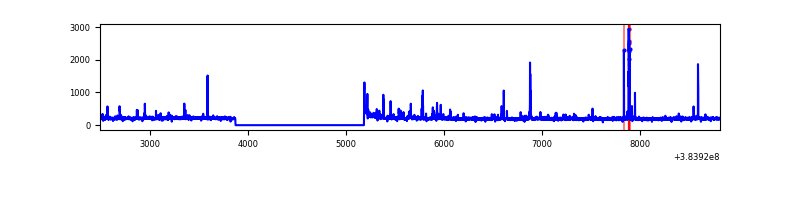 |
| B | 6327 | 5015 | 8 | 8 | 0.13% | 0.16% | 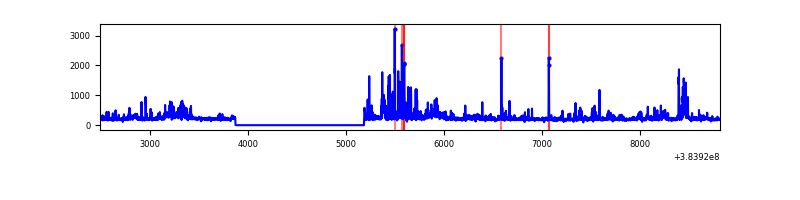 |
| C | 6327 | 5015 | 1 | 1 | 0.02% | 0.02% | 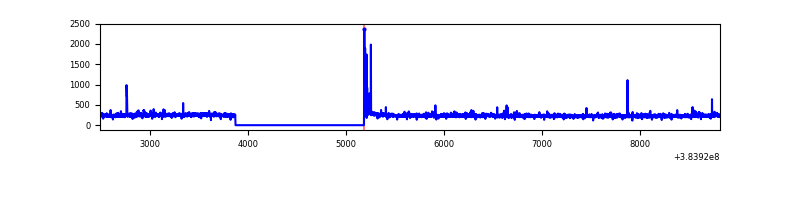 |
| D | 6327 | 5014 | 94 | 94 | 1.49% | 1.87% | 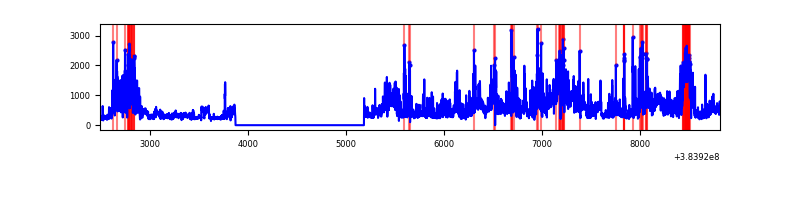 |
Top three noisy pixels from each quadrant. If the there are fewer than three noisy pixels in the level2.evt file, extra rows are filled as -1
| Pixel properties | Quadrant properties | ||||||
|---|---|---|---|---|---|---|---|
| Quadrant | DetID | PixID | Counts | Sigma | Mean | Median | Sigma |
| A | 10 | 83 | 30445 | 521.9 | 248 | 243 | 57.9 |
| A | 15 | 223 | 28799 | 493.46 | 248 | 243 | 57.9 |
| A | 15 | 174 | 26490 | 453.56 | 248 | 243 | 57.9 |
| B | 5 | 172 | 132673 | 2539.62 | 248 | 243 | 52.1 |
| B | 5 | 255 | 89714 | 1715.79 | 248 | 243 | 52.1 |
| B | 0 | 190 | 83108 | 1589.11 | 248 | 243 | 52.1 |
| C | 15 | 214 | 203117 | 3436.46 | 242 | 239 | 59.0 |
| C | 0 | 10 | 31769 | 534.07 | 242 | 239 | 59.0 |
| C | 14 | 67 | 14689 | 244.76 | 242 | 239 | 59.0 |
| D | 8 | 195 | 885316 | 14060.61 | 232 | 225 | 62.9 |
| D | 2 | 250 | 409343 | 6499.27 | 232 | 225 | 62.9 |
| D | 1 | 52 | 293942 | 4666.01 | 232 | 225 | 62.9 |
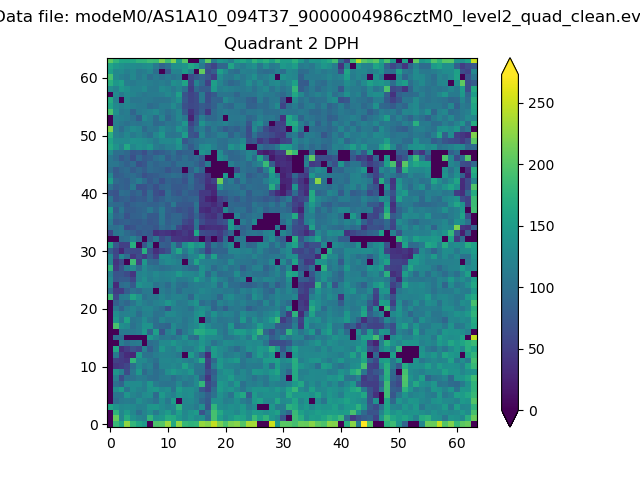
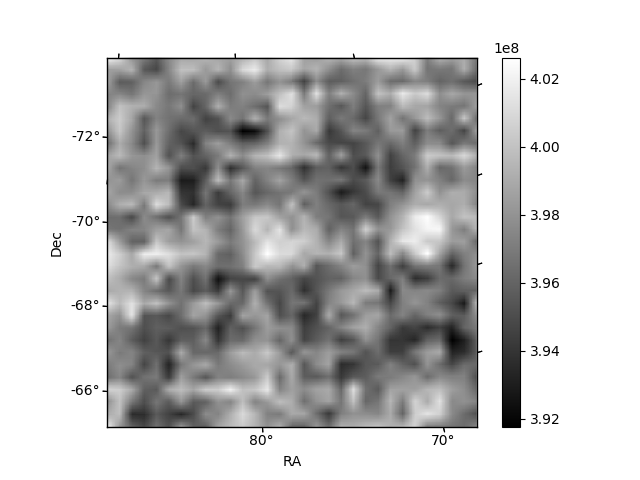
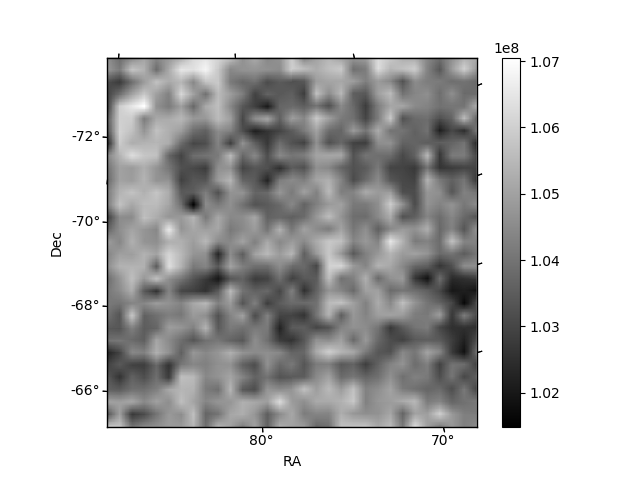
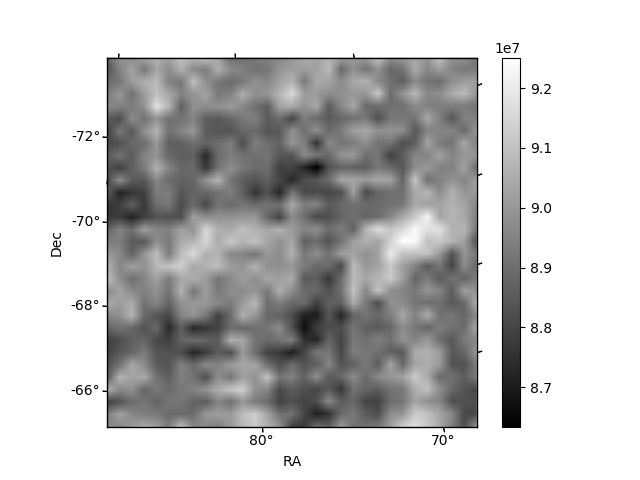
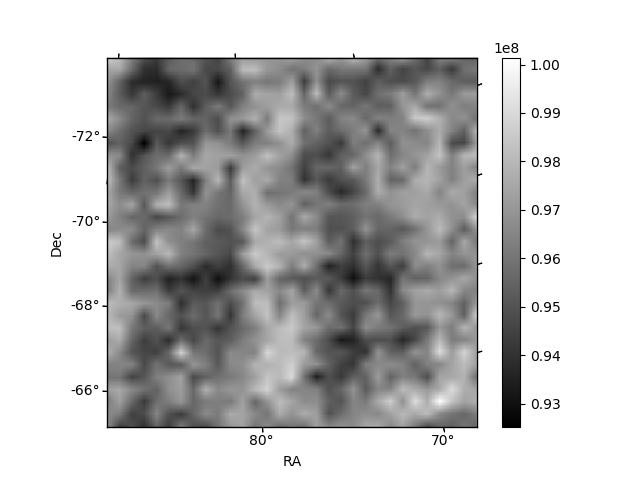
Histogram calculated using DETX and DETY for each event in the final _common_clean file
| Quadrant A | 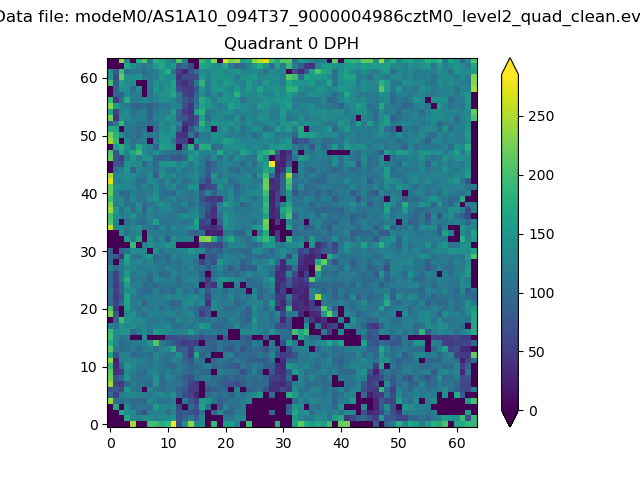 |
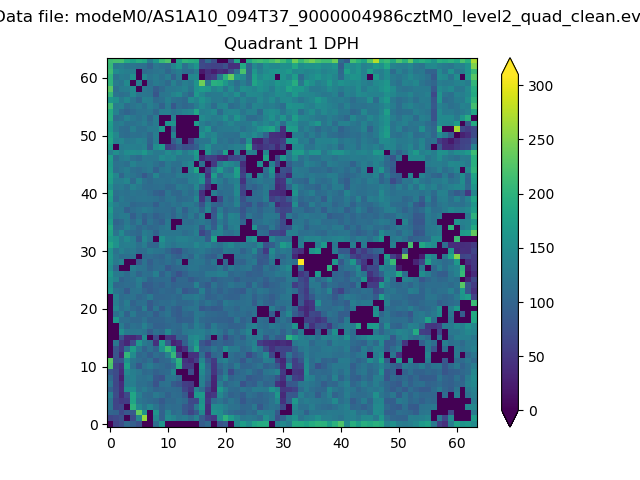 |
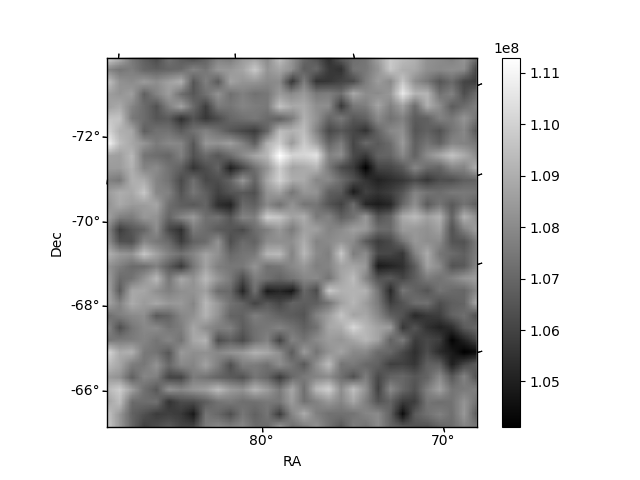
Quadrant B |
|---|---|---|---|
| Quadrant D | 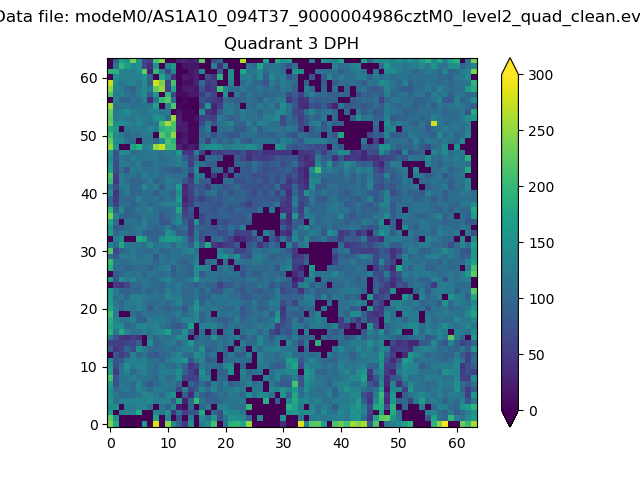 |
 |
Quadrant C |
| Plot type | Count rate plots | Images |
|---|---|---|
| Comparison with Poisson distribution Blue bars denote a histogram of data divided into 1 sec bins. Red curve is a Poisson curve with rate = median count rate of data. |
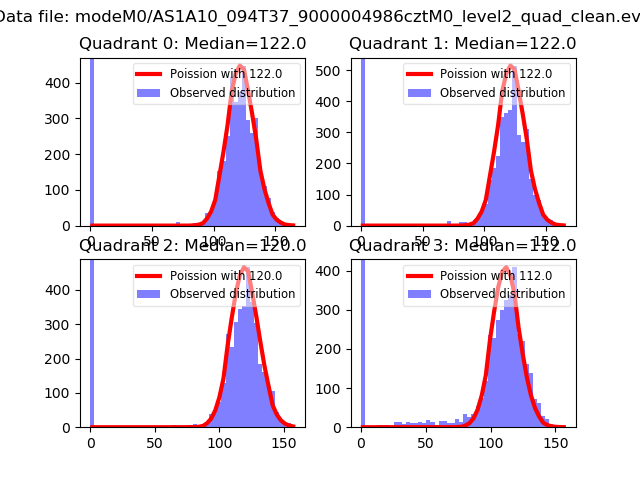 |
 |
| Quadrant-wise count rates Data is divided into 100 sec bins |
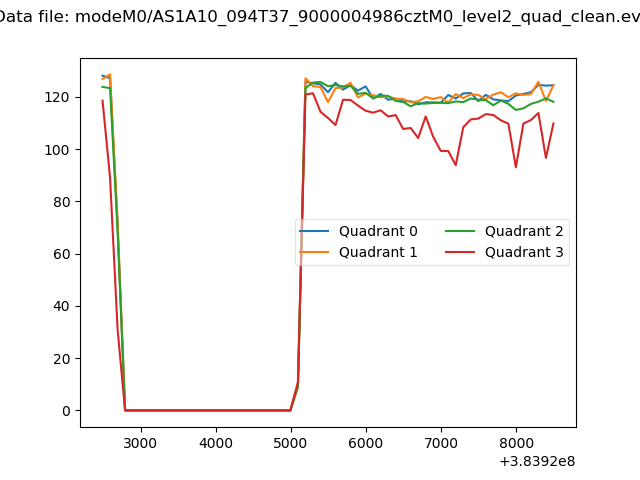 |
|
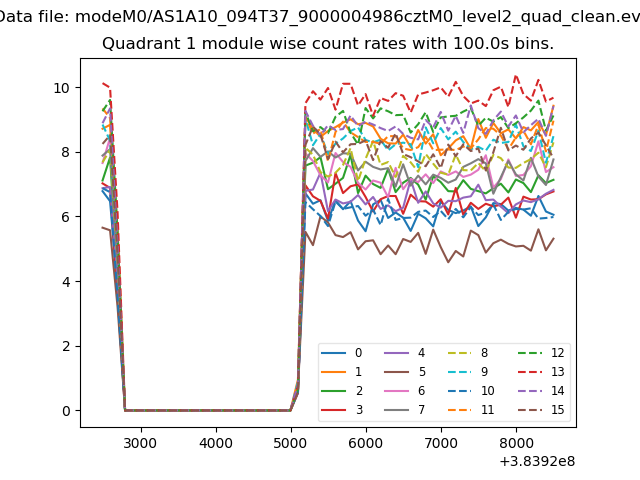
| Module-wise count rates for Quadrant A Data is divided into 100 sec bins |
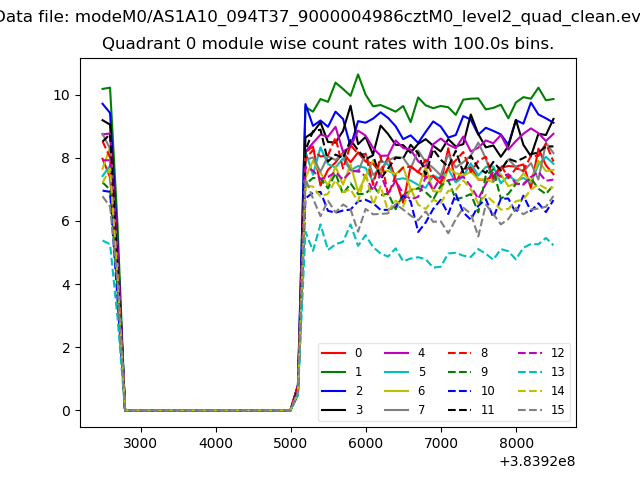 |
 |
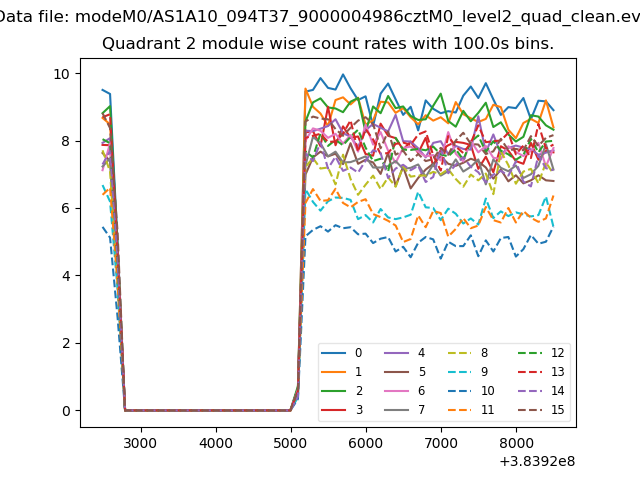
| Module-wise count rates for Quadrant B Data is divided into 100 sec bins |
 |
 |
| Module-wise count rates for Quadrant C Data is divided into 100 sec bins |
 |
 |
| Module-wise count rates for Quadrant D Data is divided into 100 sec bins |
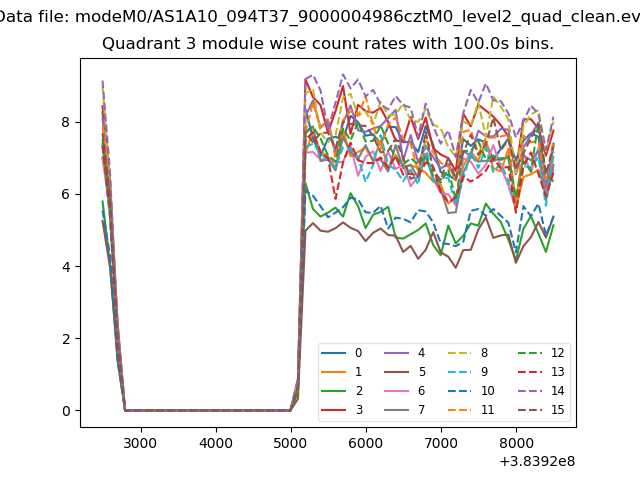 |
 |
| Parameter | Plot |
|---|---|
| CZT HV Monitor | 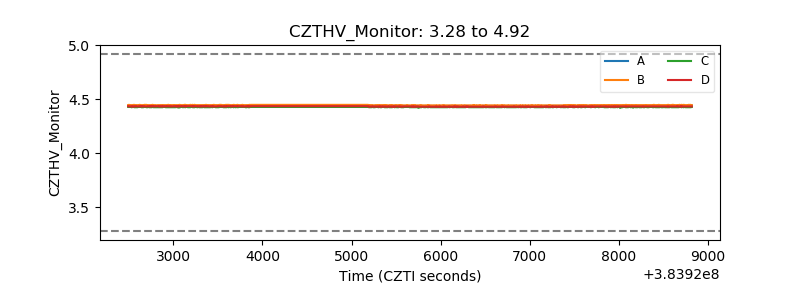 |
| D_VDD | 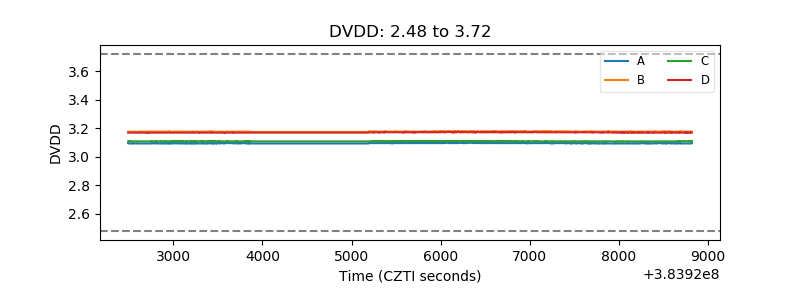 |
| Temperature 1 | 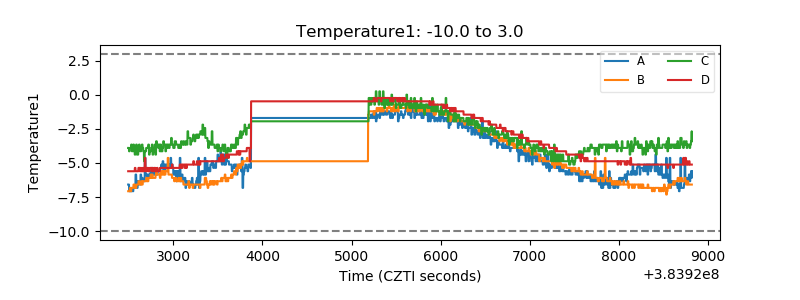 |
| Veto HV Monitor | 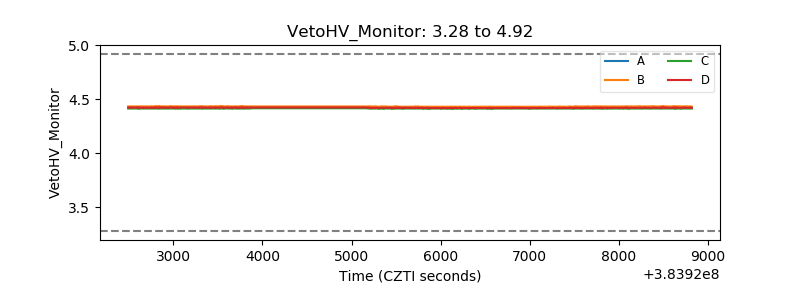 |
| Veto LLD | 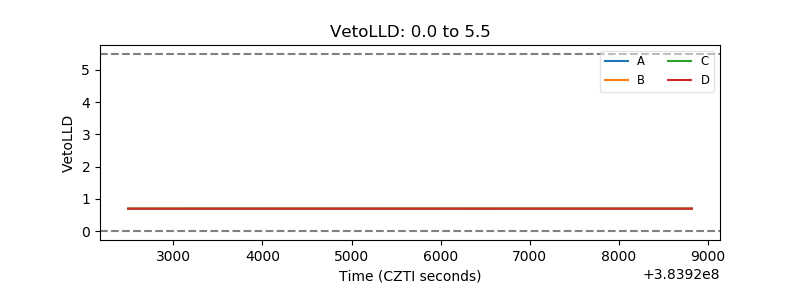 |
| Alpha Counter | 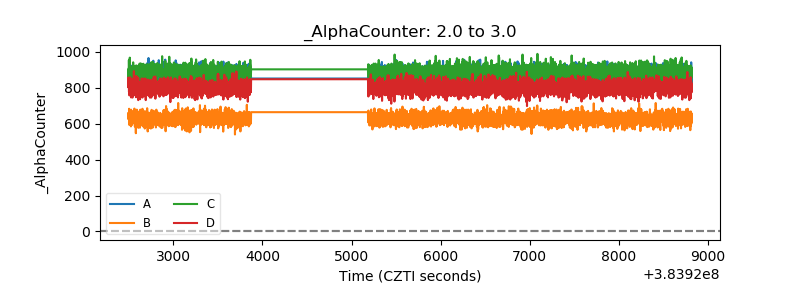 |
| _CPM_Rate | 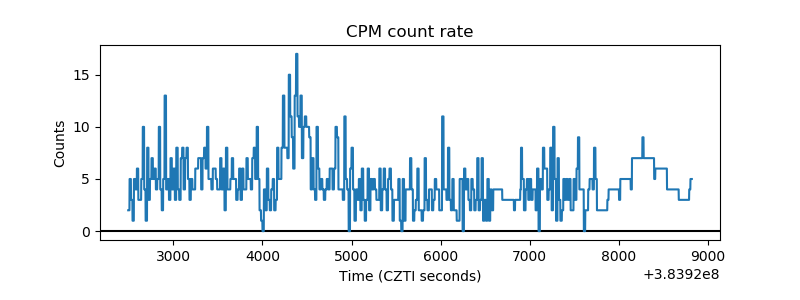 |
| CZT Counter | 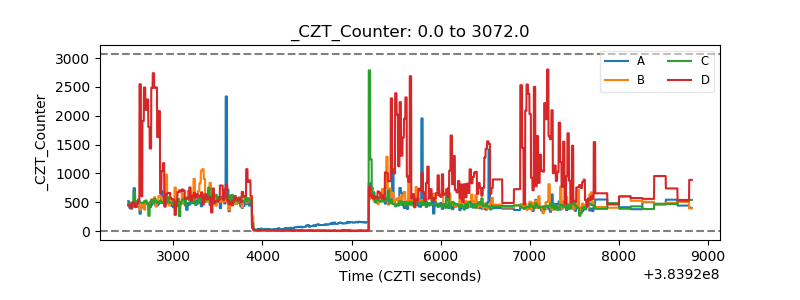 |
| +2.5 Volts monitor | 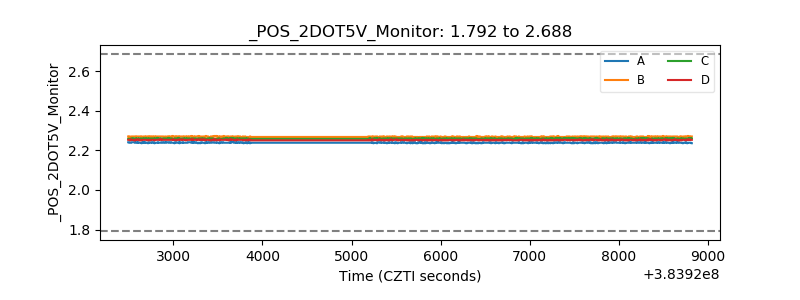 |
| +5 Volts monitor | 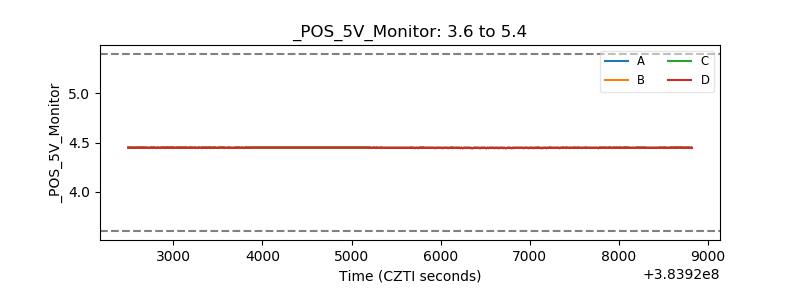 |
| _ROLL_ROT | 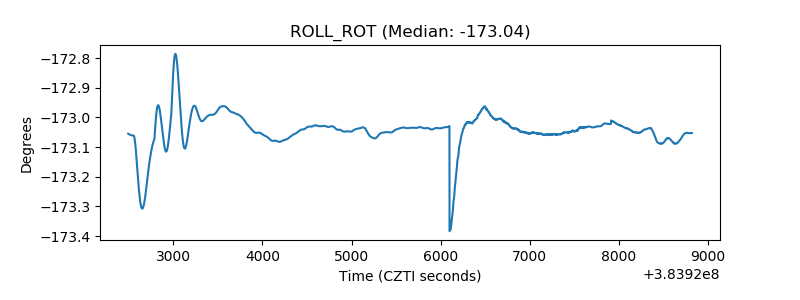 |
| _Roll_DEC | 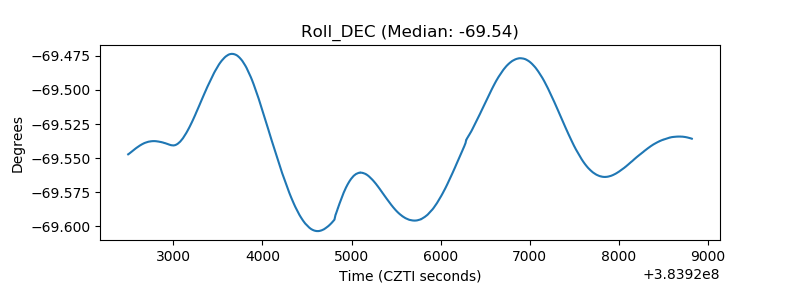 |
| _Roll_RA | 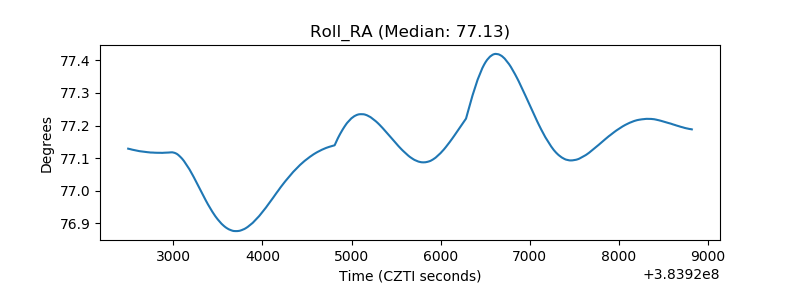 |
| Veto Counter | 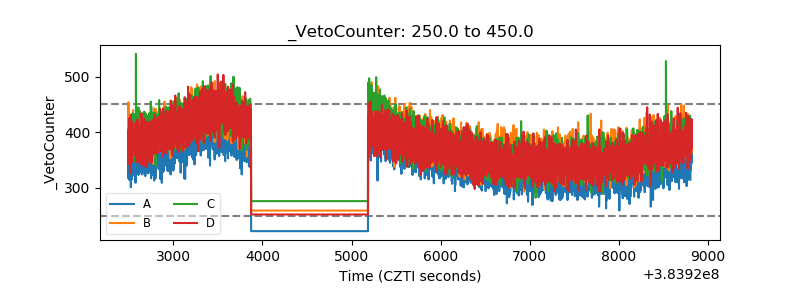 |