| Param | Original file | Final file |
|---|---|---|
| Filename | modeM0/AS1A10_048T04_9000004984_34743cztM0_level2.evt | modeM0/AS1A10_048T04_9000004984_34743cztM0_level2_quad_clean.evt |
| Size (bytes) | 502,344,000 | 47,652,480 |
| Size | 479.1 MB | 45.4 MB |
| Events in quadrant A | 2,857,765 | 282,351 |
| Events in quadrant B | 5,065,911 | 262,390 |
| Events in quadrant C | 2,666,551 | 282,685 |
| Events in quadrant D | 4,288,501 | 268,238 |
| Mode SS | |||
|---|---|---|---|
| Quadrant | BADHDUFLAG | Total packets | Discarded packets |
| A | 0 | 102 | 0 |
| B | 0 | 102 | 0 |
| C | 0 | 102 | 0 |
| D | 0 | 102 | 0 |
| Mode M0 | |||
|---|---|---|---|
| Quadrant | BADHDUFLAG | Total packets | Discarded packets |
| A | 0 | 11482 | 3 |
| B | 0 | 18255 | 2 |
| C | 0 | 10505 | 2 |
| D | 0 | 16226 | 2 |
| Mode M9 | |||
|---|---|---|---|
| Quadrant | BADHDUFLAG | Total packets | Discarded packets |
| A | 0 | 25 | 0 |
| B | 0 | 25 | 0 |
| C | 0 | 25 | 0 |
| D | 0 | 26 | 0 |
| Quadrant | Total seconds | Saturated seconds | Saturation percentage |
|---|---|---|---|
| A | 4936 | 18 | 0.364668% |
| B | 4936 | 983 | 19.914911% |
| C | 4936 | 23 | 0.465964% |
| D | 4936 | 176 | 3.565640% |
Noise dominated data is calculated using 1-second bins in cleaned event files. If a bin has >2000 counts, and if more than 50% of those come from <1% of pixels, then it is considered to be noise-dominated and hence unusable.
| Quadrant | # 1 sec bins | Bins with >0 counts | Bins with >2000 counts | High rate bins dominated by noise | Noise dominated (total time) | Noise dominated (detector-on time) | Marked lightcurve |
|---|---|---|---|---|---|---|---|
| A | 6939 | 4937 | 8 | 8 | 0.12% | 0.16% | 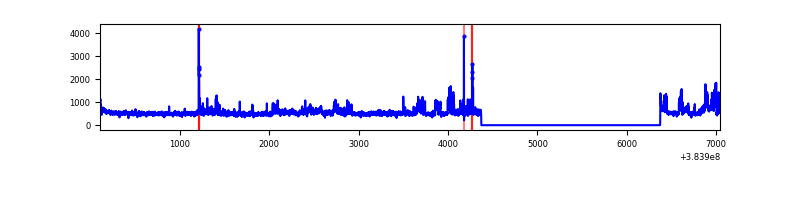 |
| B | 6939 | 4937 | 735 | 735 | 10.59% | 14.89% | 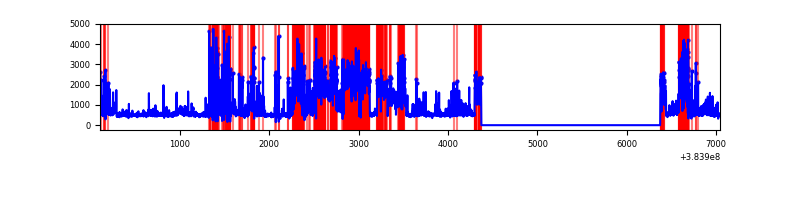 |
| C | 6939 | 4937 | 15 | 15 | 0.22% | 0.30% | 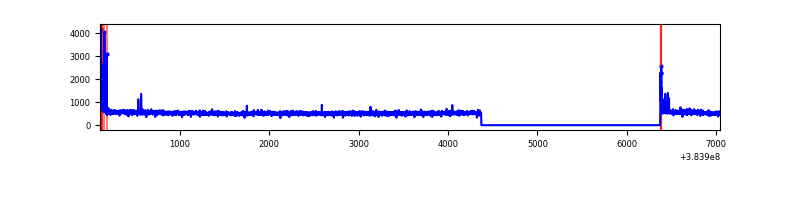 |
| D | 6939 | 4937 | 140 | 140 | 2.02% | 2.84% | 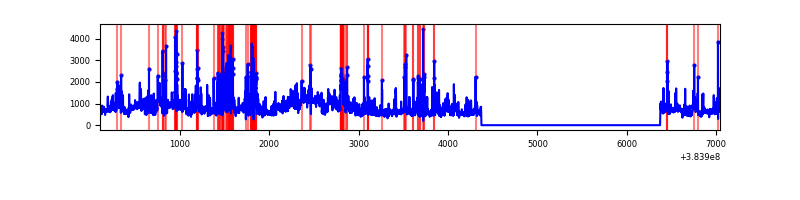 |
Top three noisy pixels from each quadrant. If the there are fewer than three noisy pixels in the level2.evt file, extra rows are filled as -1
| Pixel properties | Quadrant properties | ||||||
|---|---|---|---|---|---|---|---|
| Quadrant | DetID | PixID | Counts | Sigma | Mean | Median | Sigma |
| A | 15 | 169 | 336758 | 2734.97 | 608 | 598 | 122.9 |
| A | 15 | 223 | 108454 | 877.51 | 608 | 598 | 122.9 |
| A | 10 | 83 | 46253 | 371.45 | 608 | 598 | 122.9 |
| B | 4 | 171 | 2460025 | 23001.36 | 554 | 540 | 106.9 |
| B | 5 | 172 | 178745 | 1666.59 | 554 | 540 | 106.9 |
| B | 0 | 190 | 170139 | 1586.1 | 554 | 540 | 106.9 |
| C | 15 | 214 | 213270 | 1547.62 | 595 | 603 | 137.4 |
| C | 0 | 10 | 87244 | 630.51 | 595 | 603 | 137.4 |
| C | 14 | 67 | 34422 | 246.11 | 595 | 603 | 137.4 |
| D | 8 | 195 | 1048909 | 7266.24 | 588 | 571 | 144.3 |
| D | 2 | 250 | 387214 | 2679.9 | 588 | 571 | 144.3 |
| D | 7 | 223 | 168628 | 1164.84 | 588 | 571 | 144.3 |
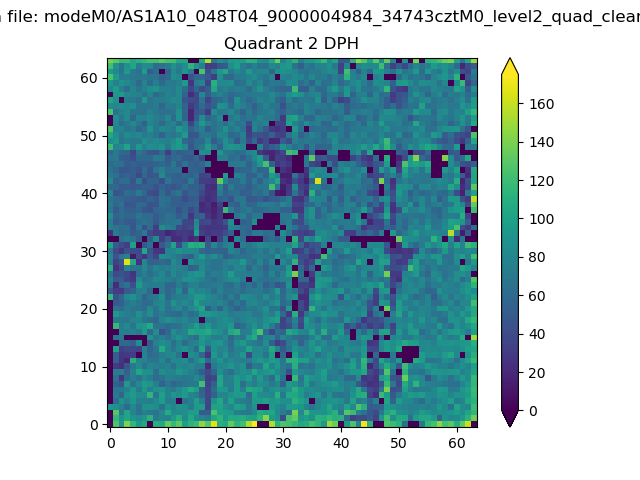
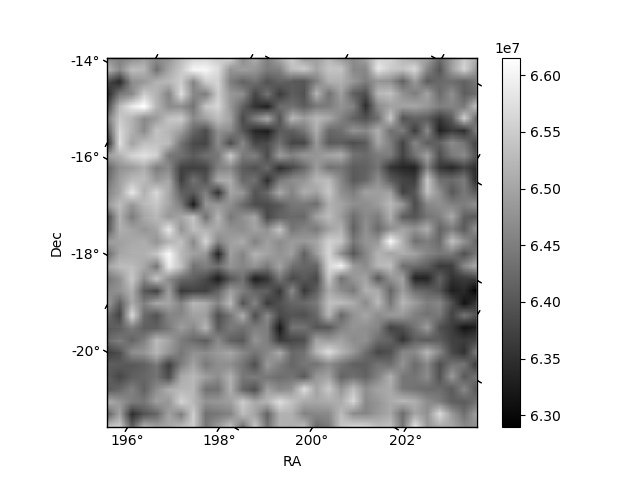
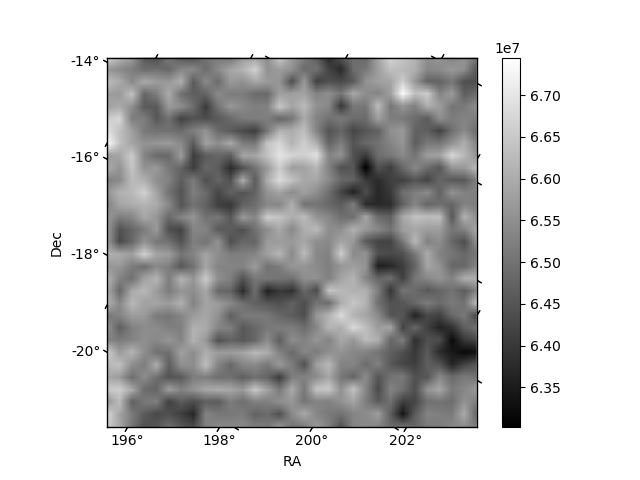
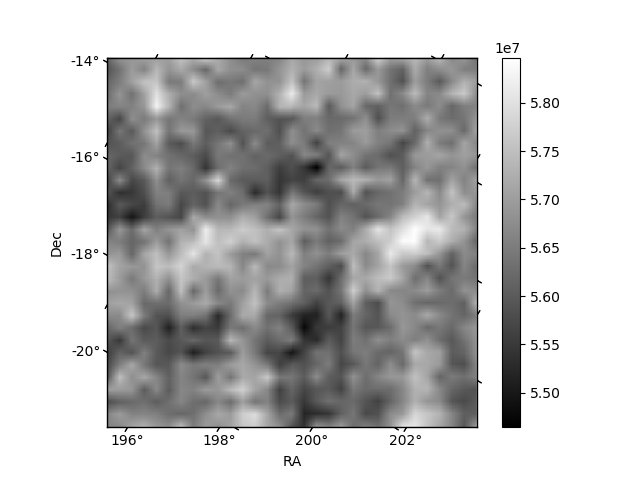
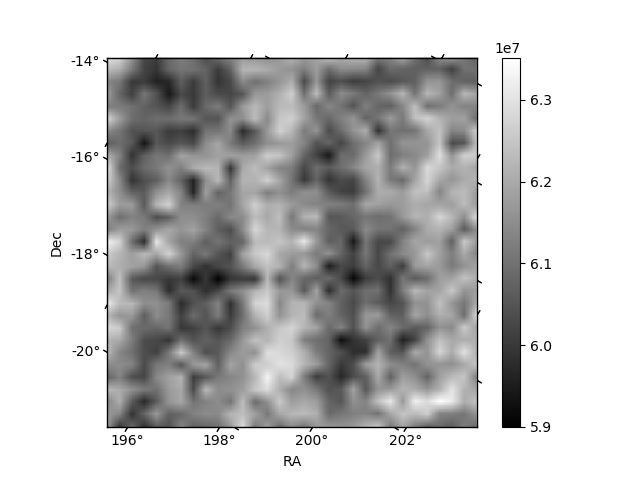
Histogram calculated using DETX and DETY for each event in the final _common_clean file
| Quadrant A | 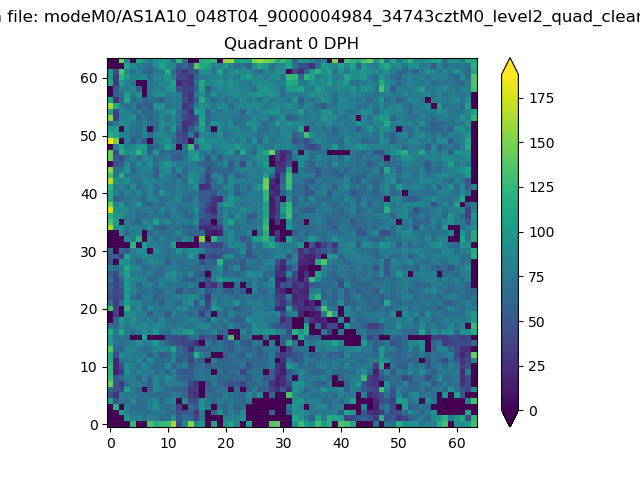 |
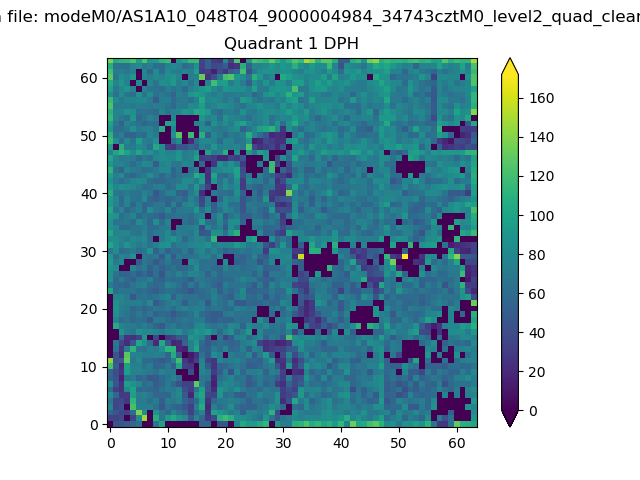 |
Quadrant B |
|---|---|---|---|
| Quadrant D | 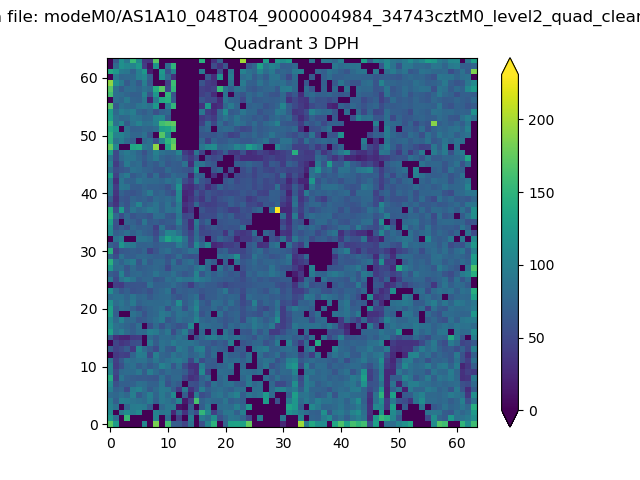 |
 |
Quadrant C |
| Plot type | Count rate plots | Images |
|---|---|---|
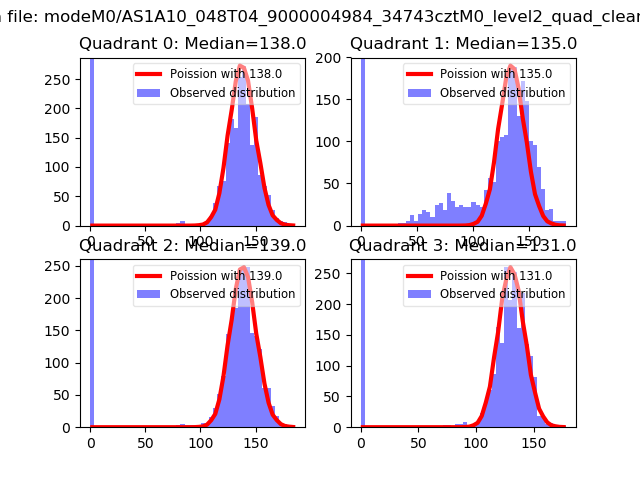
| Comparison with Poisson distribution Blue bars denote a histogram of data divided into 1 sec bins. Red curve is a Poisson curve with rate = median count rate of data. |
 |
 |
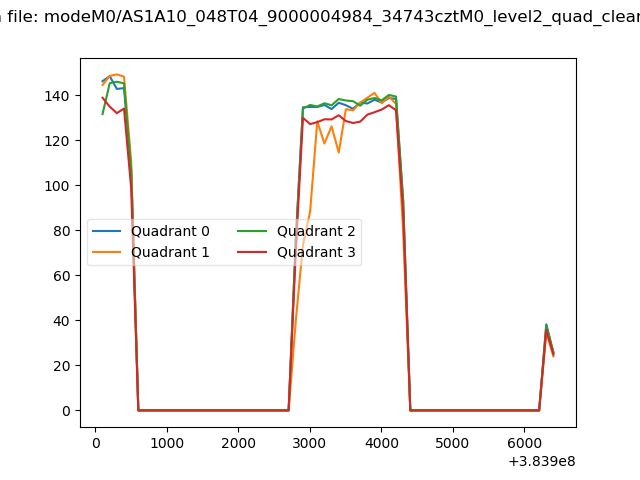
| Quadrant-wise count rates Data is divided into 100 sec bins |
 |
|
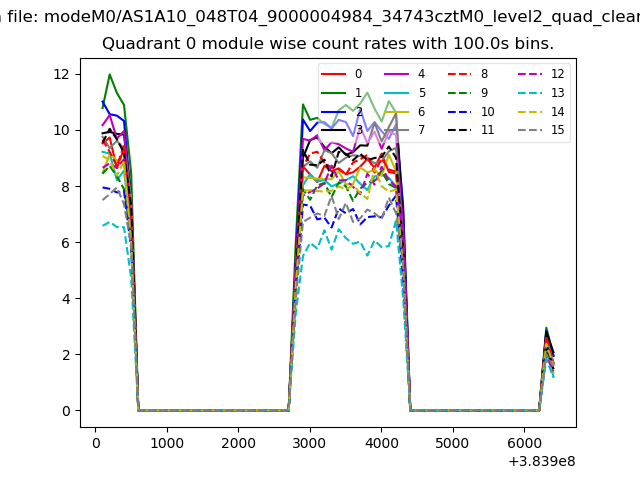
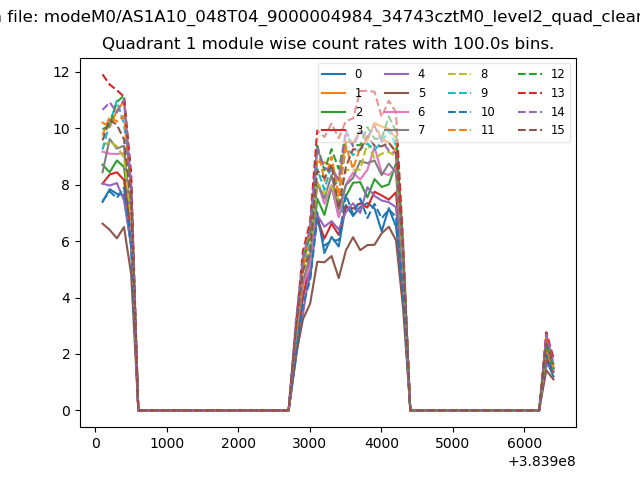
| Module-wise count rates for Quadrant A Data is divided into 100 sec bins |
 |
 |
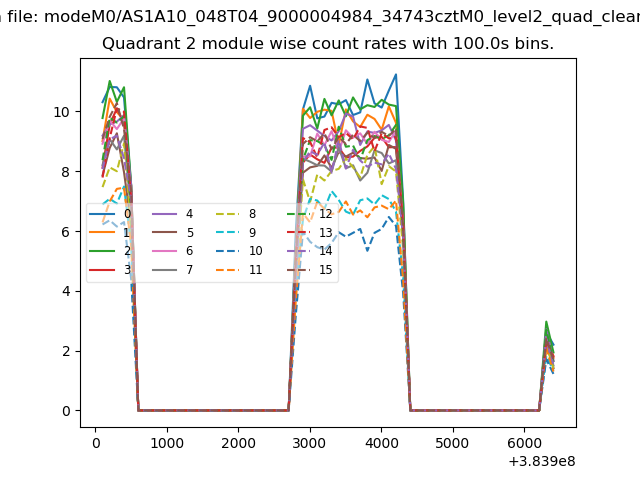
| Module-wise count rates for Quadrant B Data is divided into 100 sec bins |
 |
 |
| Module-wise count rates for Quadrant C Data is divided into 100 sec bins |
 |
 |
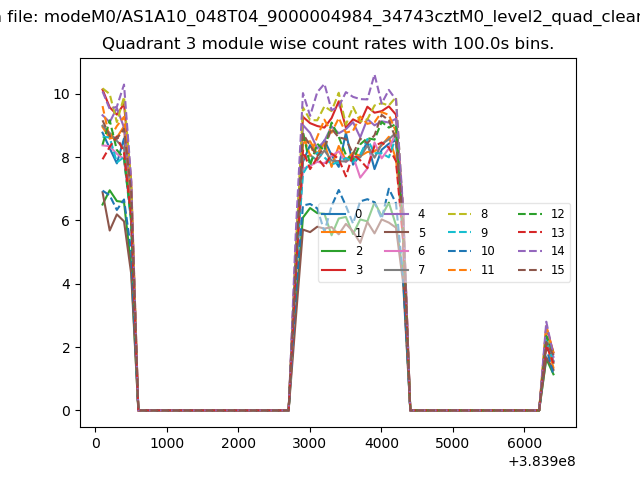
| Module-wise count rates for Quadrant D Data is divided into 100 sec bins |
 |
 |
| Parameter | Plot |
|---|---|
| CZT HV Monitor |  |
| D_VDD | 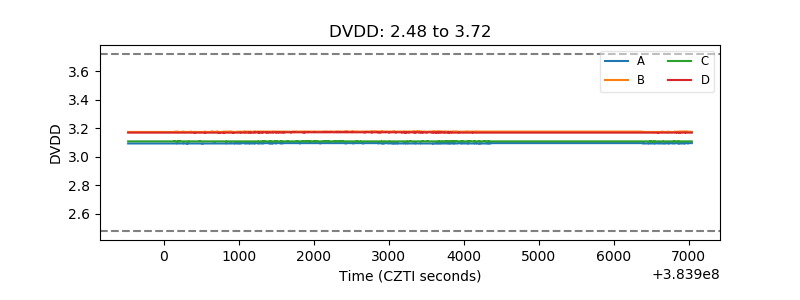 |
| Temperature 1 | 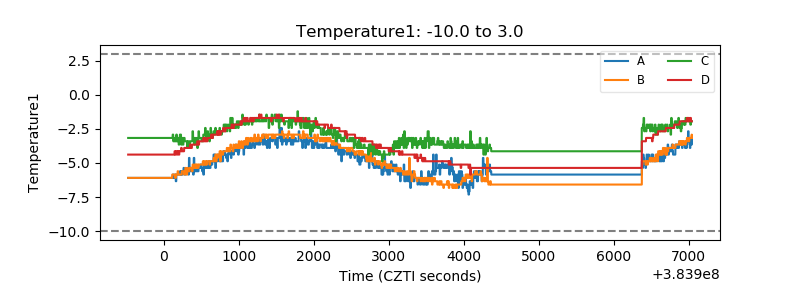 |
| Veto HV Monitor | 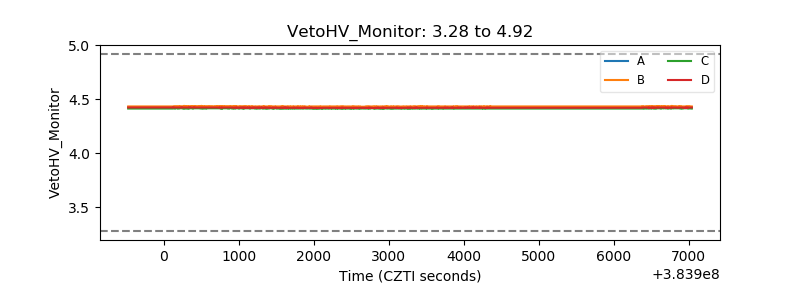 |
| Veto LLD | 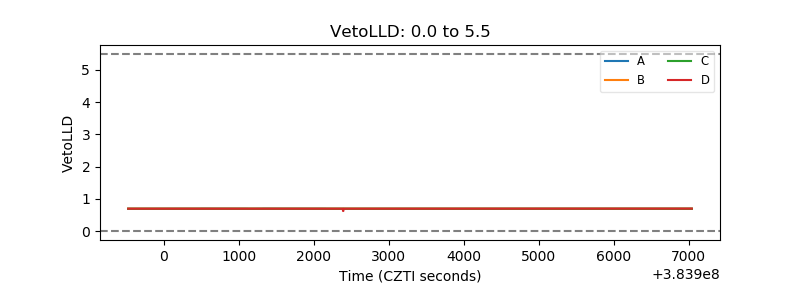 |
| Alpha Counter | 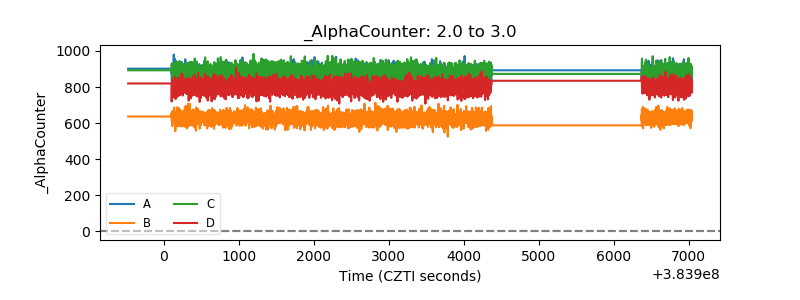 |
| _CPM_Rate | 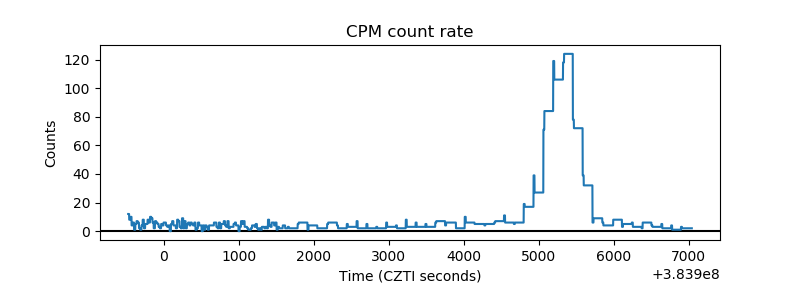 |
| CZT Counter | 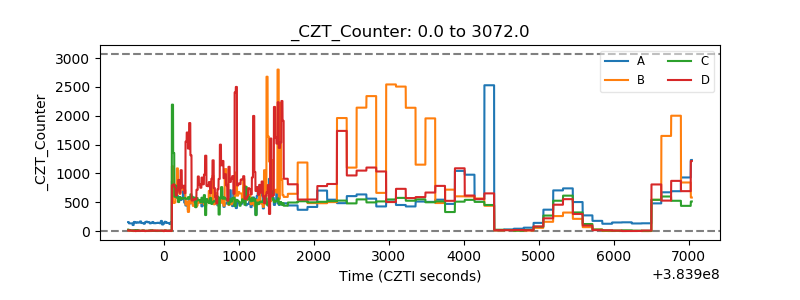 |
| +2.5 Volts monitor |  |
| +5 Volts monitor |  |
| _ROLL_ROT | 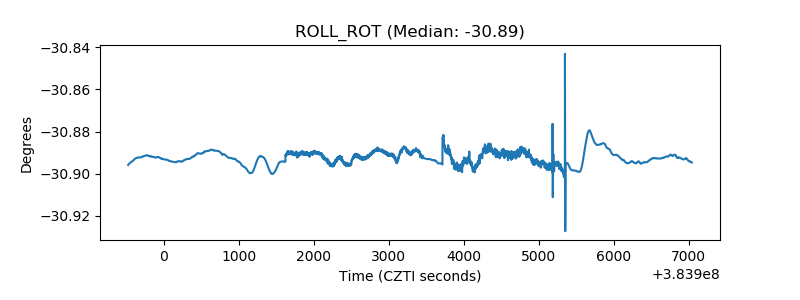 |
| _Roll_DEC | 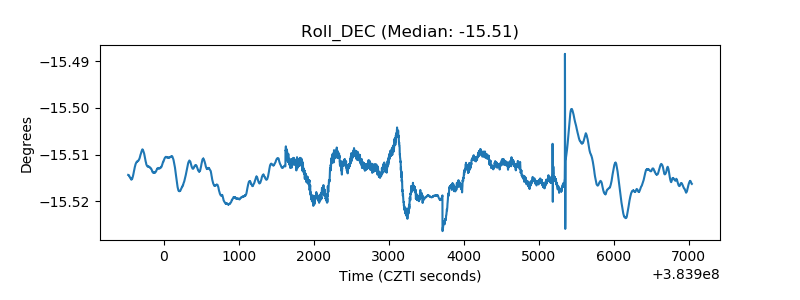 |
| _Roll_RA | 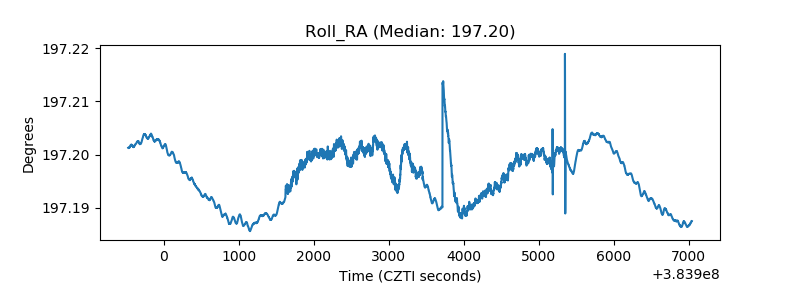 |
| Veto Counter | 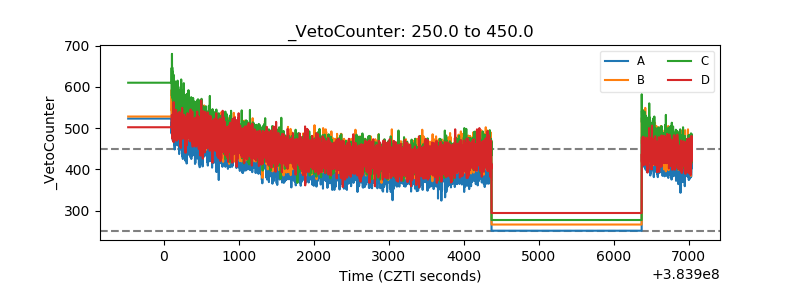 |